Upgrade to Pro — share decks privately, control downloads, hide ads and more …

LNG的故事 - 王釿鋊 主任

LNG的故事 - 王釿鋊 主任

LNG的故事 - 王釿鋊 主任

learnenergy

May 05, 2020
Tweet

More Decks by learnenergy

Other Decks in Education

Transcript

  1. Some properties of LNG • As fuel: nontoxic, low particle

    emissions, almost no sulfur oxides and a low level of nitrogen oxides. • B.P. : –162°C (–259°F), in well-ventilated areas, natural gas burns with a low laminar burning velocity and has high ignition energy relative to other hydrocarbon fuels. • Density : 430 kg/m3 and 470 kg/m3 (3.5 to 4 lb/US gal), LNG floats on top of water and vaporizes rapidly because it is much lighter than water. • The flammability limits are 5 % and 15 % by volume in air. • Natural gas vapor in open areas has not produced unconfined vapor cloud explosions (UVCE), which are more prevalent with higher hydrocarbons. • The conditions needed to produce an unconfined vapor cloud explosion of natural gas are generally not present in an LNG facility, so such explosions should not be considered as potential hazards.
  2. 我國電力與天然氣供給現況 全國總發電量 2,736 億度 資料來源:經濟部能源局,統計月報,民 108。 民國107年全國發電量及占比(燃料別) 6,209,357 7,000,704 7,300,742

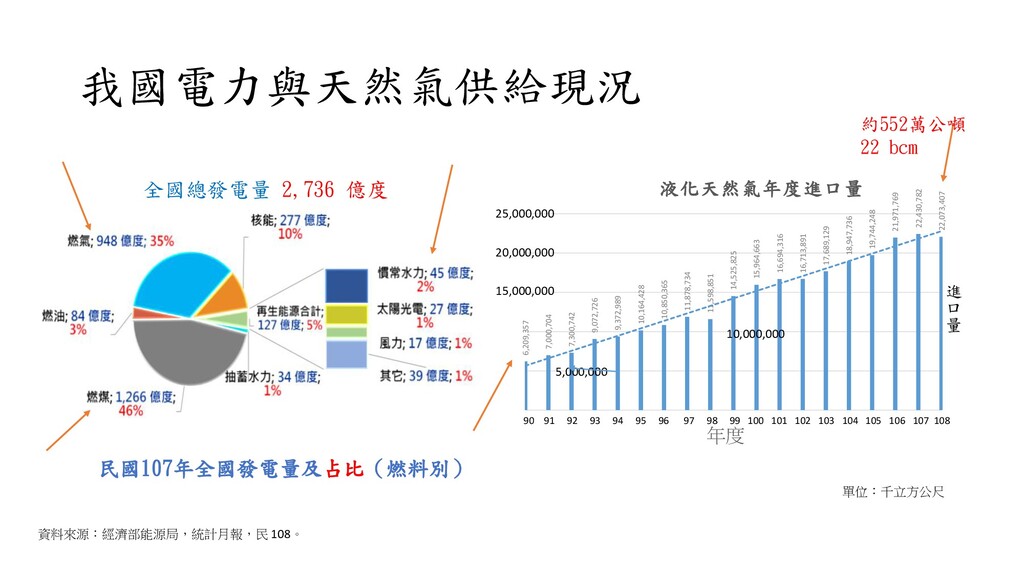
    9,072,726 9,372,989 10,164,428 10,850,365 11,878,734 11,598,851 14,525,825 15,964,663 16,694,316 16,713,891 17,689,129 18,947,736 19,744,248 21,971,769 22,430,782 22,073,407 年度 液化天然氣年度進口量 25,000,000 20,000,000 15,000,000 5,000,000 10,000,000 進 口 量 單位:千立方公尺 90 91 92 93 94 95 96 97 98 99 100 101 102 103 104 105 106 107 108 約552萬公噸 22 bcm
  3. 發電結構規劃 民國108~114年能源發電結構配比圖 • 114年燃氣發電占比 50%、再生能源發電 20%、燃煤發電占比 27%,及其它能源發電 占比 3%。 •

    已規劃中油公司第三接收站(新建)、台中接 收站(擴建)計畫,及台電公司協和接收站 (新建)、台中港接收站(新建)計畫。 • 預估114年供氣達2,620萬噸,可滿足當年國 內天然氣預估需求2,490萬噸。 • 儲槽容積天數:在現行接收站規劃順利如期 如質完工下,儲槽容積天數於114年提升至 20天。 • 安全存量天數:規劃我國安全存量天數由現 行7天,於114年提升至11天。
  4. Global primary energy demand trends by fuel type (Mtoe) Source:

    GECF Secretariat based on data from the GECF GGM Note: Bioenergy includes traditional and modern biomass. Renewables include solar, wind, tidal and geothermal energy ➢ Fossil fuels will continue to dominate the global energy mix and will amount to 71% in 2050, against 81% in 2018. ➢ Oil will remain an important source of energy, but its share is expected to fall to 26%. ➢ Coal will drop sharply, providing only 18%. ➢ Natural gas will be the only hydrocarbon resource to increase its share, from 23% today to 27% in 2050. 26% 18% 27% 23%
  5. Outlook on global natural gas production expansion by region Source:

    GECF Secretariat based on data from the GECF GGM ➢ Natural gas is projected to rise by 1.3% per annum from 3,924 bcm in 2018 to 5,966 bcm by 2050 driven by environmental concerns, air quality issues, coal-to-gas switching as well as economic and population growth. ➢ Unconventional resources share of overall output is expected to rise from 25% to 38% by 2050. ➢ Yet-to-find production will also be vital, highlighting the need for increased exploration for new gas reserves. bcm
  6. Natural gas demand by region & sector, & consumption per

    capita – World Source: CIA World Factbook - information in this page is accurate as of January 1, 2019. (cubic meters per person) Taiwan 953 2331 881 1008 3289 3467 1928 172 1160 622 bcm
  7. Major trade movements 2018 Trade flows worldwide (billion cubic metres)

    ➢ 東亞需求依賴進口LNG為主 ➢ 西歐以管線供應為主 ➢ 大陸管線與LNG並重
  8. Year Jan Feb Mar Apr May Jun Jul Aug Sep

    Oct Nov Dec 2015 0 0 0 0 2,748 2,754 0 0 2,755 0 0 0 2016 0 0 0 0 0 0 0 0 0 0 0 0 2017 0 0 0 0 2,949 0 0 0 0 3,121 2,934 0 2018 0 6,806 0 0 0 3,268 3,234 0 0 0 0 3,423 2019 0 0 0 6,349 3,309 0 0 7,207 0 3,138 3,736 3,658 2020 9,317 - = No Data Reported; -- = Not Applicable; NA = Not Available; W = Withheld to avoid disclosure of individual company data. Release Date: 3/31/2020 Next Release Date: 4/30/2020 Liquefied U.S. Natural Gas Exports by Vessel to Taiwan ⚫ Trump 修改美國能源出口規定 ⚫ 2019進口量約776km3, 約佔我國進口量 0.0035%. ⚫ 頁岩油氣生產成本高於傳統天然氣 (Million Cubic Feet)
  9. Distribution of proved reserves in 1998, 2008 and 2018 BP

    Statistical Review of World Energy 2019 As of January 1, 2019, there were an estimated 7,177 trillion cubic feet (Tcf) of total world proved reserves of gross natural gas. (%) ➢ Total proved reserves increase 50%, from 1998 – 2018 ➢ Middle east account for ca. 38%, followed by CIS for 32%.
  10. Reserves-to-production (R/P) ratios ➢ World proved gas reserves in 2018

    increased by 0.7 Tcm to 196.9 Tcm mainly as a result of increased reserves in Azerbaijan (0.8 Tcm). ➢ Russia (38.9 Tcm), Iran (31.9 Tcm) and Qatar (24.7 Tcm) are the countries with the biggest reserves. ➢ The current global R/P ratio shows that gas reserves in 2018 accounted for 50.9 years of current production, 2.4 years lower than in 2017. ➢ Middle East (109.9 years) and CIS (75.6 years) are the regions with the highest R/P ratio.
  11. Production volume versus distance to market framework for gas technologies

    NG or LNG Comparison of the cost of transporting gas via pipeline and LNG; for 1 tcf/yr and including regasification costs Mokhatab et al., 2006; Economides and Mokhatab, 2007
  12. Typical LNG production plant Liquefaction single train size capacity growth

    history updated in 2012. Original diagram published and discussed in Wood and Mokhatab (2007a) and Wood (2012). ➢ knowledge of the precipitation conditions for gas streams is essential in minimizing downtime for cleanup and repairs. ➢ In the cryogenic processing of natural gas mixtures, species such as CO2 and the heavier hydrocarbons can form solids. The latter might coat heat exchangers and foul expansion devices, leading to process shutdown and/or costly repairs. ➢ The specifications to be met are H2 S removal to under 4 ppmv, CO2 to 50 ppmv, total sulfur under 30 ppmv as S, water to 0.1 ppmv, and mercury (Hg) to levels of 0.01 mg/Nm3 Typical Composition of LNG from Various Liquefaction Plants
  13. Typical emission sources in the LNG supply chain ◆ The

    majority of the CO2 emissions is from the gas processing and liquefaction step, following by LNG shipping and the LNG regasification • Improved plant efficiency on liquefaction cycles and equipment • CO 2 reinjection from the amine unit for sequestration • More efficient power plant for ship propulsion • Utilization of LNG cold in the receiving terminals.
  14. Way to lower CO2 emissions (Neeraas and Marak, 2011) CO2

    reduction stairs. Employing updated technologies 1. CO2 reinjection for sequestration, 2. more efficient mixed refrigeration liquefaction cycle, 3. waste heat recovery, 4. cold seawater for cooling, 5. more efficient aeroderivative gas turbines, 6. combined cycle power plant. 7. The use of ORV instead of SCV can save 15% of the natural gas fuel. 8. LNG cold is used for air separation, the energy efficiency will be further improved.
  15. Natural gas liquefaction Typical natural gas cooling curve ➢ Illustrates

    the cooling curves for a natural gas system, and the heating curves for a propane-precooled/mixed (C3- MR) refrigerant system and a three-refrigerant classical cascade refrigerant system. ➢ the most thermodynamically efficient liquefaction process : a refrigerant or a mixed refrigerant system that can duplicate the shape of the natural gas cooling curve at operating pressure
  16. Simplified flowscheme of the Cascade cycle Simplified flowscheme of the

    Cascade cycle Six GE-5C gas turbines distributed in pairs over the three refrigerant loops. multiple refrigerant system three stage cycles four stage cycle core-in-kettle type heat exchangers and plate-fin heat exchangers runs flashing into the LNG tank total three electricity generation gas turbines of 20 MWe for power supply • reduces the irreversible heat exchange, • flexible in operation, • low heat exchanger surface area requirement and low power requirement offset the cost of having multiple machines , • low technical risks and the utilization of standard equipment, relatively high capital investments, • insufficient flexibility/adaptation to variations in natural gas composition, • and production train capacity limitations • two modifications : the optimized cascade (developed by Conoco-Phillips) and the mixed-fluid cascade (elaborated by Linde and Statoil).
  17. Simplified flowscheme of the Single Mixed Refrigerant Process • Involves

    an inverse or reverse Rankine cycle in which the gas is chilled and liquefied in a single heat exchanger. • The mixed refrigerant is a mixture of several compounds (mainly hydrocarbon with low boiling points and nitrogen), and the optimum composition is determined by the feed composition, feed pressure, liquefaction plant pressure, and ambient temperature. • Due to its relatively low thermal efficiency, the single mixed refrigerant cycle is mainly suited to mid-sized and small-scale plants where low cost and simplicity are the deciding factor in the plant economics. Simplified flowscheme of the Single Mixed Refrigerant Process one refrigerant provides the total cooling from ambient to LNG temperatures at one pressure level plate-fin or spoolwound heat exchangers pre-cooled and liquefied in the same heat exchangers
  18. Simplified flowscheme of the Dual Mixed Refrigerant process • precooled

    by a heavier mixed refrigerant and condensed by a lighter mixed refrigerant • The heat exchangers are commonly half the height and size of the heat exchangers used in a single mixed refrigerant (SMR) process • The downside of this modification is the higher process complexity and the higher processing equipment counts. Simplified flowscheme of the Dual Mixed Refrigerant process mixture of methane, ethane, propane and butane as precooling medium, fully condensed against air and subsequently auto-cooled and expanded to provide refrigeration duty a three stages pre-cooling cycle The liquefaction circuit system resemble to a large extent the liquefaction circuit of the C3/MR process
  19. Simplified flow scheme of the Nitrogen Expansion process • Expansion

    cycle has been greatly improved due to the advances in high efficiency turbo-expanders (typically over 85%). • The heat curves of expander liquefaction processes have a relatively large temperature gap between refrigerant and cooling gas, typically at the warm end of the natural gas cooling curve. • The refrigerant, either nitrogen or methane, is a light volatile component that is a better refrigerant for low temperature cooling. • less sensitive to changes in feed gas compositions • suitable for small LNG plants (such as BOG liquefaction) and less suitable for large- scale base load plants. Simplified flowscheme of the Nitrogen Expansion process Propane as precooling medium and Nitrogen as liquefaction refrigerant plate-fin or spoolwound heat exchangers four-stage
  20. Simplified flowscheme of the propane/MR process Simplified flowscheme of the

    propane/MR process • propane as pre-cooling medium • a mixed refrigerant (nitrogen, methane, ethane and propane) as liquefaction medium. • natural gas is liquefied in heat exchanger • four-stage propane cycle provides the pre-cooling for the MR and the natural gas. • require two electricity generation gas turbines of 20 MWe to sustain operation. • A relatively low electrical power consumption is achieved because excess power from the C3 compressor gas turbine is transferred to the MR compression gas turbine through an electric coupling. This part of the process is covered by a Shell patent. • This process has dominated the base load LNG technology since the late 1970s with about 75% of the natural gas liquefaction market. GE-7EA driven compression train pumps four stages of propane cooling auto-cooled and expanded spool wound
  21. Comparison of Efficiencies for Different Refrigeration Cycles Liquefaction Capacity by

    Type of Process, 2016-2022 Sources LNG process selection has often been highly influenced by the specific power consumption,(i.e.,kW/ton of LNG). (1) the compressor power required, (2) the heat exchanger surface area requirement, and (3) and the temperature approaches between the heating and cooling curves in the main cryogenic heat exchanger.
  22. LNG cold utilization • To efficiently utilize the LNG cold,

    the cooling curves of the users must closely match the heating curve of LNG. • Unless the LNG terminal is located in an industrial complex, it is difficult to find suitable users that can take full advantage of the LNG cold. • It takes about 230 kW to liquefy one MMscfd of natural gas. About 280 MW of power is consumed in a 1,200 MMscfd liquefaction plant. • The main difficulty in fully utilizing the “LNG Cold” for cooling is to identify users that can use the different temperature levels of refrigeration released during LNG regasification.
  23. LNG cold utilization • From a thermodynamic point of view,

    the most efficient use of LNG is in cooling and as a refrigerant to provide cooling in refinery and petrochemical complexes, such as in air separation, carbon dioxide production, vapor recovery, chilled water production, and hydrocarbon fractionation. • Alternatively, the refrigeration content in LNG can be used as a cold heat sink to generate power. This may not be the most efficient use, but integration to a power plant can eliminate seawater or fuel gas consumption required in regasification since low level waste heat from the power plants are readily available. • To bring the “LNG Cold” to the users, an intermediate heat transfer fluid is required using a closed circuit in transferring the refrigerant to the users. • To minimize the transfer costs, the LNG terminal must be located at the industrial complex, as in Japan’s LNG terminals and in the Jurong Island Terminal in Singapore.
  24. Integrated LNG regasification/power generation Organic Rankine cycle with LNG cold

    energy utilization Integration of LNG regasification/power plant power is produced in three processes: • Cryogenic power cycle • Pressure letdown from the vaporized LNG • Power increase from gas turbine inlet air cooling.
  25. Cryogenic power generation The 150 t/h LNG cryogenic power plant

    will reduce CO2 emissions by approximately 15,000 tons a year. Advantages of cryogenic power generation One of the most preferred method, Replace the cooling water as the heat sink in the cycle, Direct expansion cycle (pressure energy of LNG), rankine cycle, brayton cycle
  26. Desalination Technologies Amount of energy required for different desalination technologies

    Potable water production cost for different desalination technologies
  27. Direct contact type ice generator Seawater freezing desalination process coupled

    with LNG re-gasification Block flow diagram of the natural FT water purification process Direct contact heat transfer is based on the physical interaction that one liquid is dispersed into anther immiscible liquid. The atomization of the liquid makes huge heat transfer area as well as high turbulent flows, permitting a high-efficient heat transfer process.
  28. Direct contact type ice generator • Jacketed cylinder: consists of

    inner and outer cylinders; . The refrigerant is injected into the inner cylinder, subsequently, the refrigerant drops descend from the top of inner cylinder to the bottom of outer cylinder. • Nozzle arrangement : a pair are installed at the bottom of the cylinder lean at an angle of 45 degrees. • Gas floatation: An air diffuser is appointed at the middle of the cylinder to uniformly release air into the ice slurry. The photographs of (a) ice slurry and (b) agglomerated ice crystals The design of direct contact type ice generator
  29. Membrane distillation (MD) ,freeze crystallizer (FC) as alternative reverse osmosis

    concentrate (ROC) treatment options Design diagram for the hybrid FDeMD desalination process utilizing LNG cold energy
  30. Membrane distillation (MD) ,freeze crystallizer (FC) as alternative reverse osmosis

    concentrate (ROC) treatment options Performance of DCMD with actual ROC in terms of permeate flux and permeate quality in three repeated cycles (Tf = 55 °C, Tp =25 °C)
  31. Membrane distillation (MD) ,freeze crystallizer (FC) as alternative reverse osmosis

    concentrate (ROC) treatment options Membrane analysis (SEM image, EDS spectrum and contact angle) of (a) virgin and (b) used ROC membrane
  32. Performance of DCMD with chemically pretreated ROC (a) permeate flux

    and quality comparison with actual ROC for three cycles (Tf = 55°C, Tp =25 °C) (b) used membrane analysis after cycle 3 Membrane distillation (MD) ,freeze crystallizer (FC) as alternative reverse osmosis concentrate (ROC) treatment options
  33. FC treatment with ROC using multi stage freeze/thaw approach Membrane

    distillation (MD) ,freeze crystallizer (FC) as alternative reverse osmosis concentrate (ROC) treatment options
  34. Membrane distillation (MD) ,freeze crystallizer (FC) as alternative reverse osmosis

    concentrate (ROC) treatment options potential coupling of LNG refrigerant coolant with FC ➢ DCMD operation can integrate with alternative heat/ energy sources such as solar and waste heat. ➢ DCMD was able to concentrate the ROC, achieving an average 60% water recovery with an efficient single stage compact system. ➢ FC was able to achieve a 56–57% water recovery with ROC. And a multistage approach was required to obtain this rate of recovery. ➢ Membrane scaling, lifespan of the membrane for a long-term MD operation are some of the issues need to be concerned. ➢ The MD water recovery was reduced in repeated cycles of operation with ROC treatment. But it is not for RC.
  35. Desalination Technologies • World water resources are mainly salty (97.5%)

    and fresh water (2.5%). Fresh water is either stored underground (30%) or in the form of ice / snow covering mountainous regions, Antarctic and Arctic (70%) but only 0.3% is usable by humans. • Desalination technologies are divided into three major groups, namely: (i) thermally activated systems(evaporation and condensation are the main processes): multi-stage flash distillation (MSF), multiple-effect distillation (MED), vapor compression distillation (MVC), humidification - dehumidification desalination (HDH), solar distillation (SD) and freezing (Frz). (ii) pressure-activated systems(a pressure is applied, water is forces through a membrane, leaving salts behind): reverse osmosis (RO), forward osmosis (FO), electro-dyalysis (ED) and nanofiltration (NF). (iii) chemically-activated desalination: ion-exchange desalination (I.Ex), liquid–liquid extraction (LLE) and gas hydrate (G.Hyd) or other precipitation schemes, adsorption technology (Ads). Air separation with LNG cold energy utilization Air separation with LNG cold energy utilization
  36. CO2 capture and Air separation by utilizing LNG cold energy

    Cryogenic carbon dioxide capture with LNG cold energy utilization Air separation with LNG cold energy utilization