Upgrade to Pro — share decks privately, control downloads, hide ads and more …

Benchmarks: Avoding Lies & Damn Lies

Benchmarks: Avoding Lies & Damn Lies

Setting up effective benchmarks takes some planning, running them careful execution. This talk describes some steps that will help benchmarking any code with examples using Perl5.

Steven Lembark
PRO

July 09, 2022
Tweet

More Decks by Steven Lembark

Other Decks in Technology

Transcript

  1. Benchmarks: Avoding Lies & Damn Lies
    Steven Lembark
    Workhorse Computing
    [email protected]

    View Slide

  2. What are “benchmarks”?
    Generally, two kinds:
    Performance (a.k.a., “lies”, “damn lies”).
    Functionality (different subject).
    Different needs.
    Similar requirements.

    View Slide

  3. Functionality Benchmarks
    “Does it do what I need?”
    Utility not speed.
    “Integration” testing (vs. unit).
    Nice with Perl using HTTP, Selenium, DBI.
    Not what I’m describing here.

    View Slide

  4. Performance benchmarks.
    Good:
    Time for specific tasks.
    Objective, realistic tasks.
    Garbage:
    ”Twice the speed of our competition”

    View Slide

  5. Perl is nice for testing
    Making other code run.
    “Duct tape with timers.”
    Perl makes it manageable with:
    %ENV
    Forks
    Sockets & Pipes

    View Slide

  6. Designing & Execution
    Code & environment.
    Unstable environments == unusable timings.
    Background noise easily swamps data.
    Watch system around the test.
    Repeat tests.

    View Slide

  7. You may have all the time(1) you need
    Simple end-to-end test:
    time your_thing_here;
    Subjective vs. objective time.
    Multiple iterations to get averages.

    View Slide

  8. What kind of time do you have?
    Wallclock: Observed by user.
    User: What your program runs.
    System: Time for kernel services.
    You cannot control wallclock.
    Includes latency from timeslice, stolen VM time.

    View Slide

  9. Basline: Time to do nothing
    Check startup time.
    Affected by O/S, disk.
    Run multiple times:
    see effects of buffering.
    $ time perl -e 0
    real 0m0.005s
    user 0m0.000s
    sys 0m0.000s
    $ time bash /dev/null
    real 0m0.005s
    user 0m0.000s
    sys 0m0.000s

    View Slide

  10. What does startup time tell us?
    Opterons are fast?
    Perl and bash block at the same rate?
    Not much by themselves.
    Differences can be telling.
    Stop until you explain any differences.

    View Slide

  11. Control overhead
    tmpfs on linux minimizes I/O overhead.
    Unloaded system minimizes contention.
    High-priority VM minimizes stolen time.
    Taskset minimizes L1/L2 turnover.

    View Slide

  12. Basic performance
    “How long does X take?”, you ask.
    “Well, it depends.”
    “On what?”
    “On what it is.”

    View Slide

  13. Basic performance
    Time for hardware?
    Time for software?
    Time for I/O?
    Creating realistic tests requires knowing!
    All you may know is that “it runs too slowly”.

    View Slide

  14. Step one: Use a reasonable perl.
    Centos has 5.8...
    RHEL’s built with 5.00503 compat, -O0, -g.

    View Slide

  15. Step one: Use a reasonable perl.
    Centos has 5.8...
    RHEL’s built with 5.00503 compat, -O0, -g.
    Simple lesson: BUILD YOUR OWN!!!
    Perl, Python, R, Postgres, MySQL, whatever.

    View Slide

  16. Step two: use Benchmark;
    This has the basic tools you need.
    use Benchmark ':hireswallclock';
    Do what it takes to use hireswallclock.
    Recompile Perl, hack the kernel, whatever.

    View Slide

  17. Minimize confusion
    Test atomic units of code.
    Establish a baseline
    Even if you test end-to-end.

    View Slide

  18. Basic baseline
    Running on a VM?
    Your benchmark could be time-sliced!
    timethis 1_000_000, sub{};
    Should be near-zero time at 100% CPU.

    View Slide

  19. Only a million?
    Well, maybe more...
    System load can effect reasonable counts.
    Run enough to get a valid time.
    DB<2> timethis 1_000_000, sub{};
    timethis 1000000: -0.0285478 wallclock secs
    (-0.03 usr + 0.00 sys = -0.03 CPU) @ -33333333.33/s
    (n=1000000)
    (warning: too few iterations for a reliable count)

    View Slide

  20. Basline kernel calls.
    Run a million each:
    sub {open my $fh,‘<’,‘/dev/null’};
    sub
    {
    open my $fh ‘>’ ‘/var/tmp/$$’;
    unlink “/var/tmp/$$”;
    };

    View Slide

  21. Basline kernel calls.
    Watch for “IO Wait” time during the test.
    This can block the entire system.
    Make sure IO Wait is yours.
    Or run the test when there isn’t any.

    View Slide

  22. Top is your friend
    So is procinfo-ng with “-D”:
    delta counts, current memory
    Notice if your prcess gets 100% CPU.
    Notice if the process jumps between cores.
    Notice if your task forks, threads.
    Look for non-zero I/O wait times.

    View Slide

  23. Red flags
    High I/O wait.
    Runnable jobs > number of cores.
    High stolen time.
    Lots of paging/swaping.
    Large changes in swap used.

    View Slide

  24. Fixing red-flags
    Run on specific cores:
    taskset -c X your_test_code;
    taskset -c N-M your_test_code;
    Use multi-core on same CPU for threads/forks.

    View Slide

  25. Memory hog
    Force non-running jobs out of core.
    Malloc a huge data area and exit:
    my @a = ( ‘Foo’ ) x 2 ** 32;
    exit 0;
    Then run your test quickly:

    View Slide

  26. Counting a baseline baseline
    Benchmark has its own baseline.
    Suggest using your own.
    Examine top or procinfo to estimate “stolen” time.

    View Slide

  27. Bad situation for a benchmark:
    18+ jobs on 4 cores 
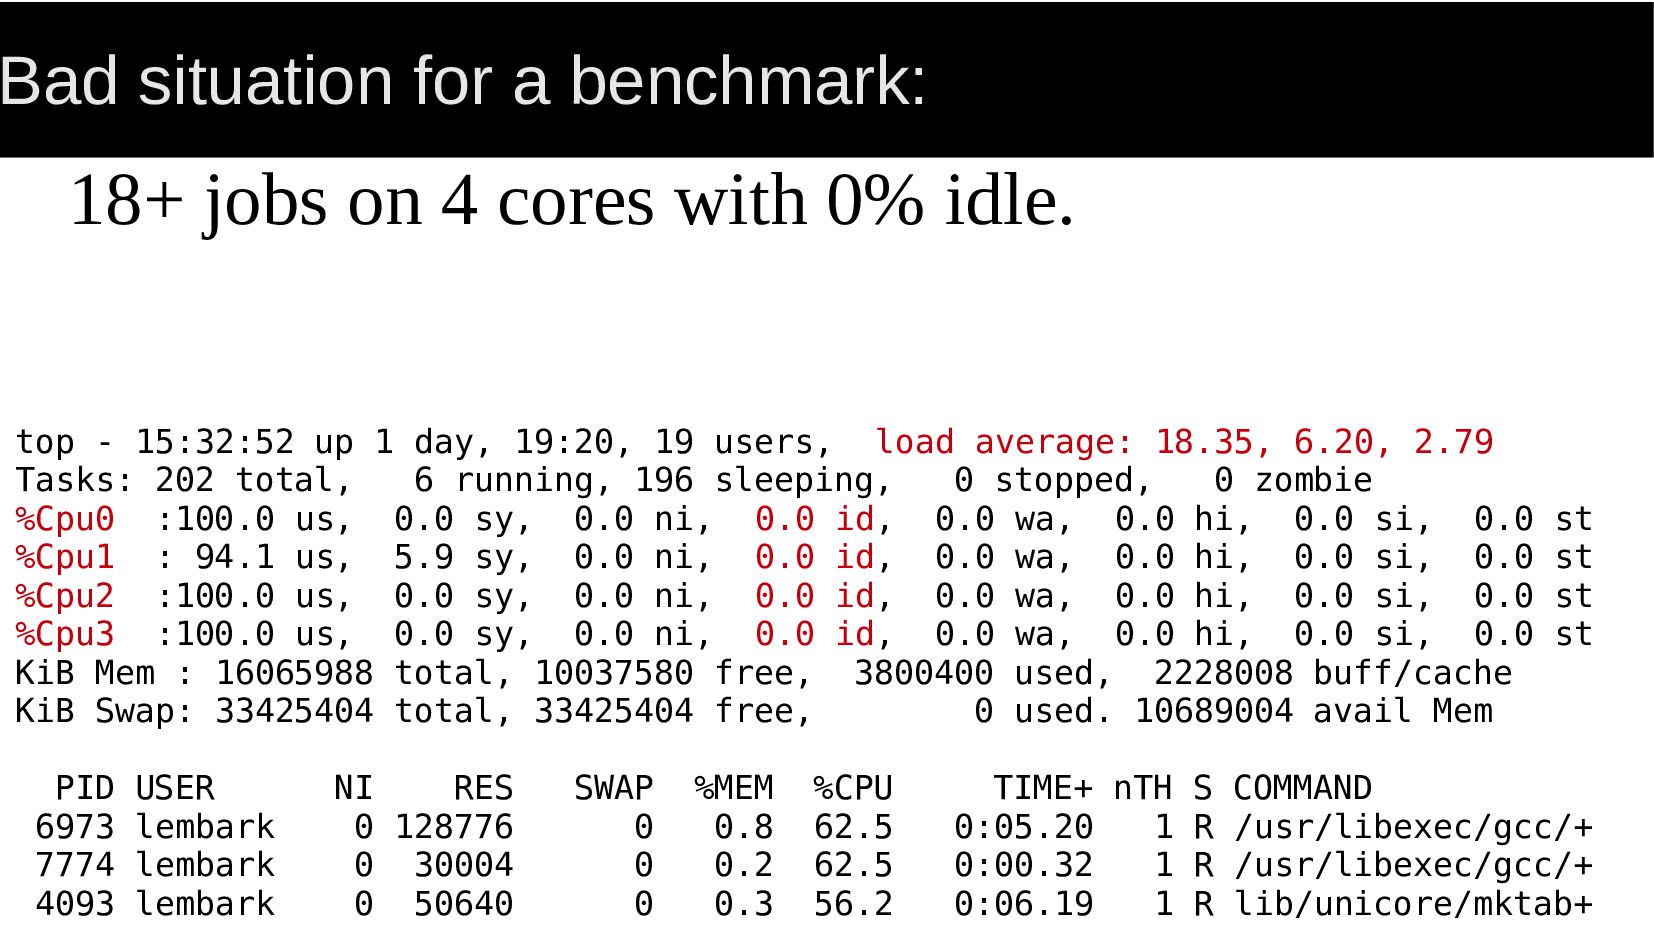
with 0% idle.
    top - 15:32:52 up 1 day, 19:20, 19 users, load average: 18.35, 6.20, 2.79
    Tasks: 202 total, 6 running, 196 sleeping, 0 stopped, 0 zombie
    %Cpu0 :100.0 us, 0.0 sy, 0.0 ni, 0.0 id, 0.0 wa, 0.0 hi, 0.0 si, 0.0 st
    %Cpu1 : 94.1 us, 5.9 sy, 0.0 ni, 0.0 id, 0.0 wa, 0.0 hi, 0.0 si, 0.0 st
    %Cpu2 :100.0 us, 0.0 sy, 0.0 ni, 0.0 id, 0.0 wa, 0.0 hi, 0.0 si, 0.0 st
    %Cpu3 :100.0 us, 0.0 sy, 0.0 ni, 0.0 id, 0.0 wa, 0.0 hi, 0.0 si, 0.0 st
    KiB Mem : 16065988 total, 10037580 free, 3800400 used, 2228008 buff/cache
    KiB Swap: 33425404 total, 33425404 free, 0 used. 10689004 avail Mem
    PID USER NI RES SWAP %MEM %CPU TIME+ nTH S COMMAND
    6973 lembark 0 128776 0 0.8 62.5 0:05.20 1 R /usr/libexec/gcc/+
    7774 lembark 0 30004 0 0.2 62.5 0:00.32 1 R /usr/libexec/gcc/+
    4093 lembark 0 50640 0 0.3 56.2 0:06.19 1 R lib/unicore/mktab+

    View Slide

  28. procinfo viewing an overloaded system
    $ make -wk -j all test install; # building perl
    Memory: Total Used Free Buffers
    RAM: 16065988 6257268 9808720 0
    Swap: 33425404 0 33425404
    Bootup: Fri Jun 22 20:11:57 2018 Load average: 22.83 6.59 3.47 23/470
    22355
    user : 00:00:19.22 95.9% page in : 0
    nice : 00:00:00.00 0.0% page out: 67
    system: 00:00:00.80 4.0% page act: 598
    IOwait: 00:00:00.00 0.0% page dea: 0
    hw irq: 00:00:00.00 0.0% page flt: 307906
    sw irq: 00:00:00.00 0.0% swap in : 0
    idle : 00:00:00.00 0.0% swap out: 0
    uptime: 1d 19:33:38.00 context : 15811

    View Slide

  29. Prove reports times.
    find t -type -f -name ‘*t’ | xargs -l1 prove;
    ...
    t/re/overload.t .. ok
    All tests successful.
    Files=1, Tests=87,
    0 wallclock secs ( 0.02 usr + 0.00 sys = 0.02 CPU)
    Result: PASS
    ...
    Test isolate parts of code being tested.

    View Slide

  30. Inserting timings
    my $t0 = Benchmark->new;
    do{ somethig … };
    my $t1 = Benchmark->new;
    say timestr timediff $t1, $t0;
    Notice the order: t1 – t0.

    View Slide

  31. Object::Exercise
    The “benchmark” directive
    Gives time for each stage of test.
    Nice for timing progressive operations.

    View Slide

  32. End to end tests
    Add Benchmark to your #! code.
    time(1)
    Catch: No accounting for human time.
    Need runtime for things like web service.

    View Slide

  33. Timing back-end
    Exclude latency or measure it explicitly:
    get_request;
    push @timz, Benchmark->new;

    push @timz, Benchmark->new;
    send_reply;
    Compute timediff on way out.

    View Slide

  34. New York Time Profiler
    By Tim Bunce.
    New York Second better than :hireswallclock.
    His talk on profiling is an excellent introduction.

    View Slide

  35. Summary:
    Benchmarks don’t have to be damn lies.
    Control the environment.
    Establish baselines for units of work.
    Use Benchmark with “:hireswallclock”.
    Watch the system to verify isolation.
    taskset(1) and tmpfs (see mount(1)) can help.

    View Slide