Upgrade to Pro — share decks privately, control downloads, hide ads and more …

Raku Memory Manglement: Checking yourself out.

Raku Memory Manglement: Checking yourself out.

You cannot manage what you cannot measure. Which is fine, until you can't measure something...

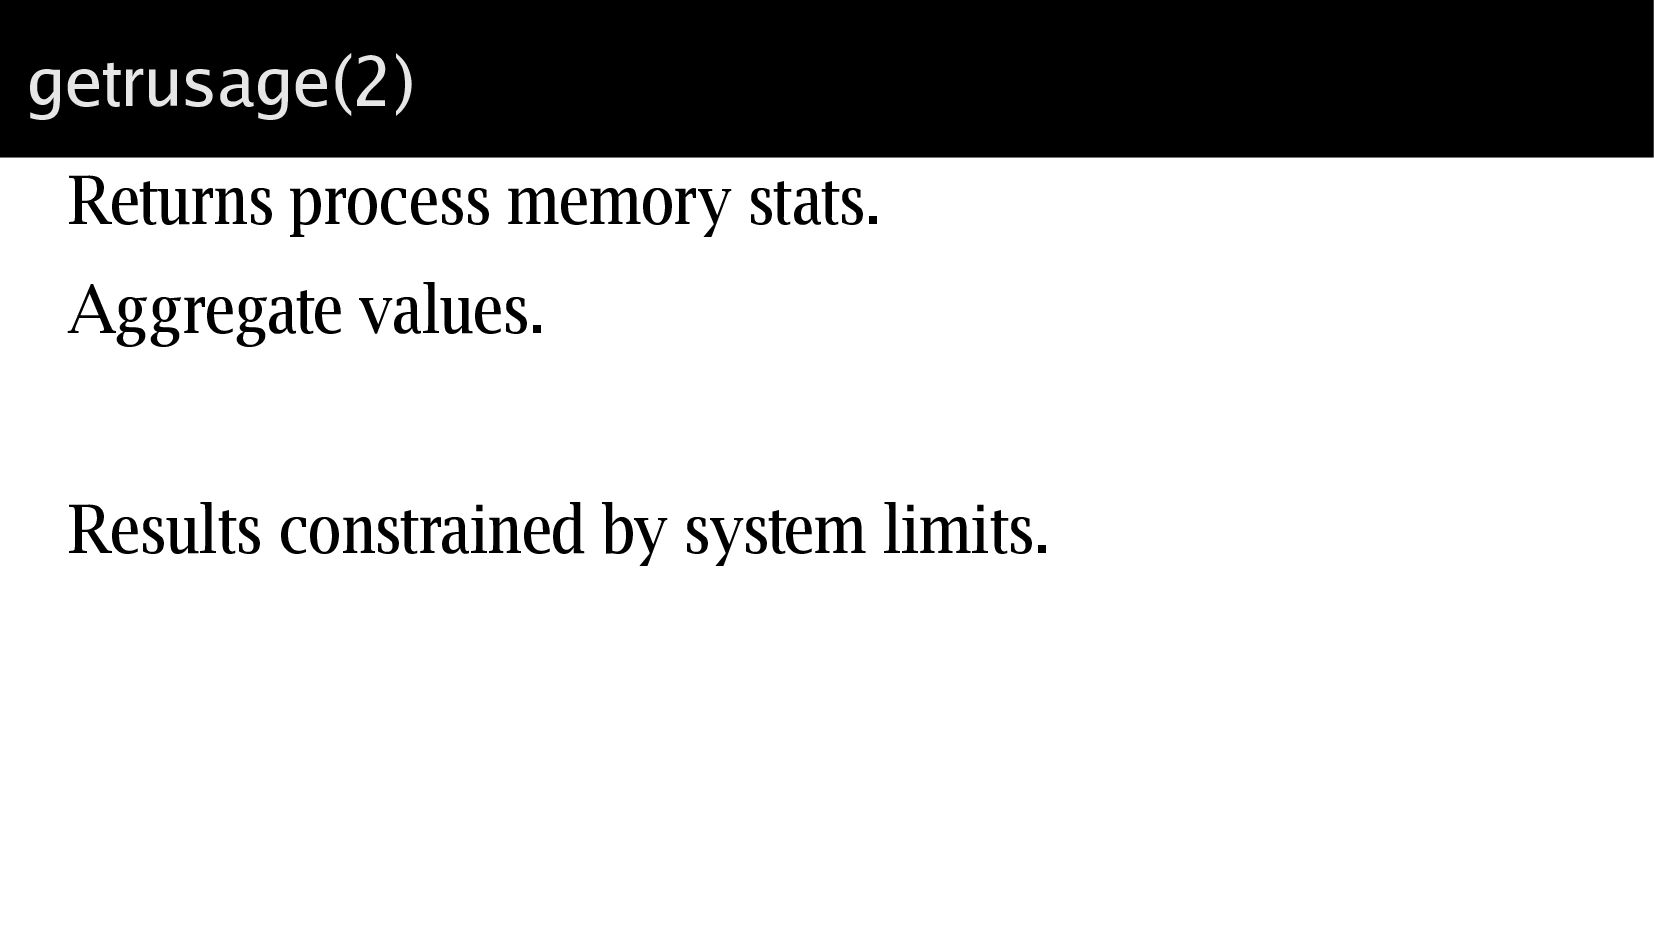
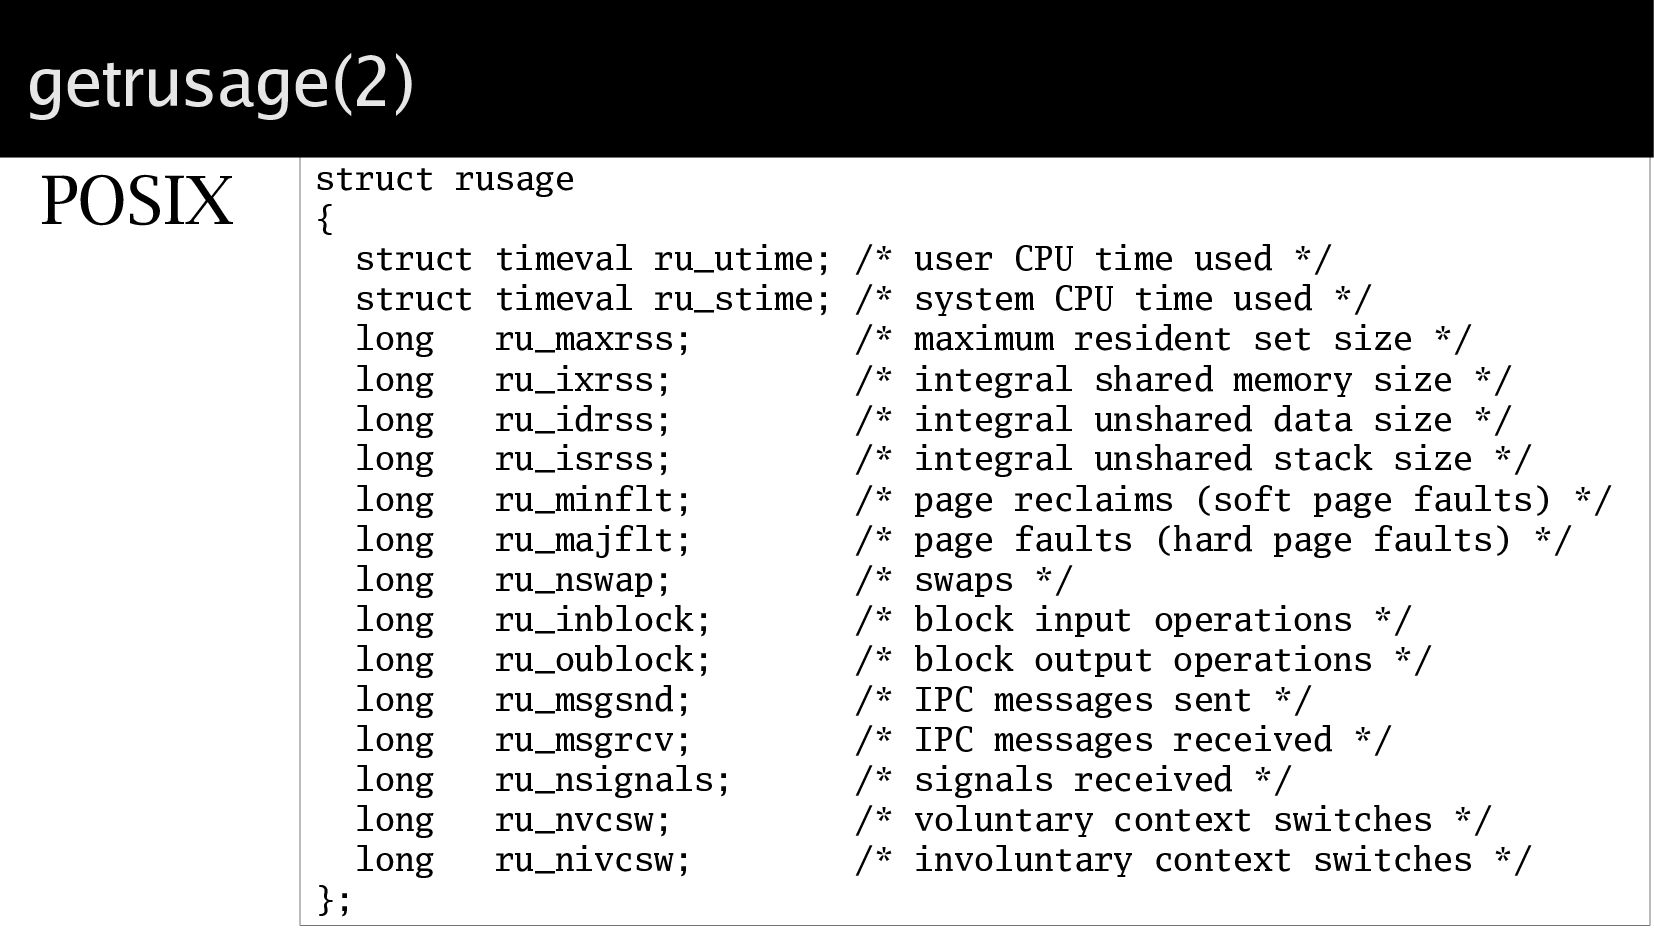
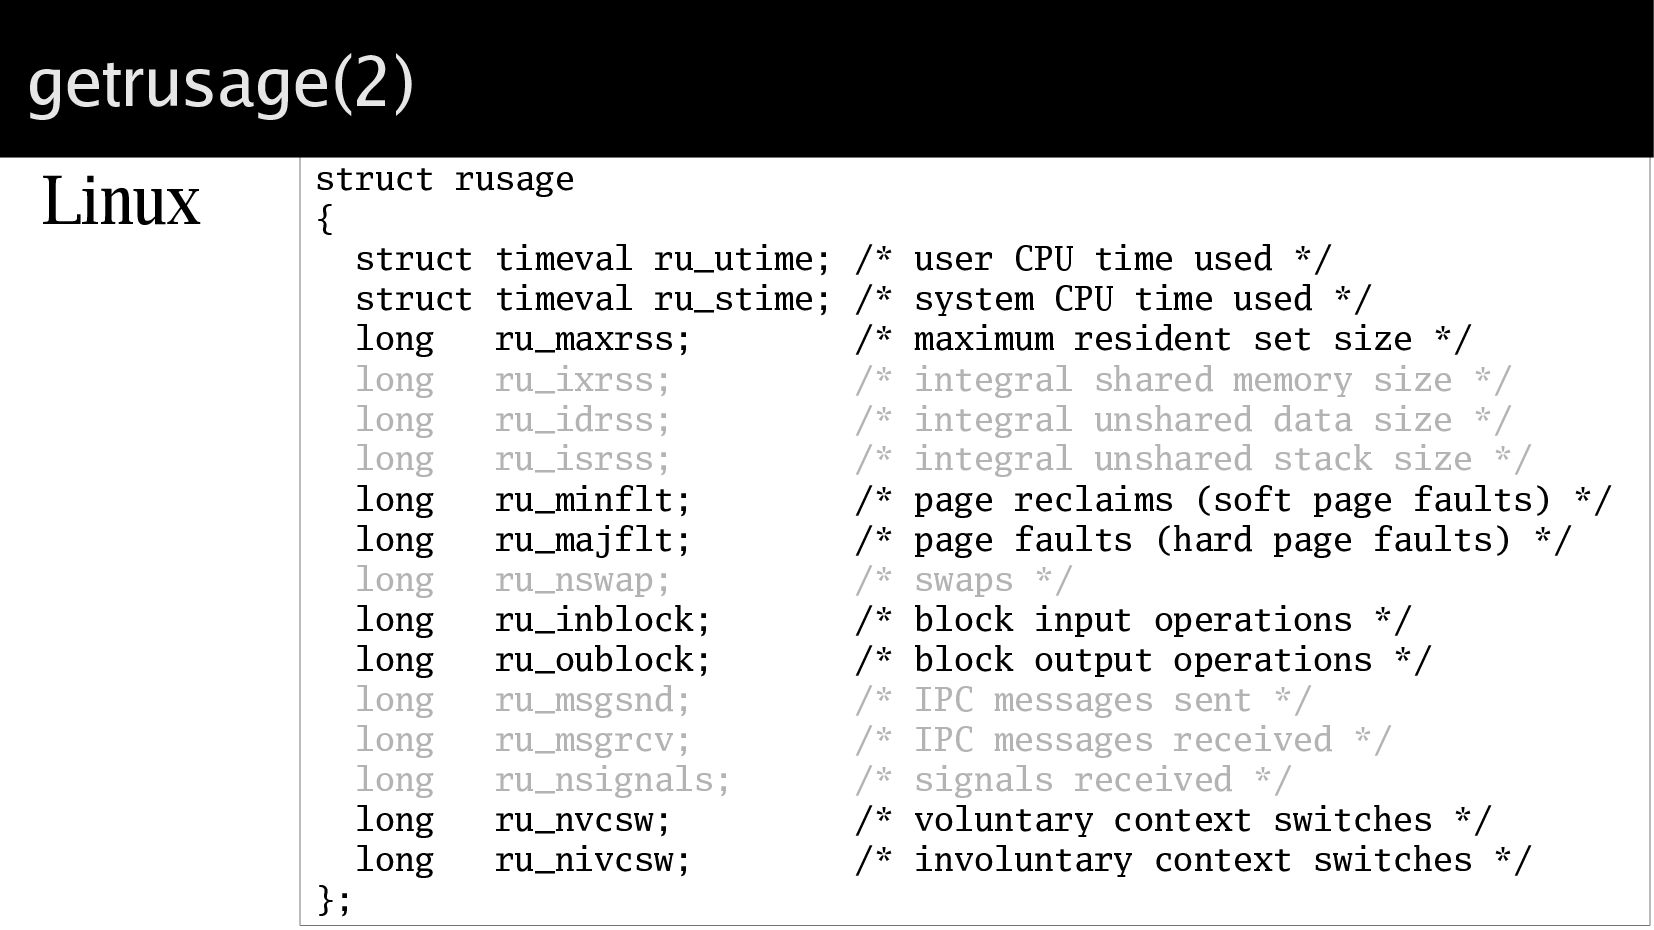
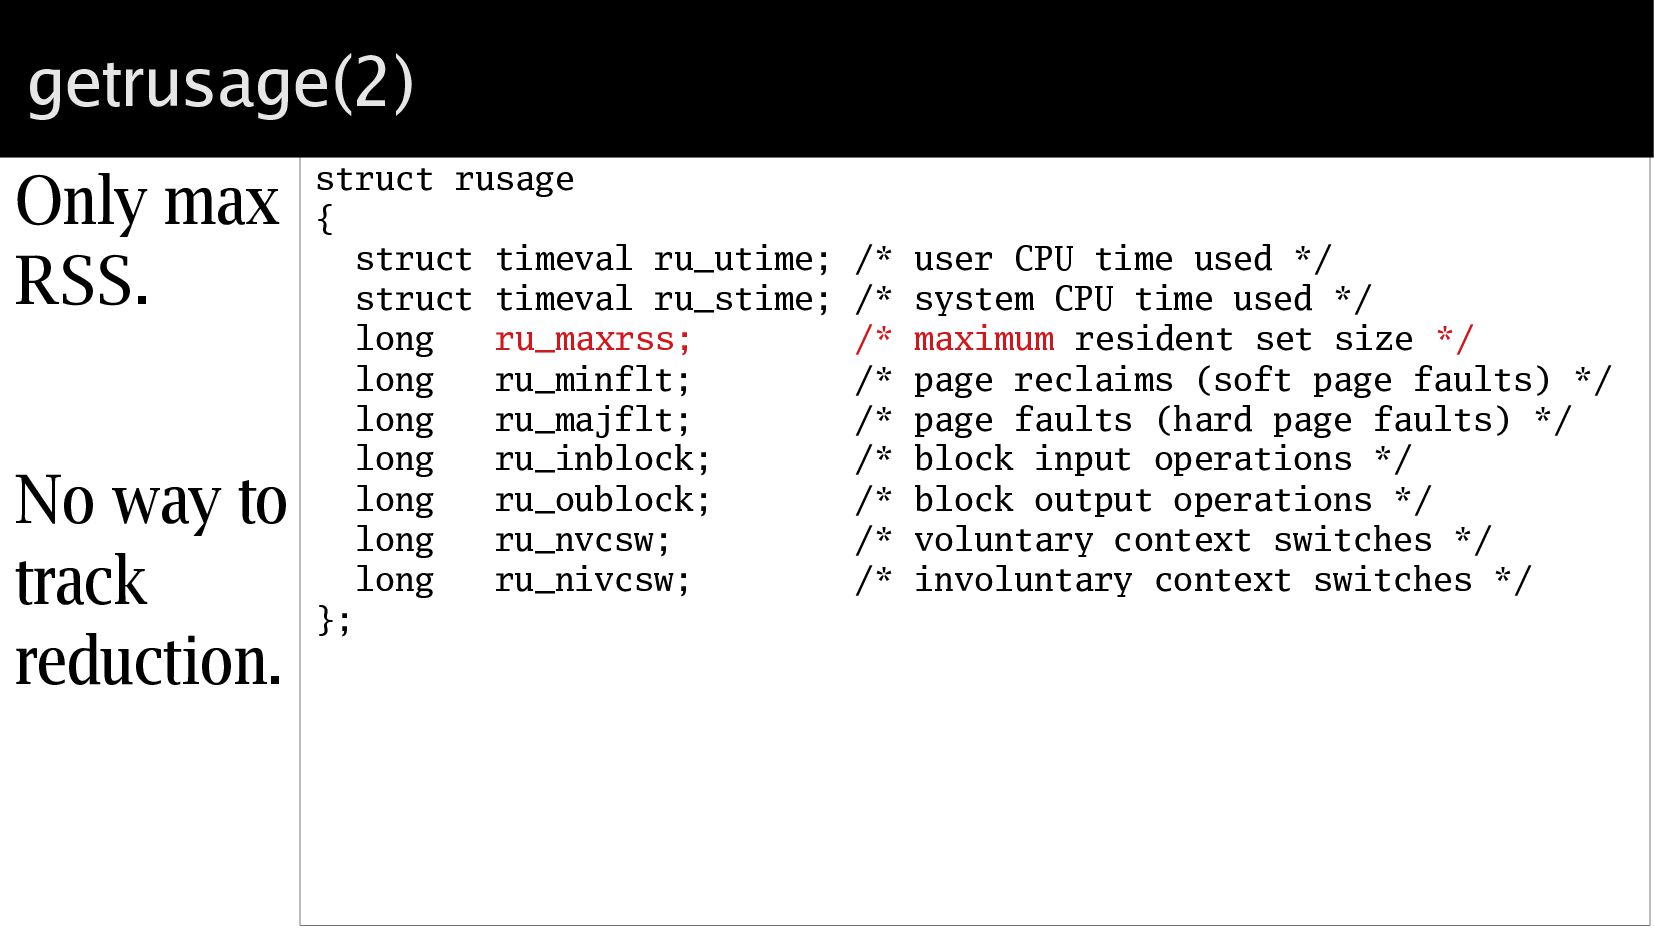
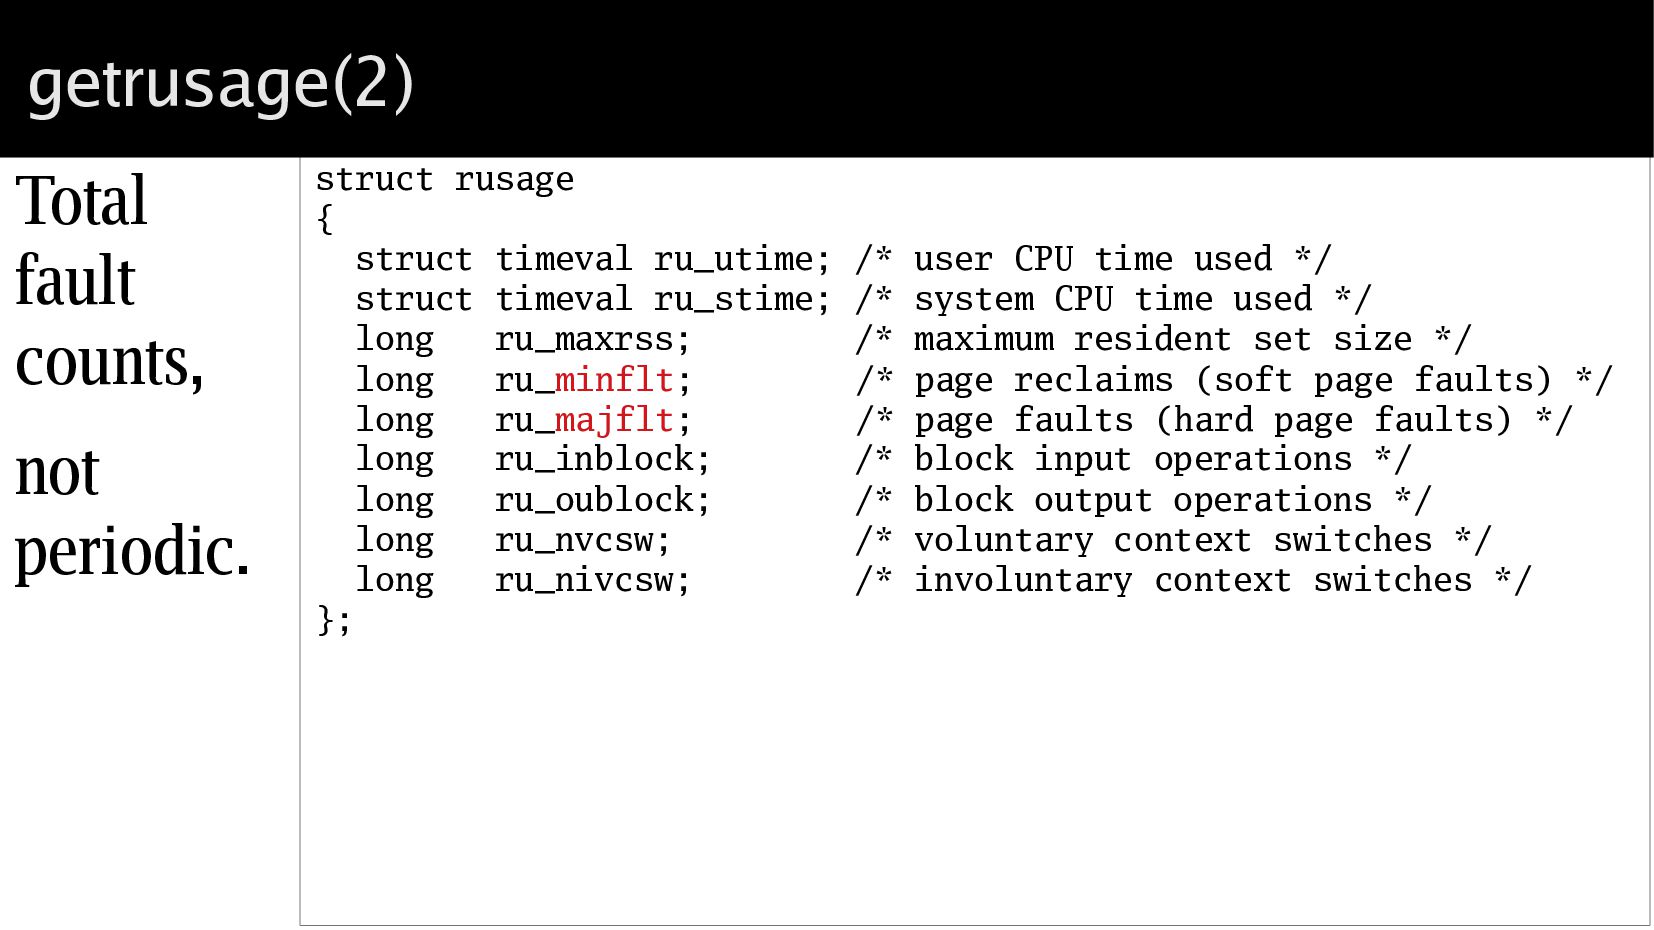
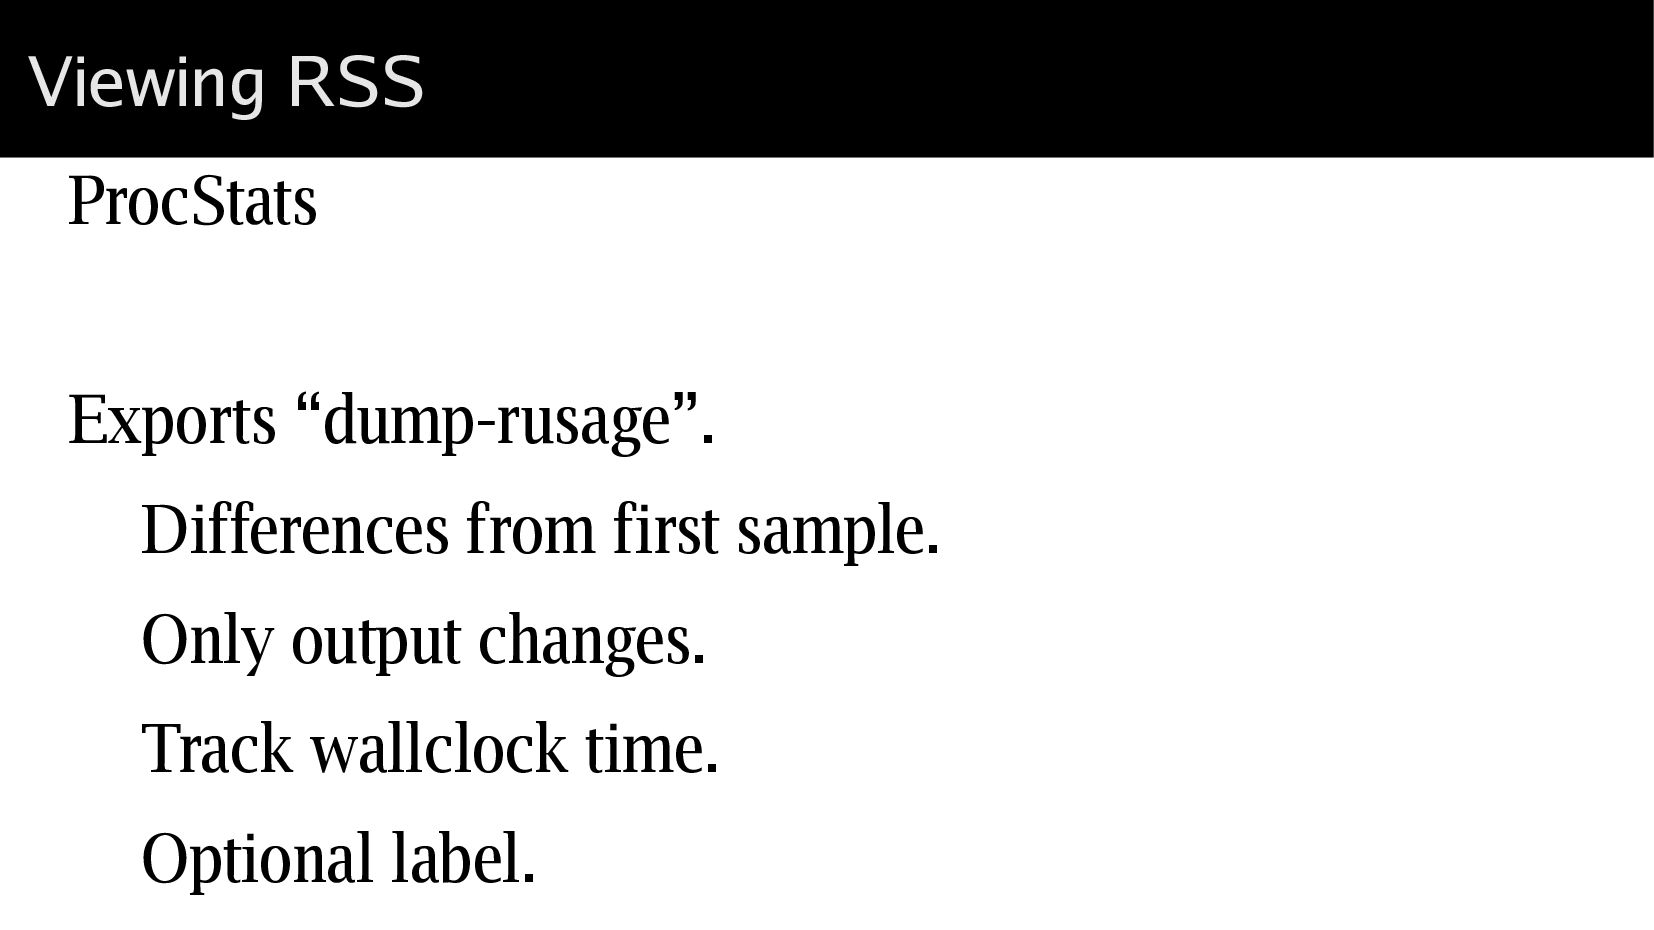
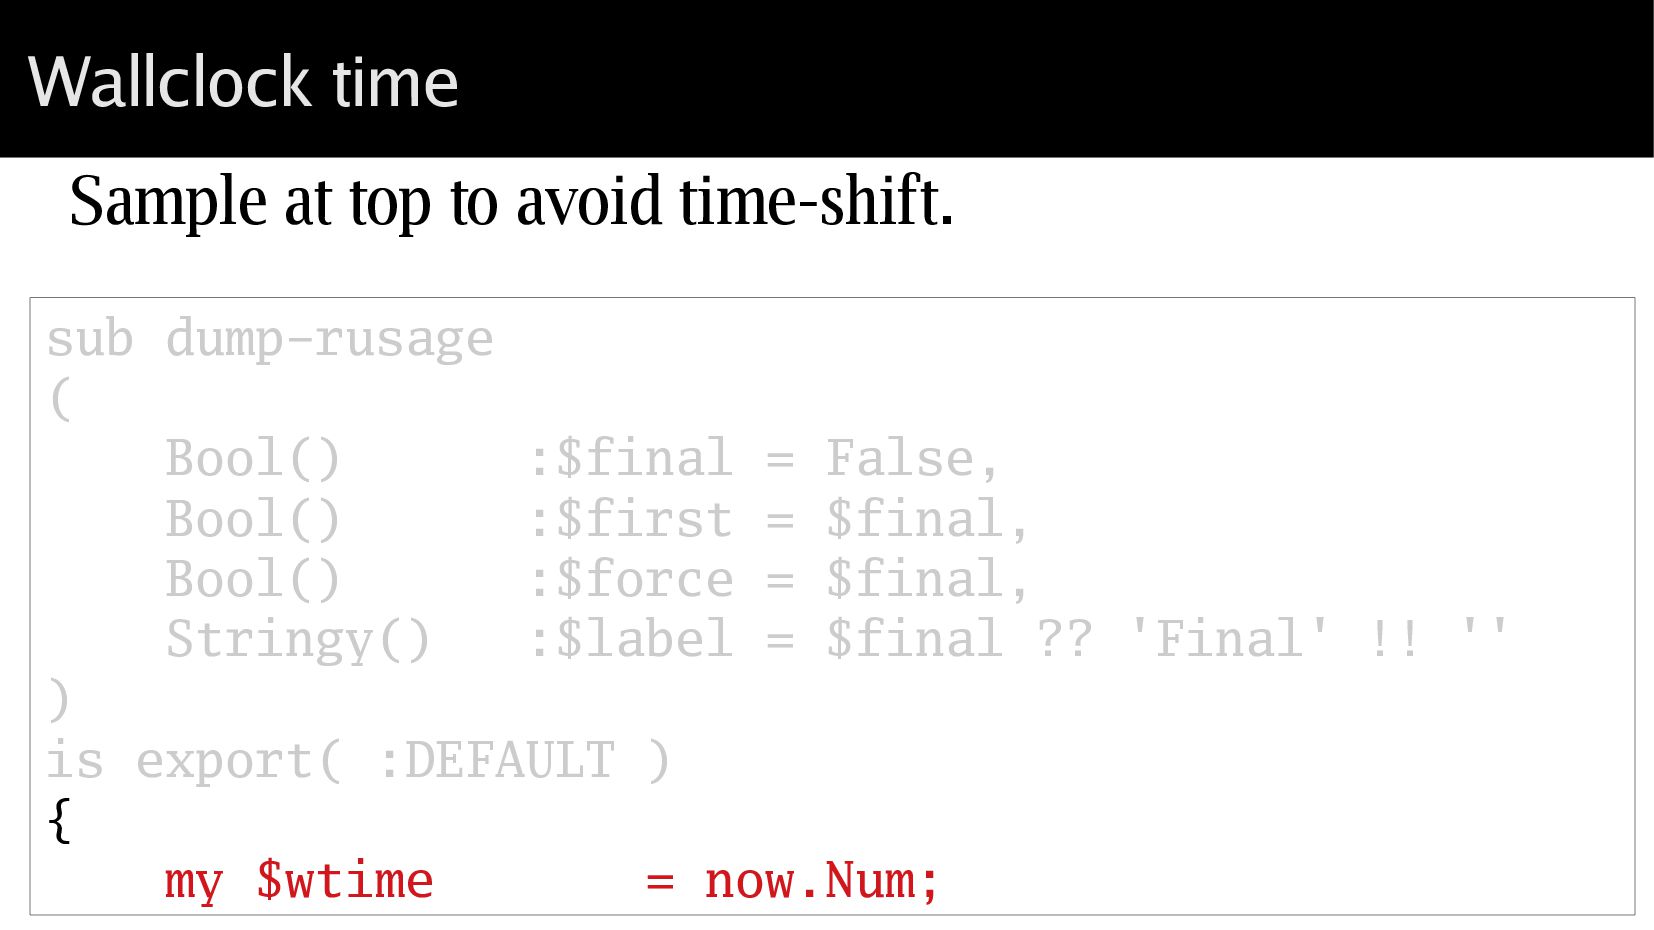
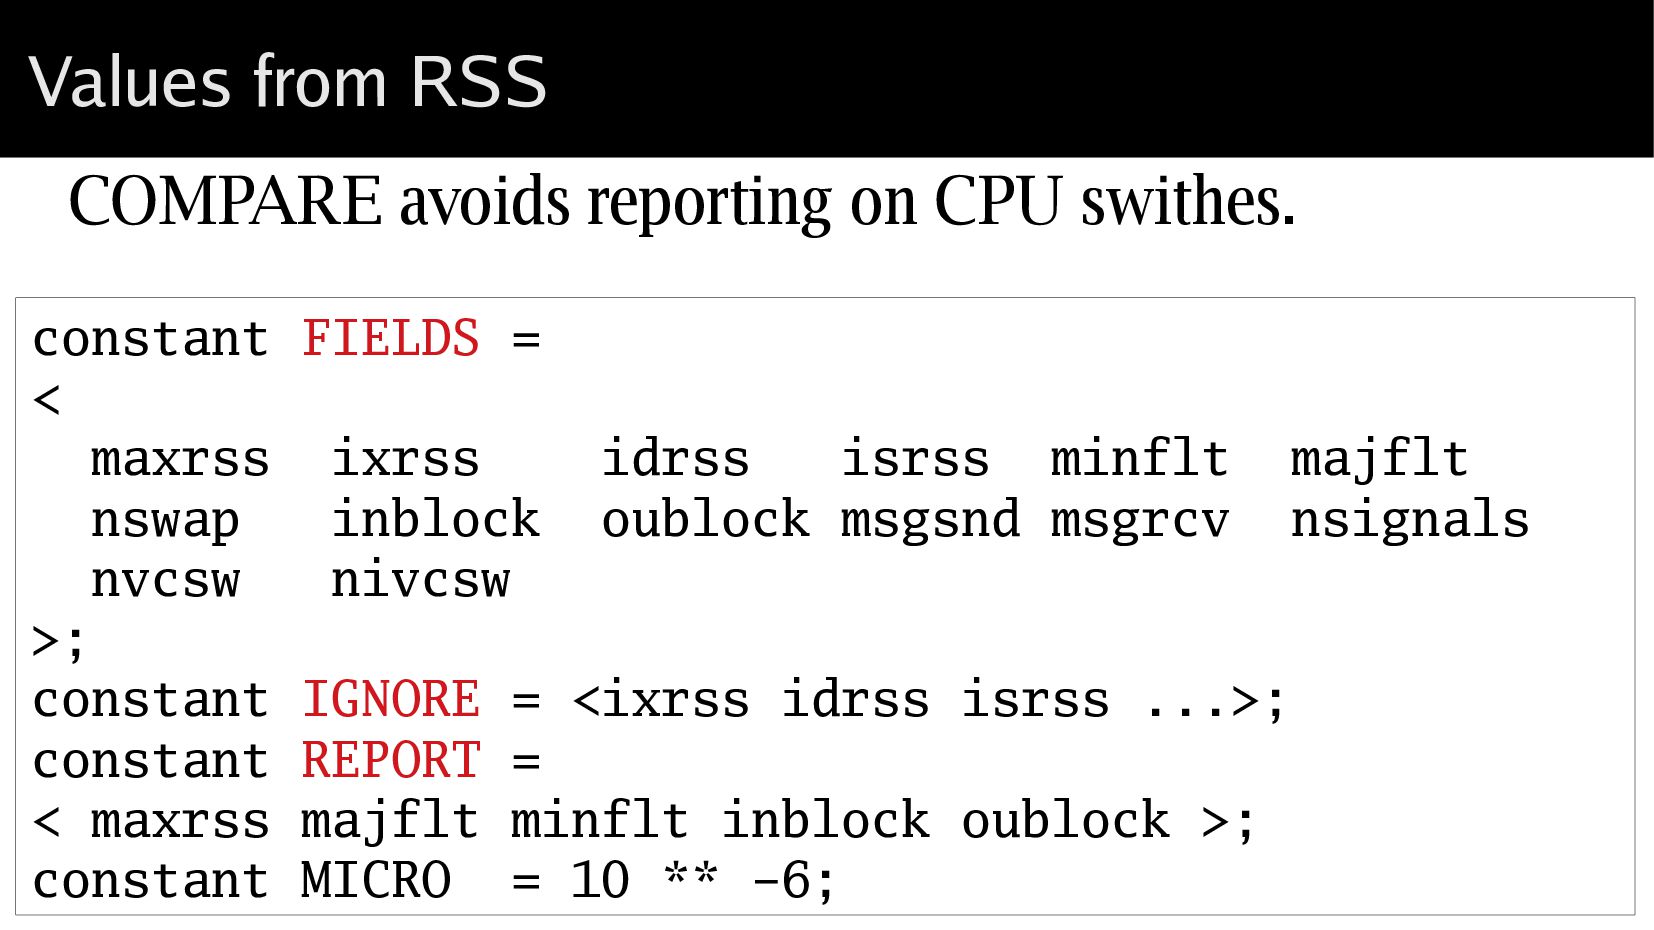
The ProcStats module fills the gap for Raku on *NIX by polling rusage(2) to report initial, incremental, and final usage values.

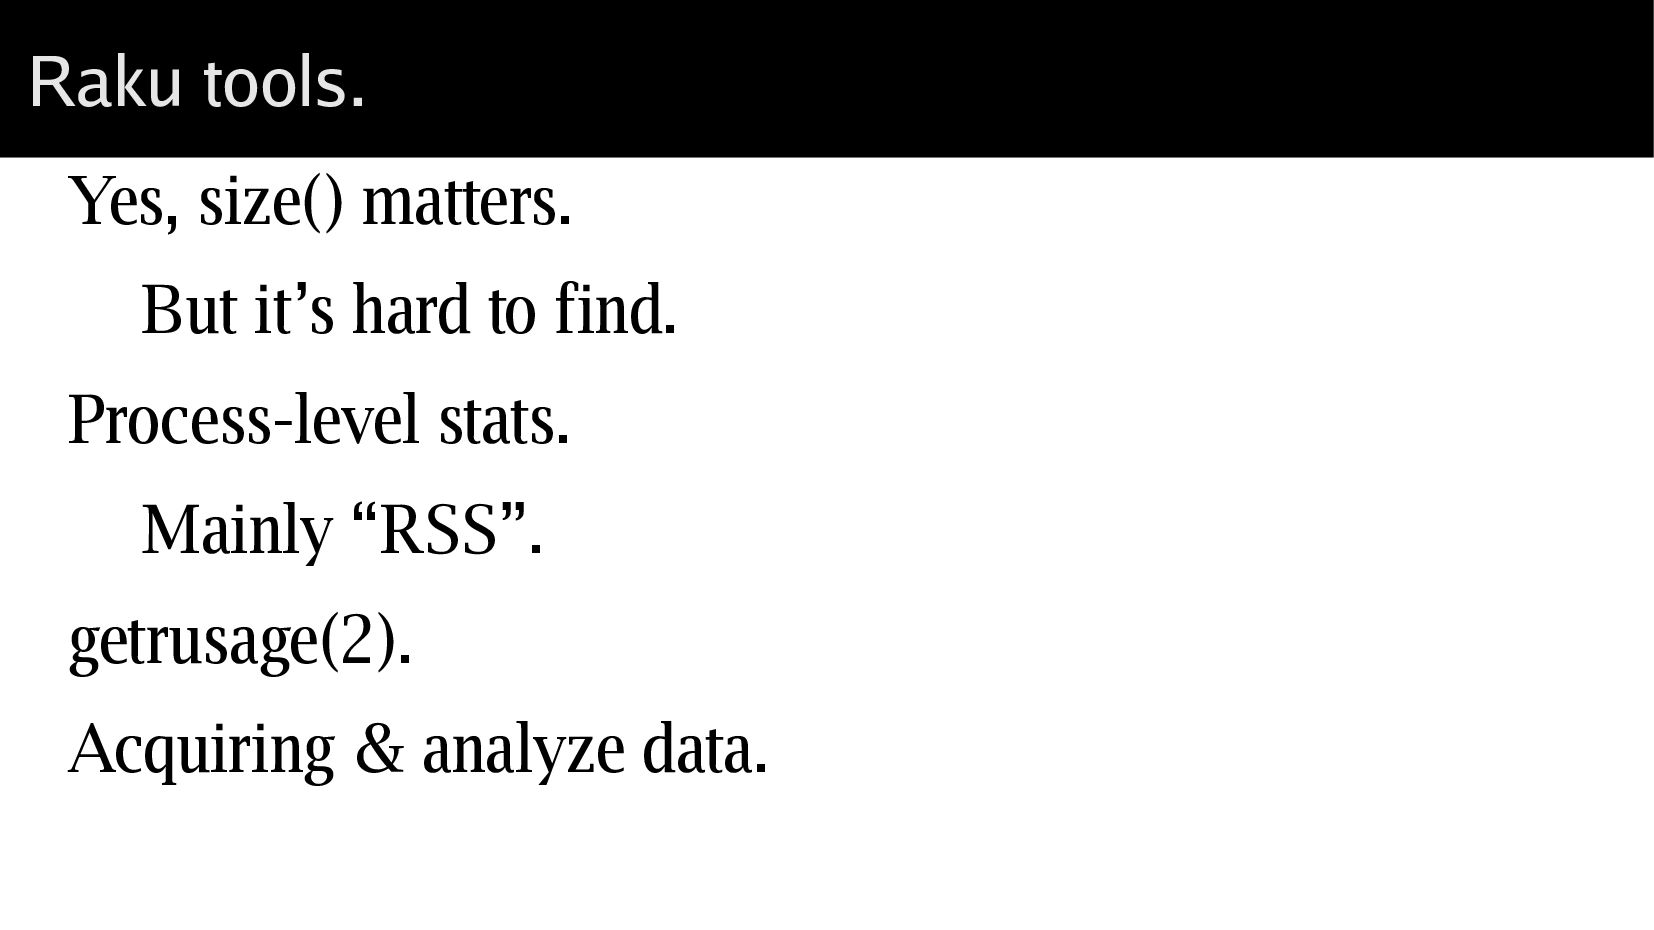
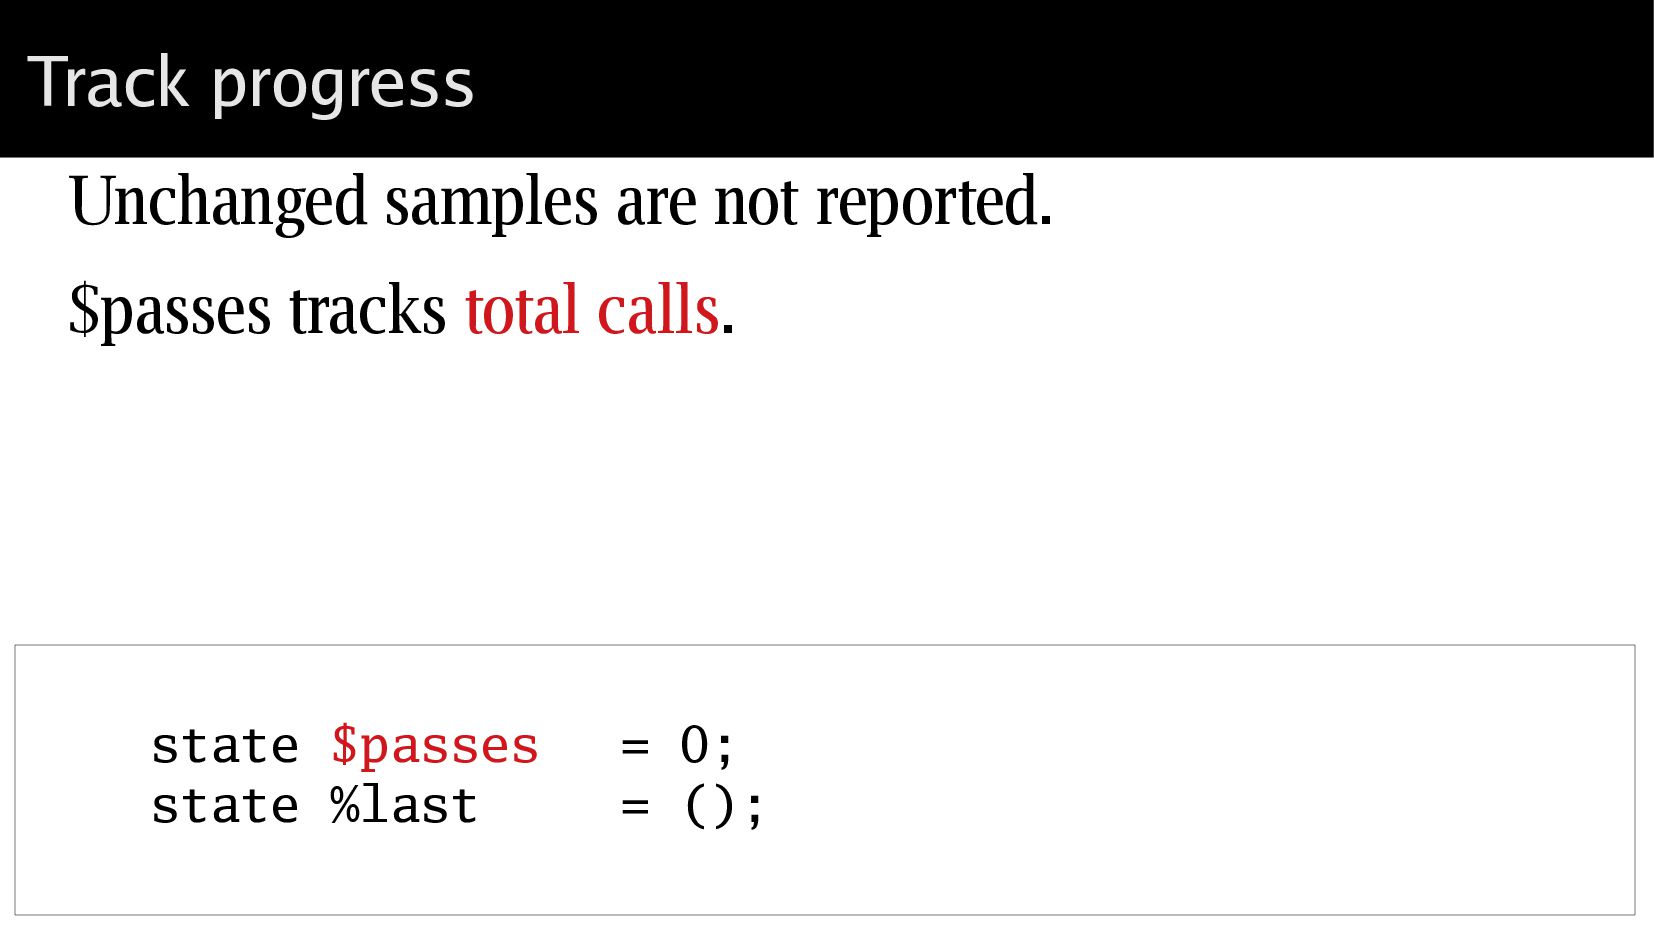
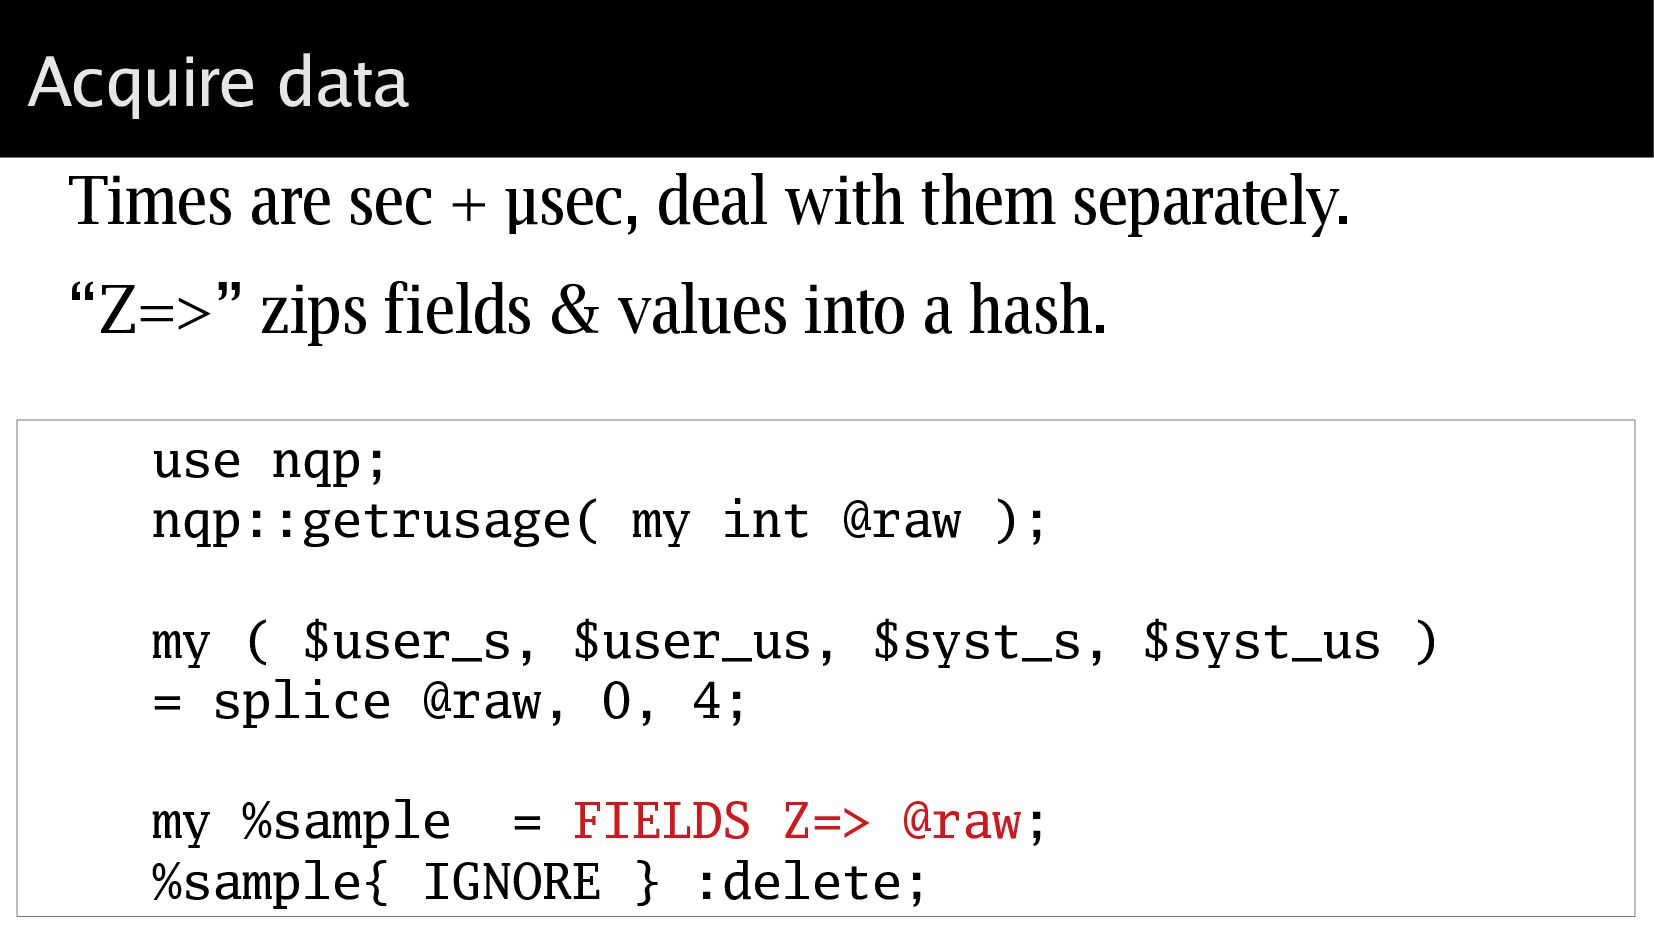
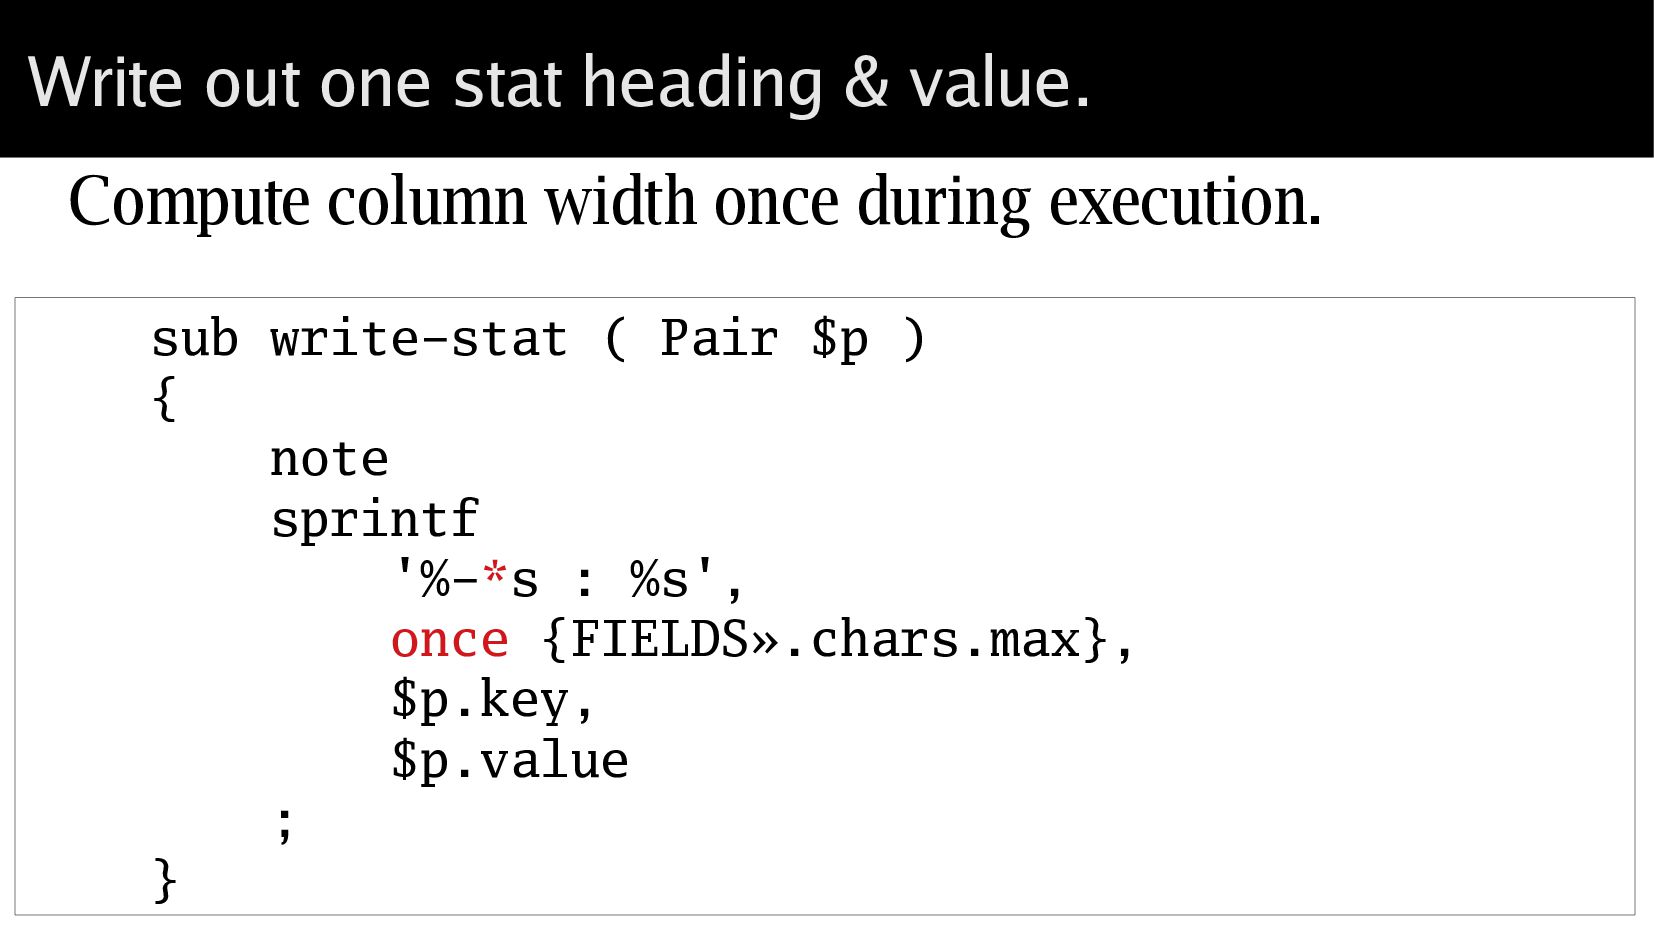
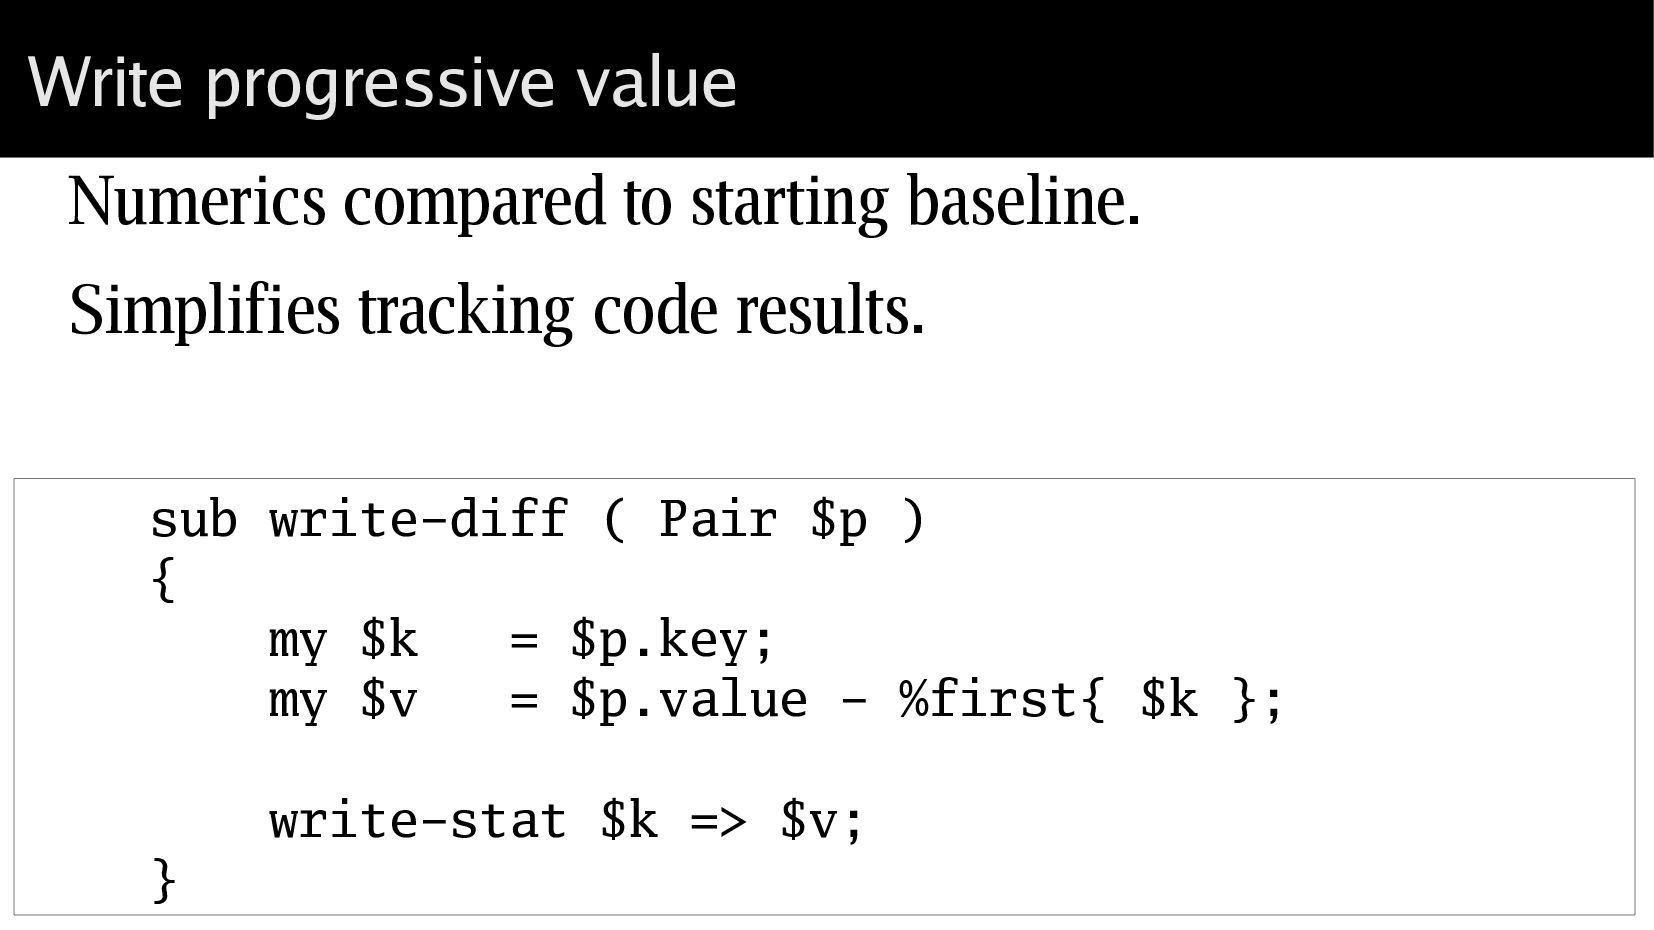
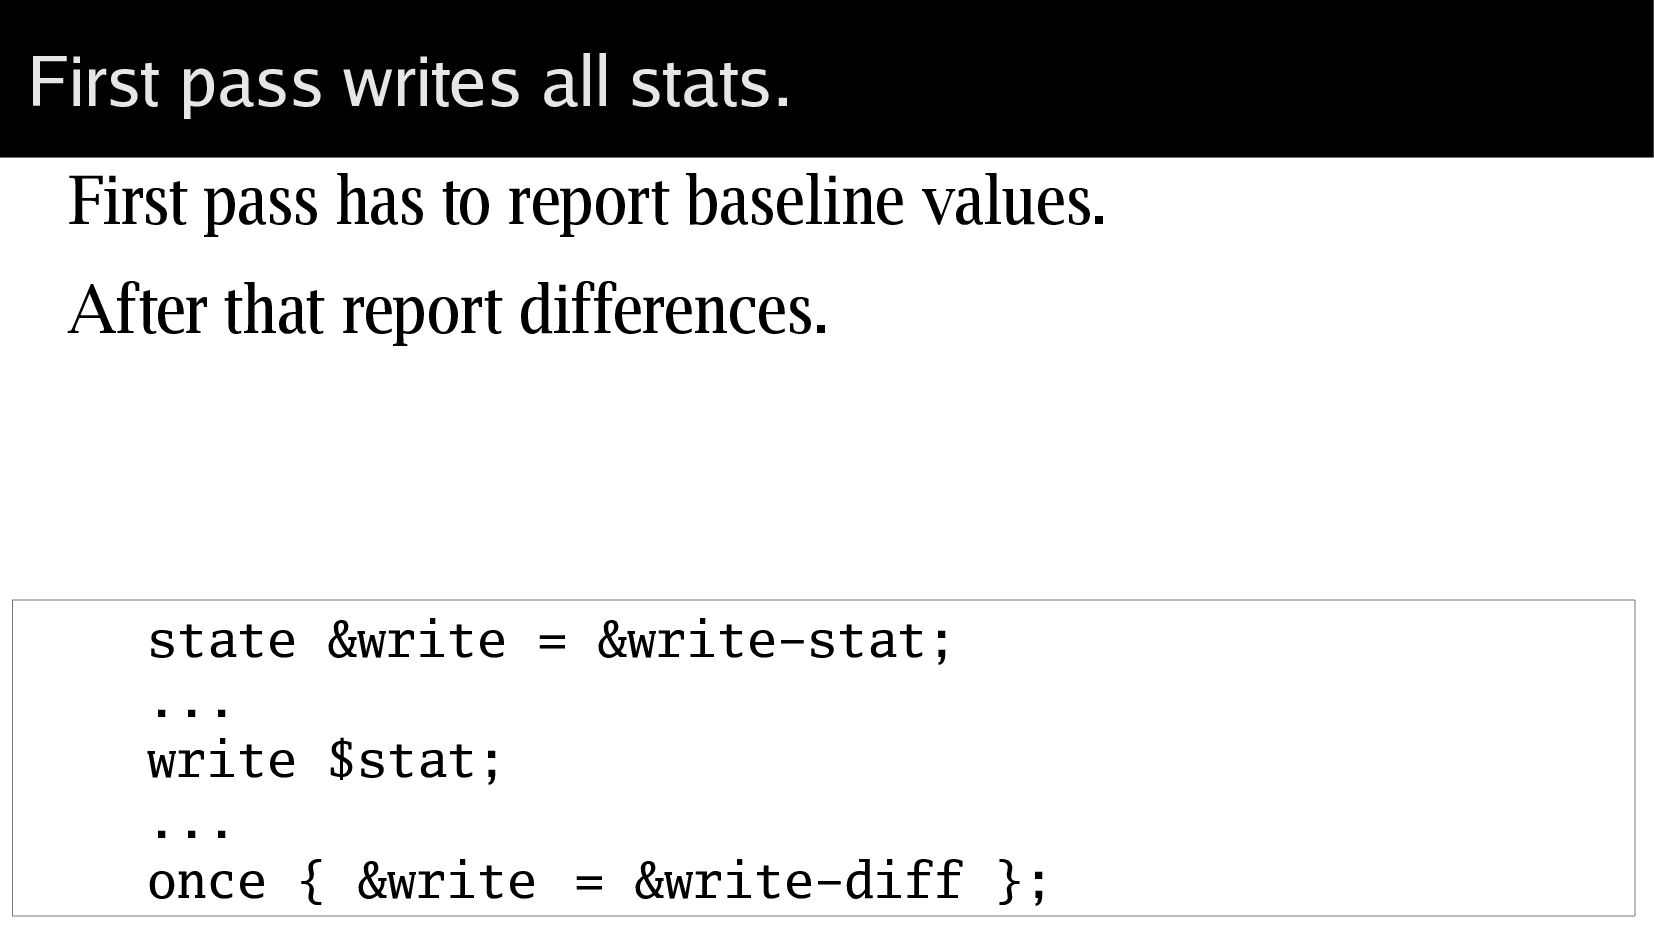
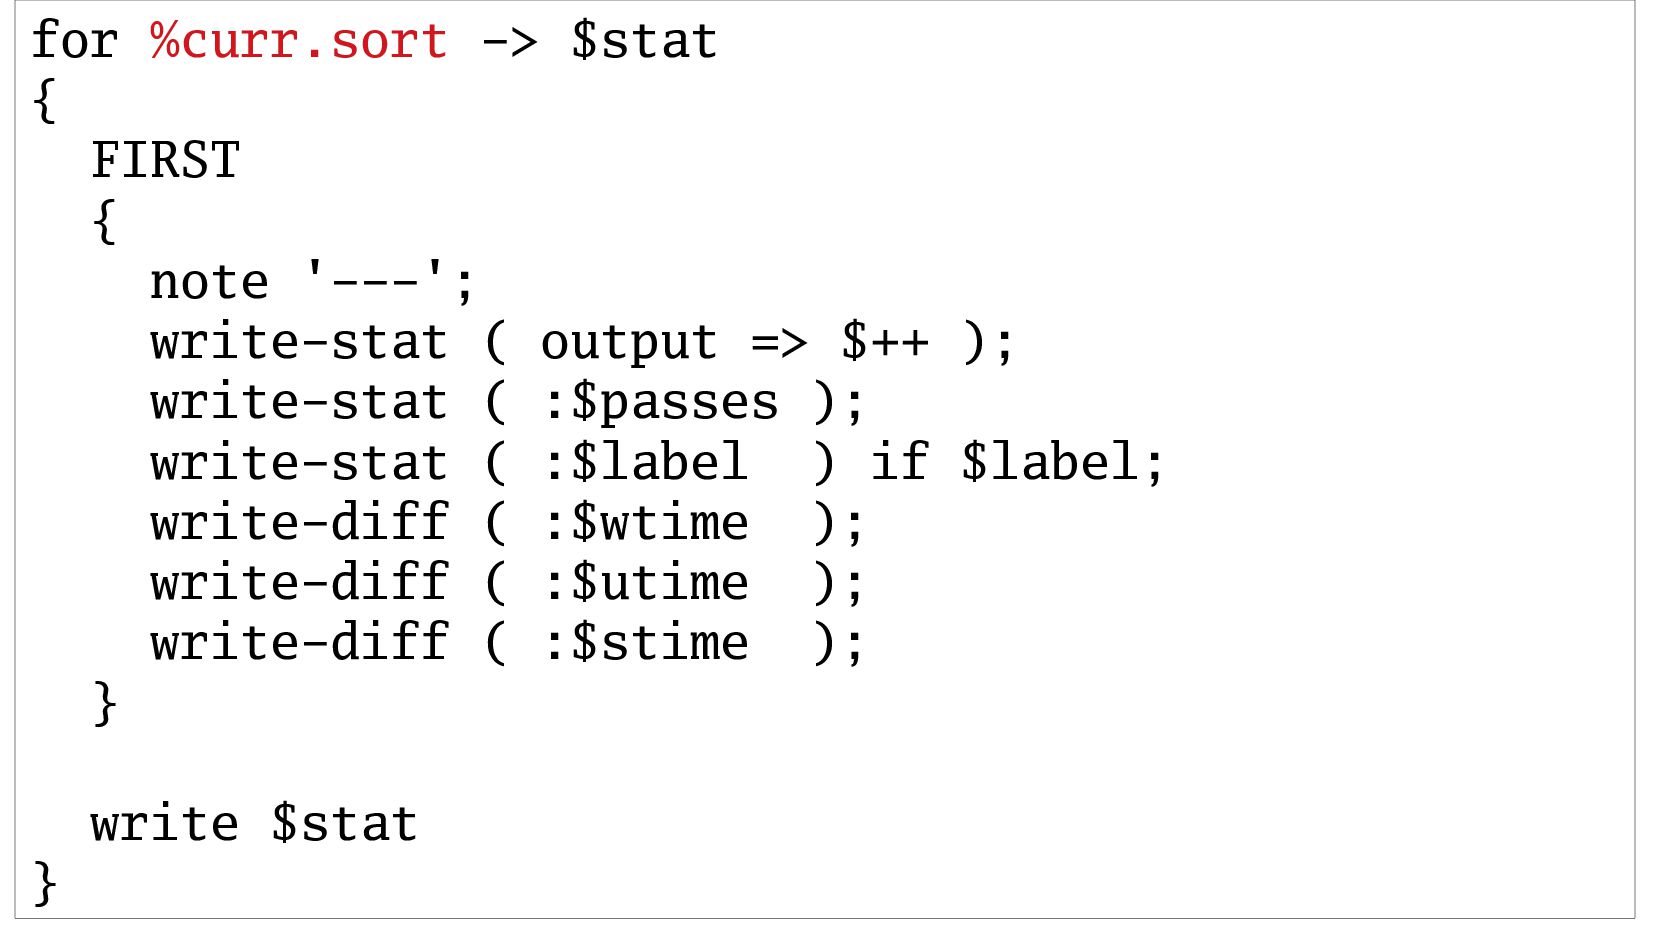
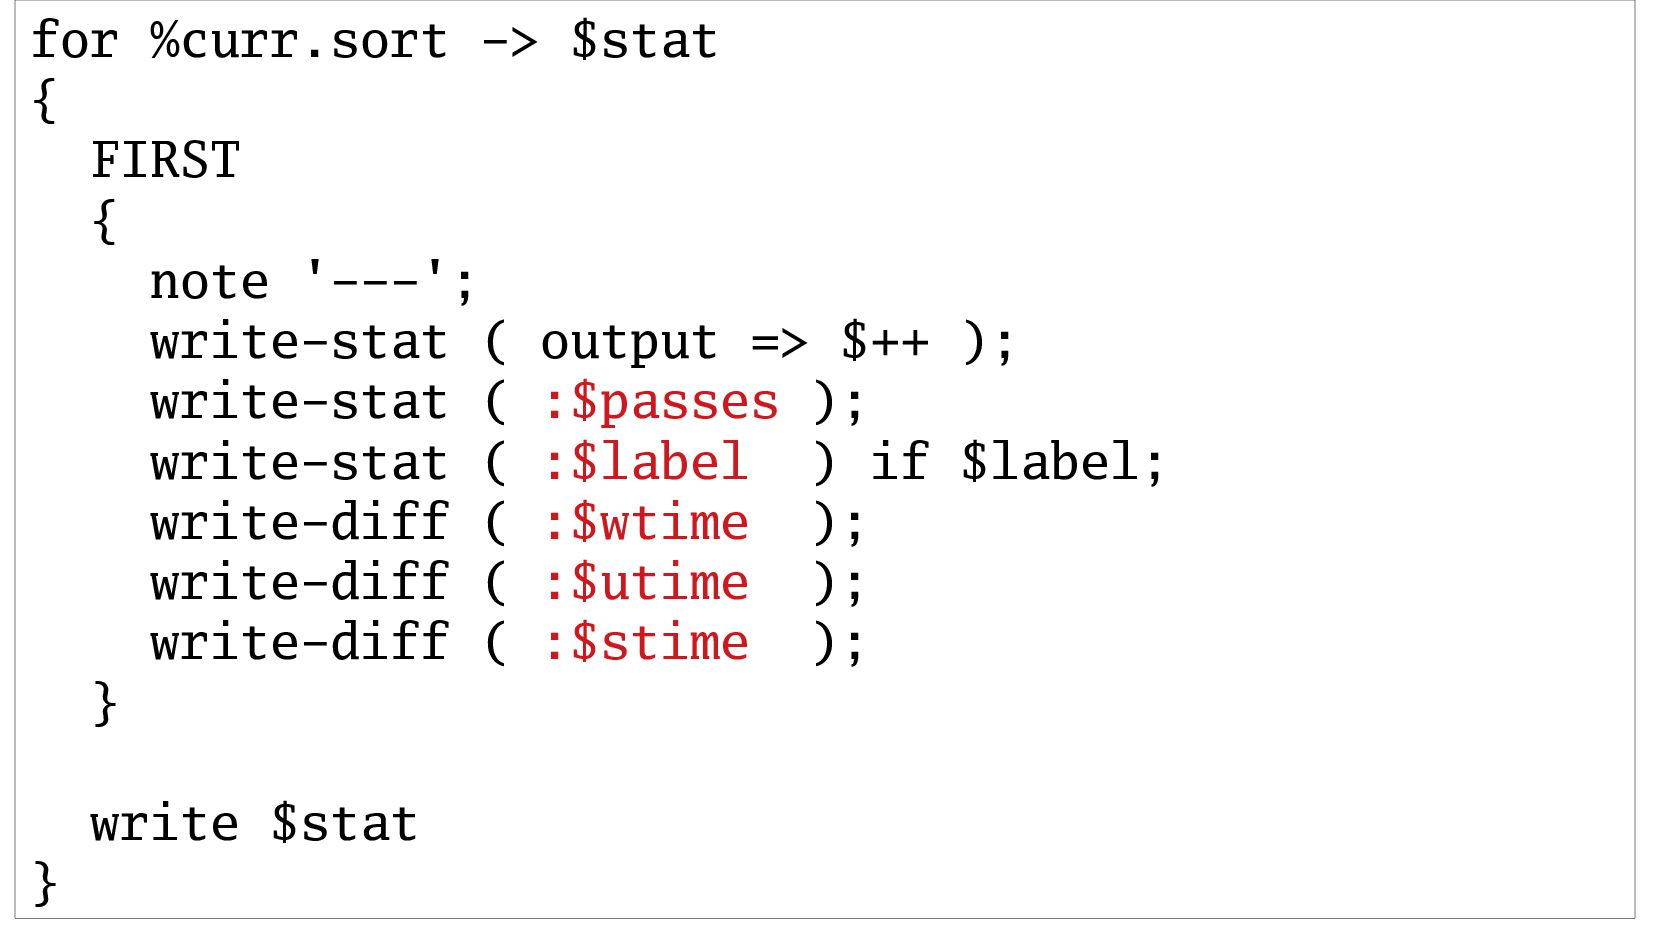
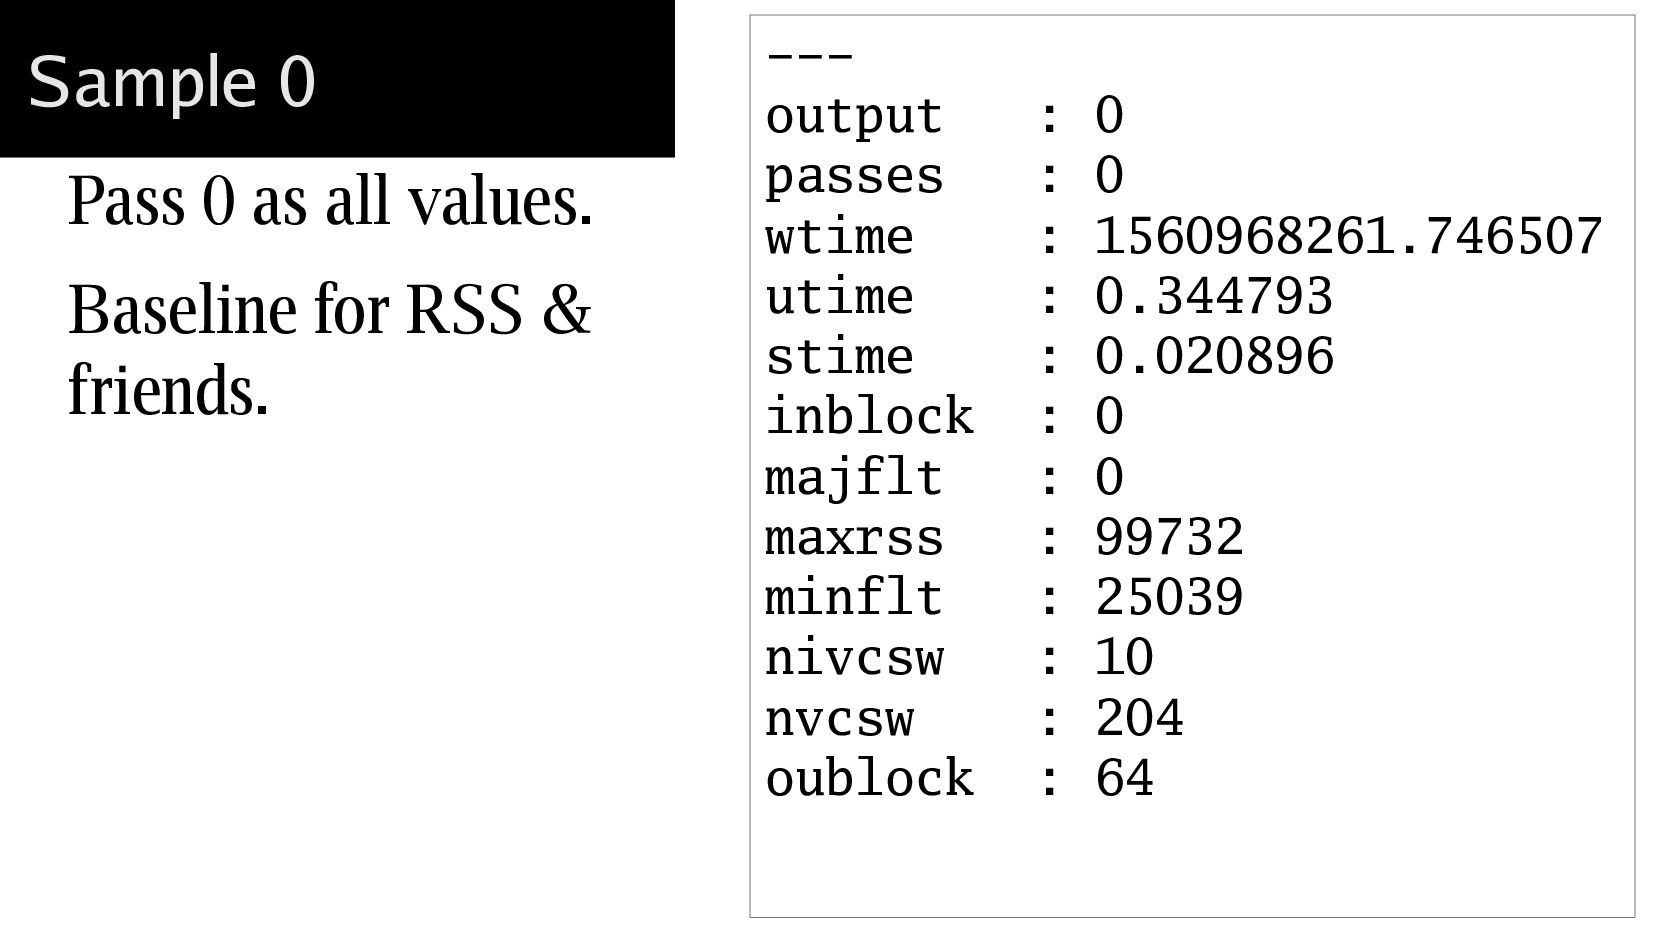
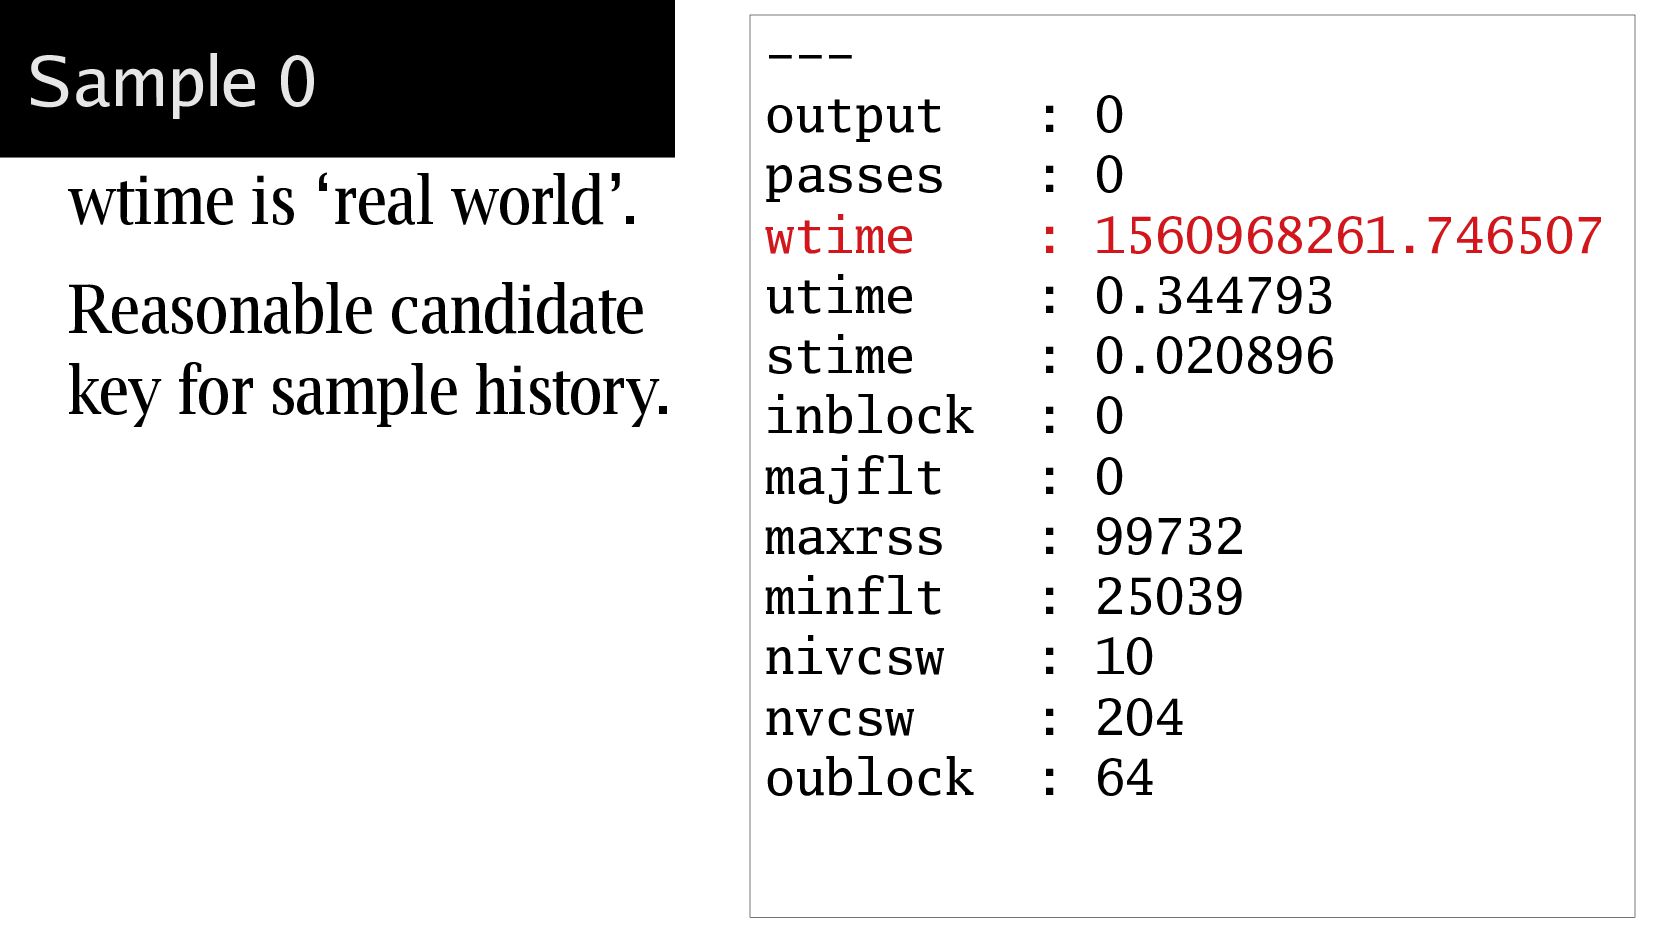
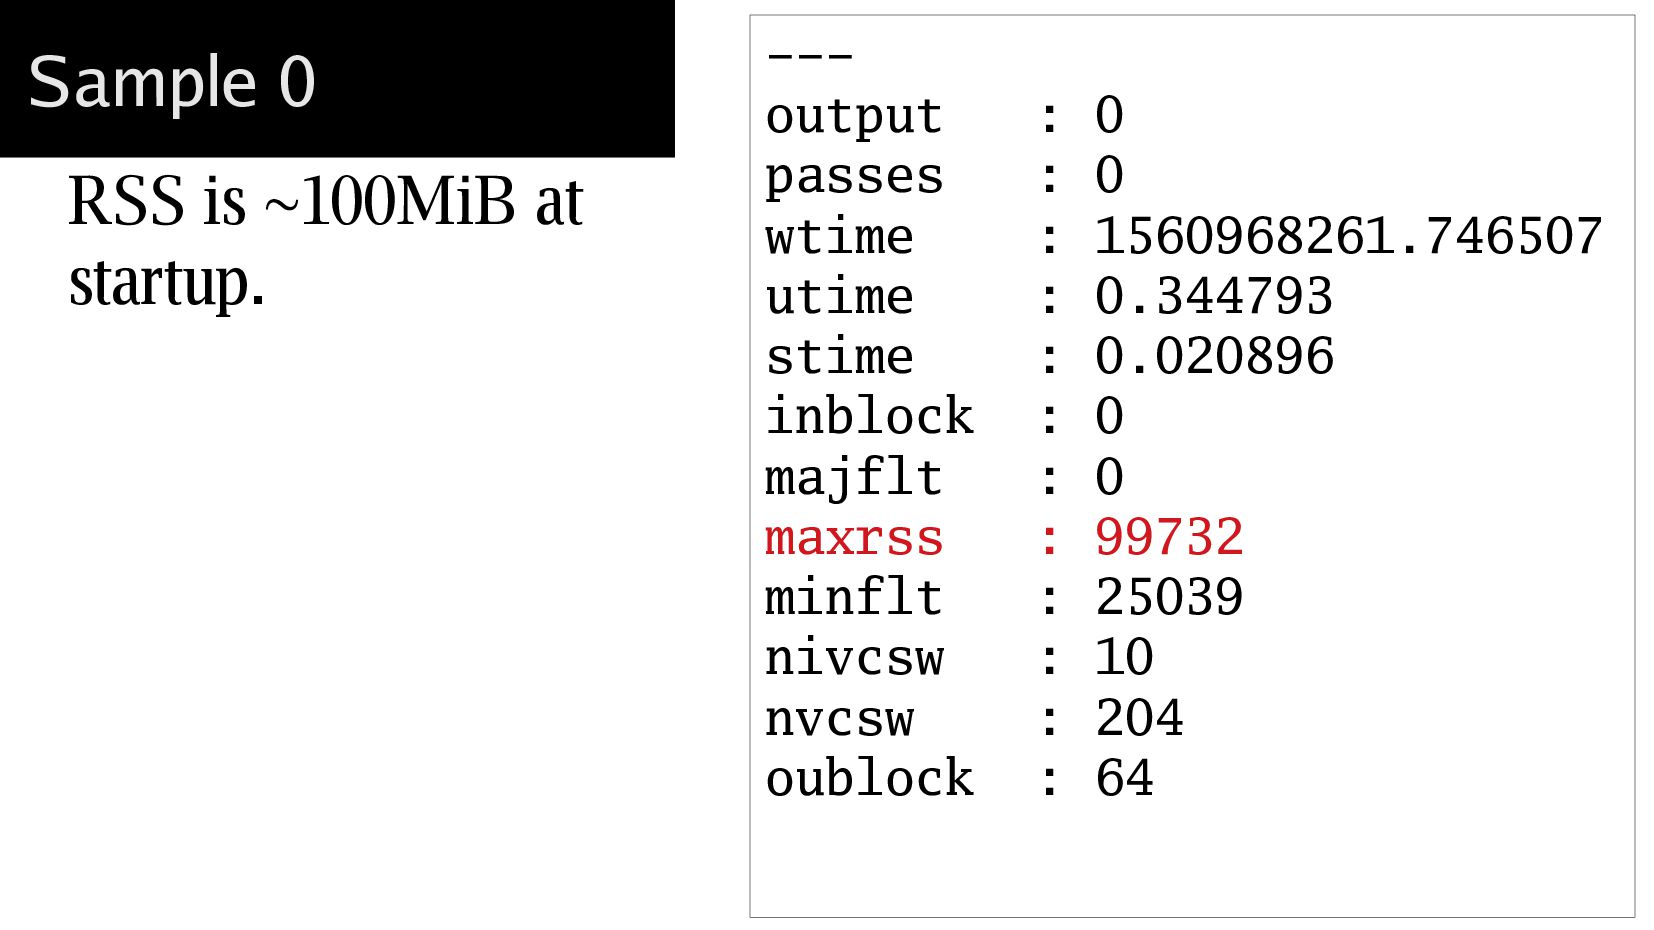
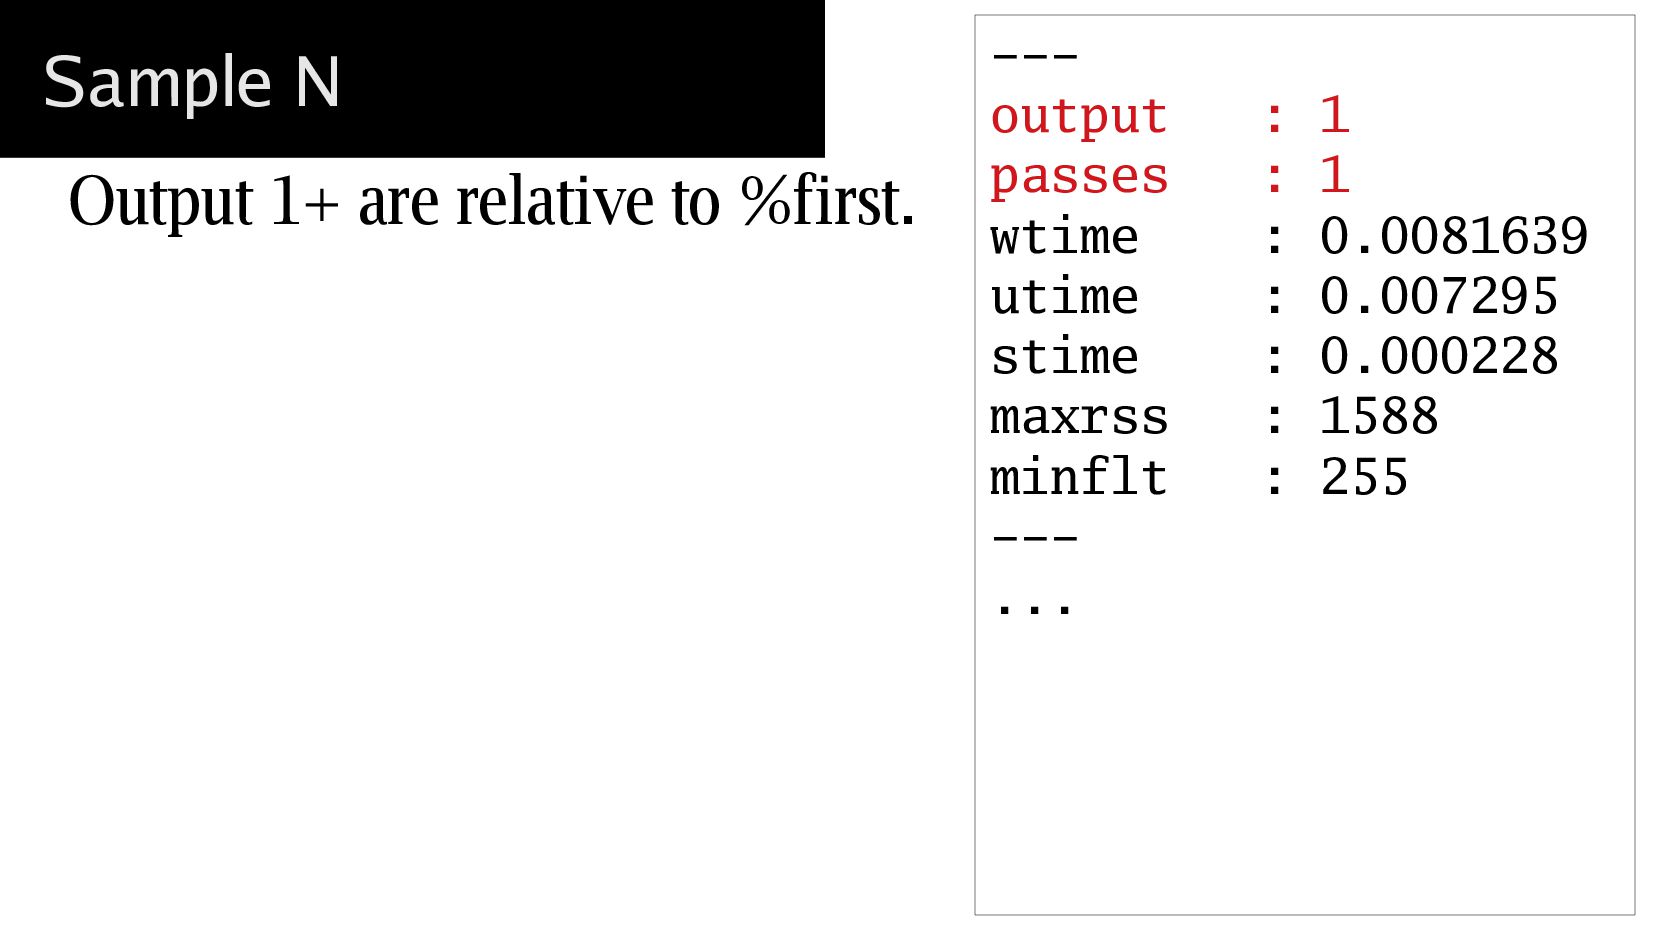
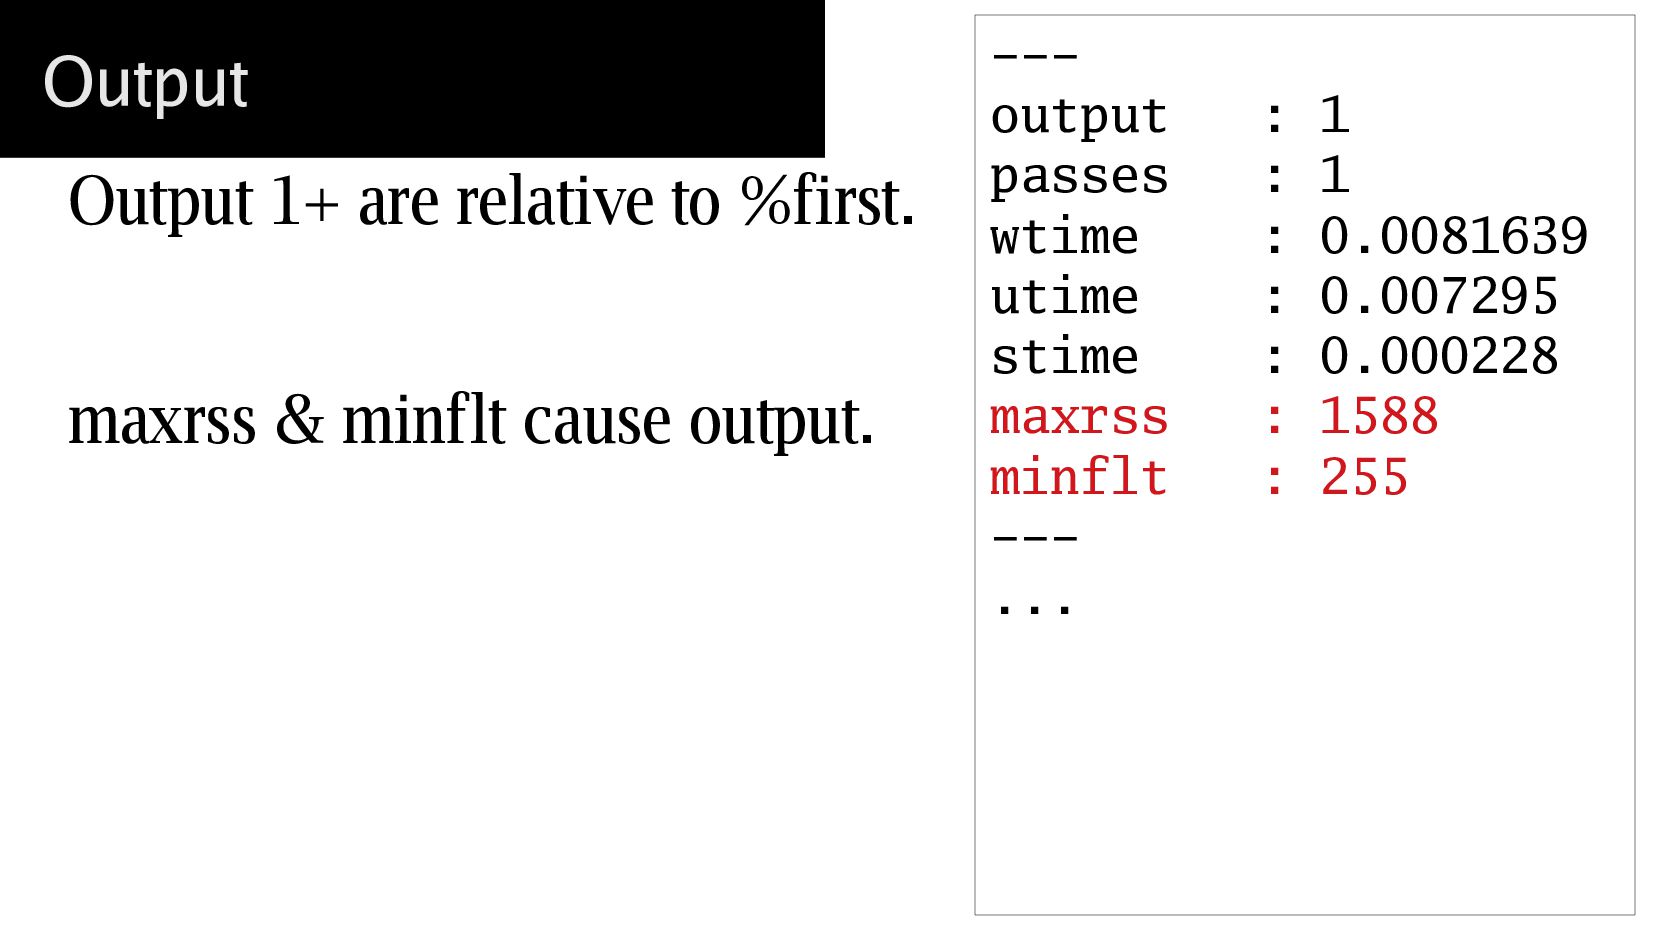
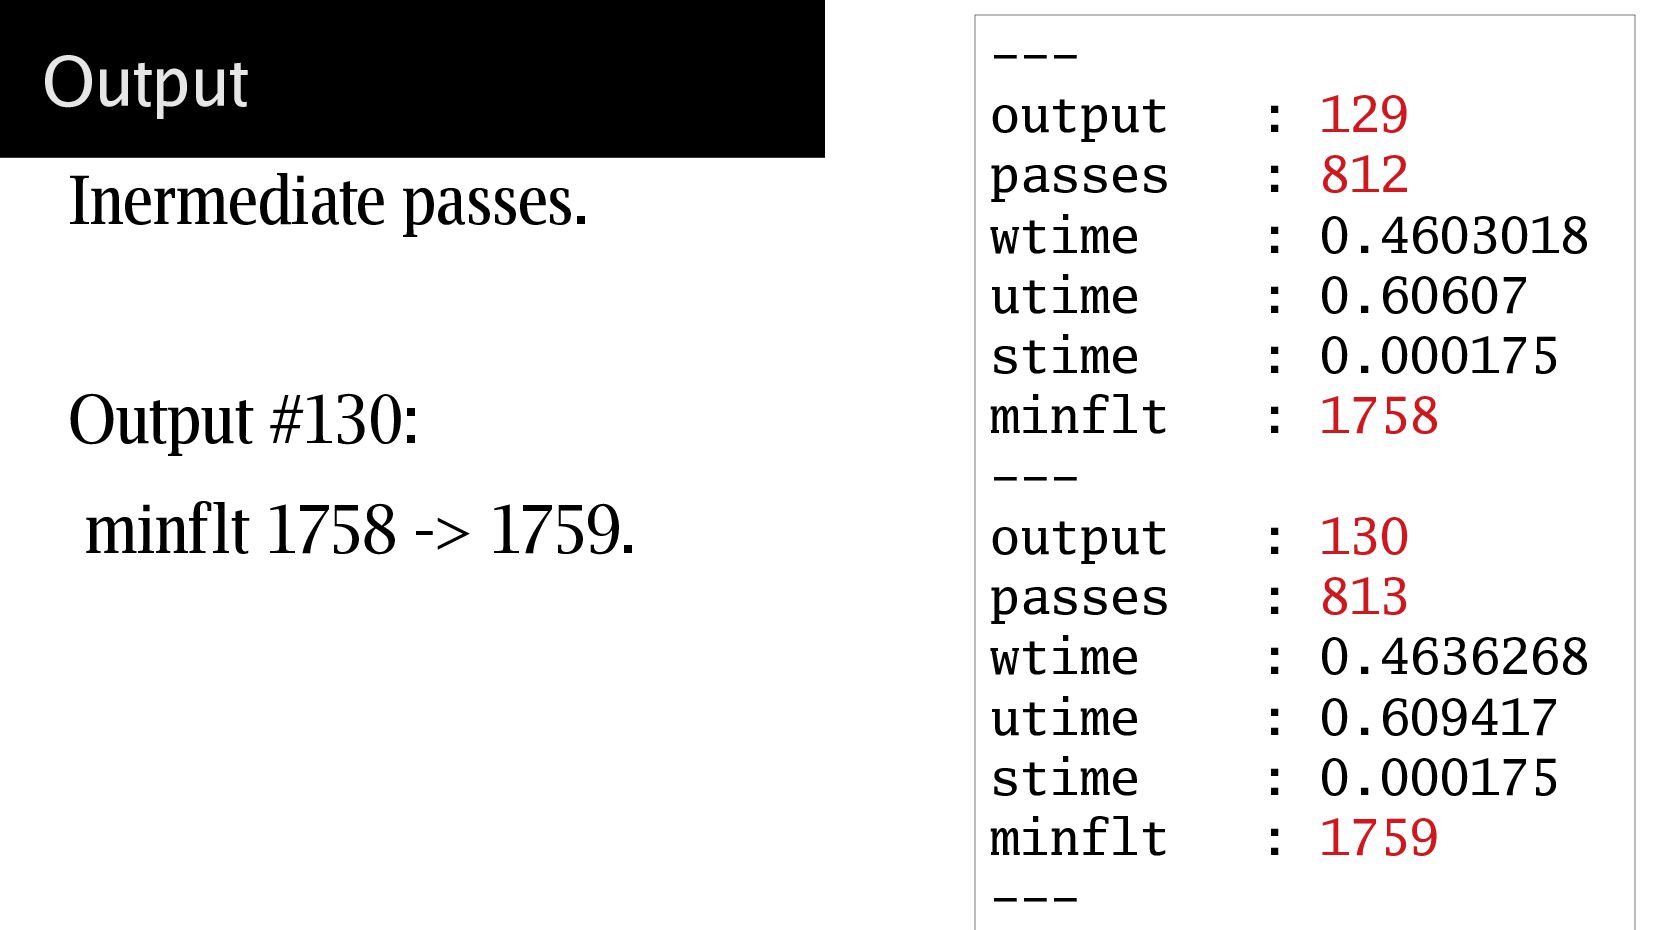
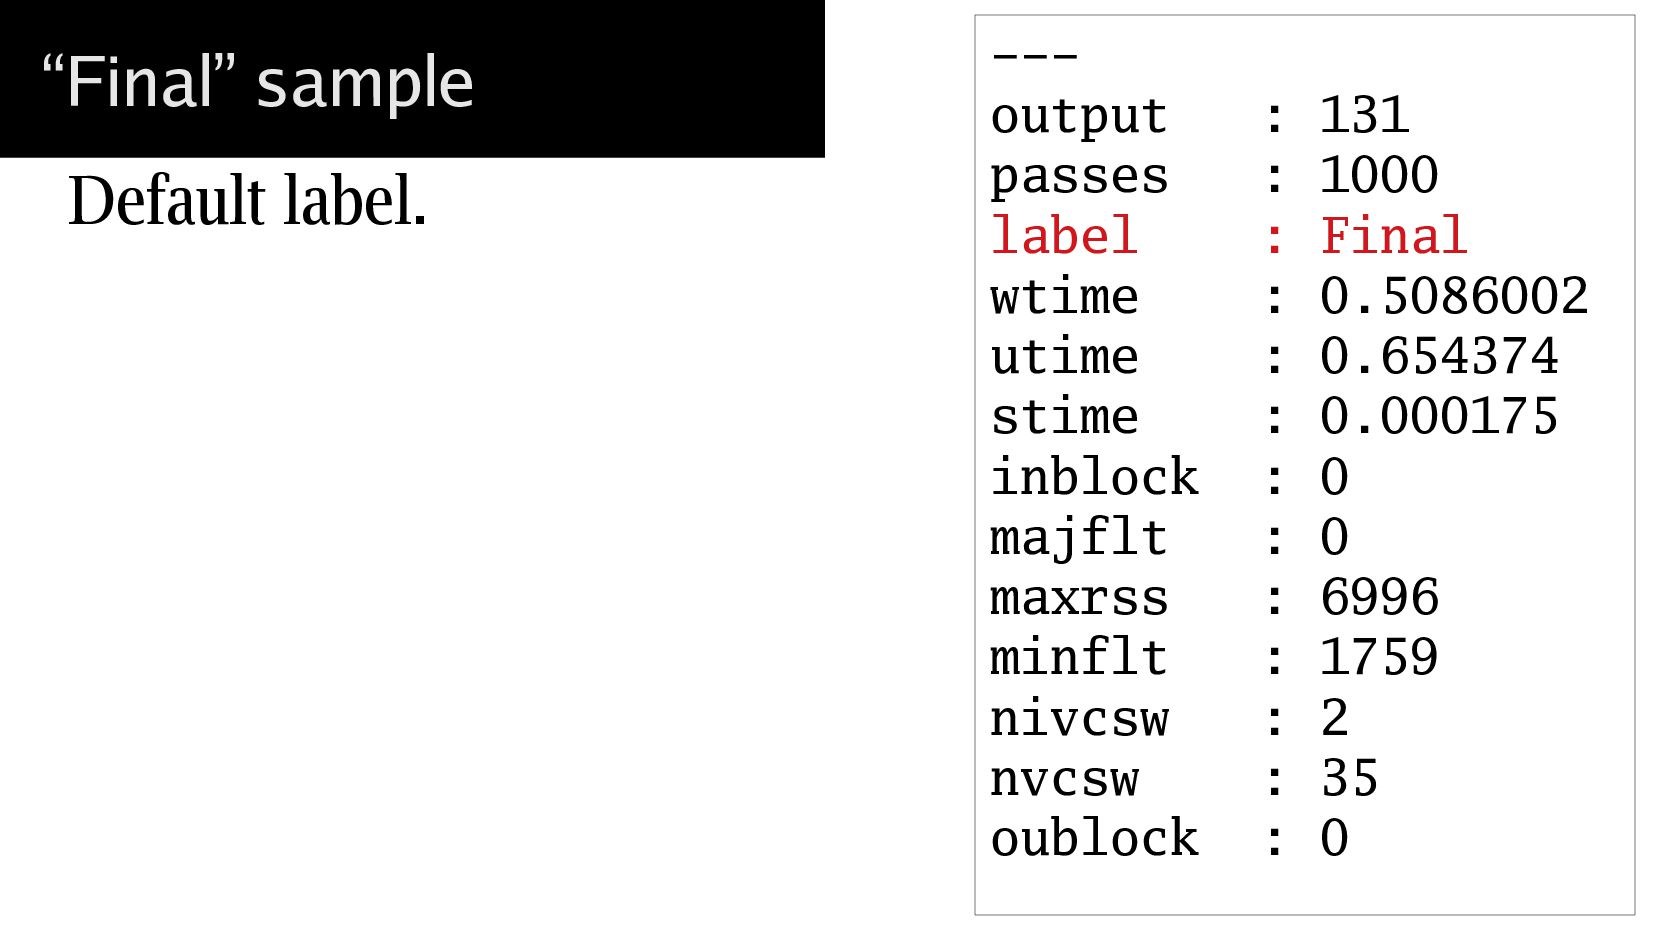
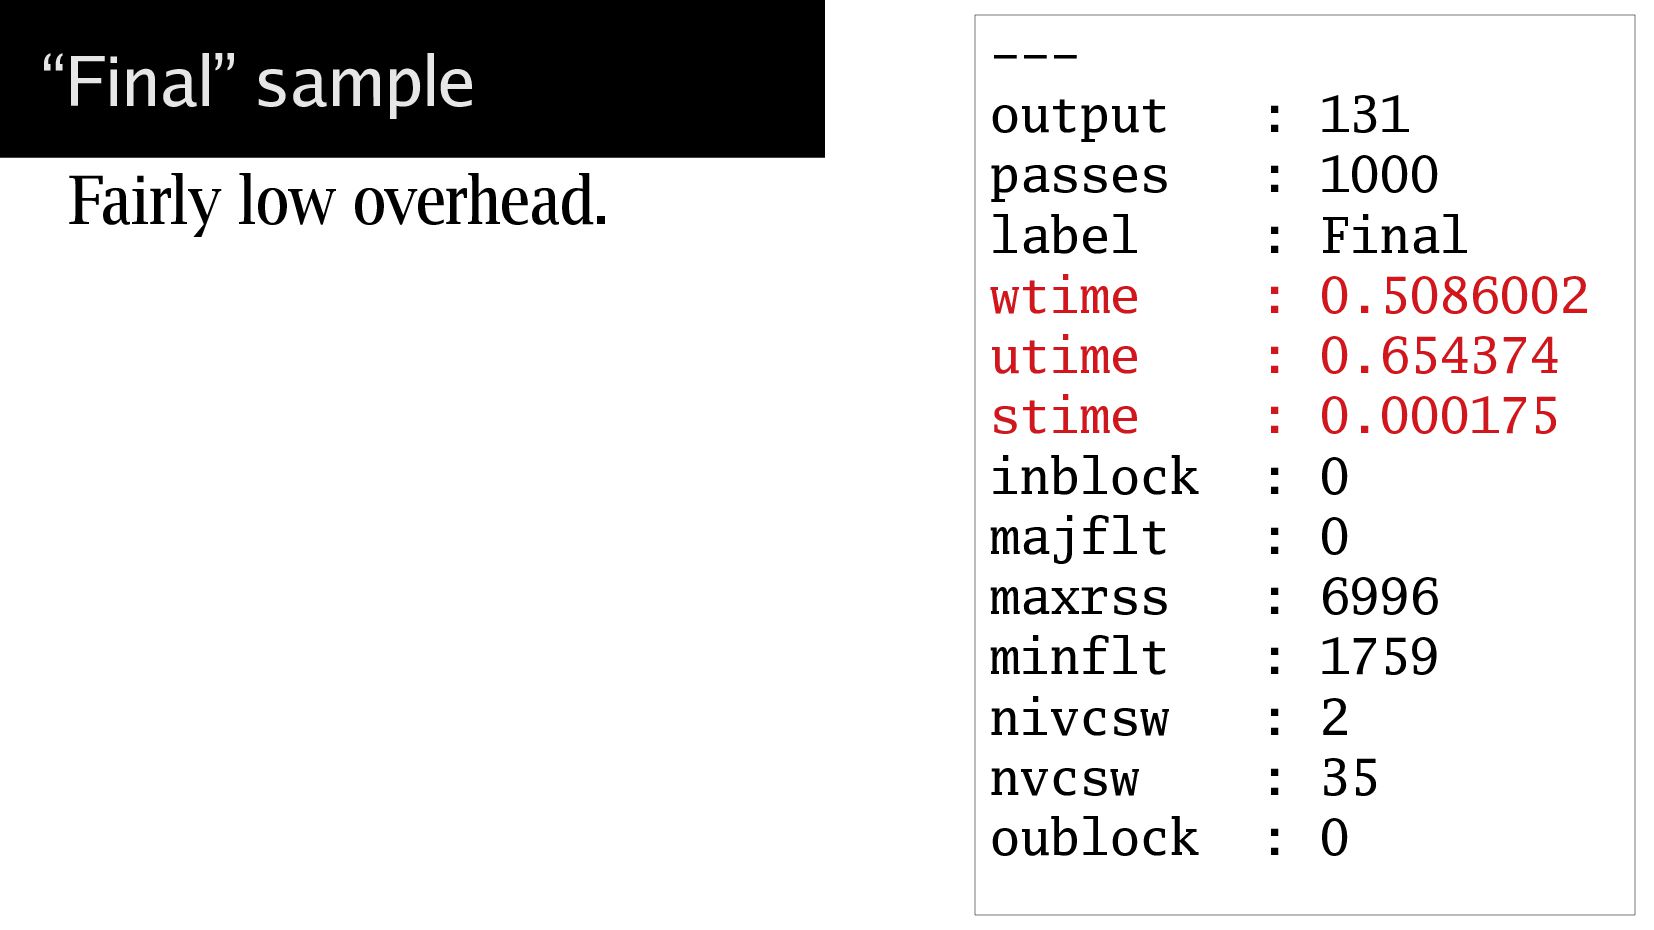
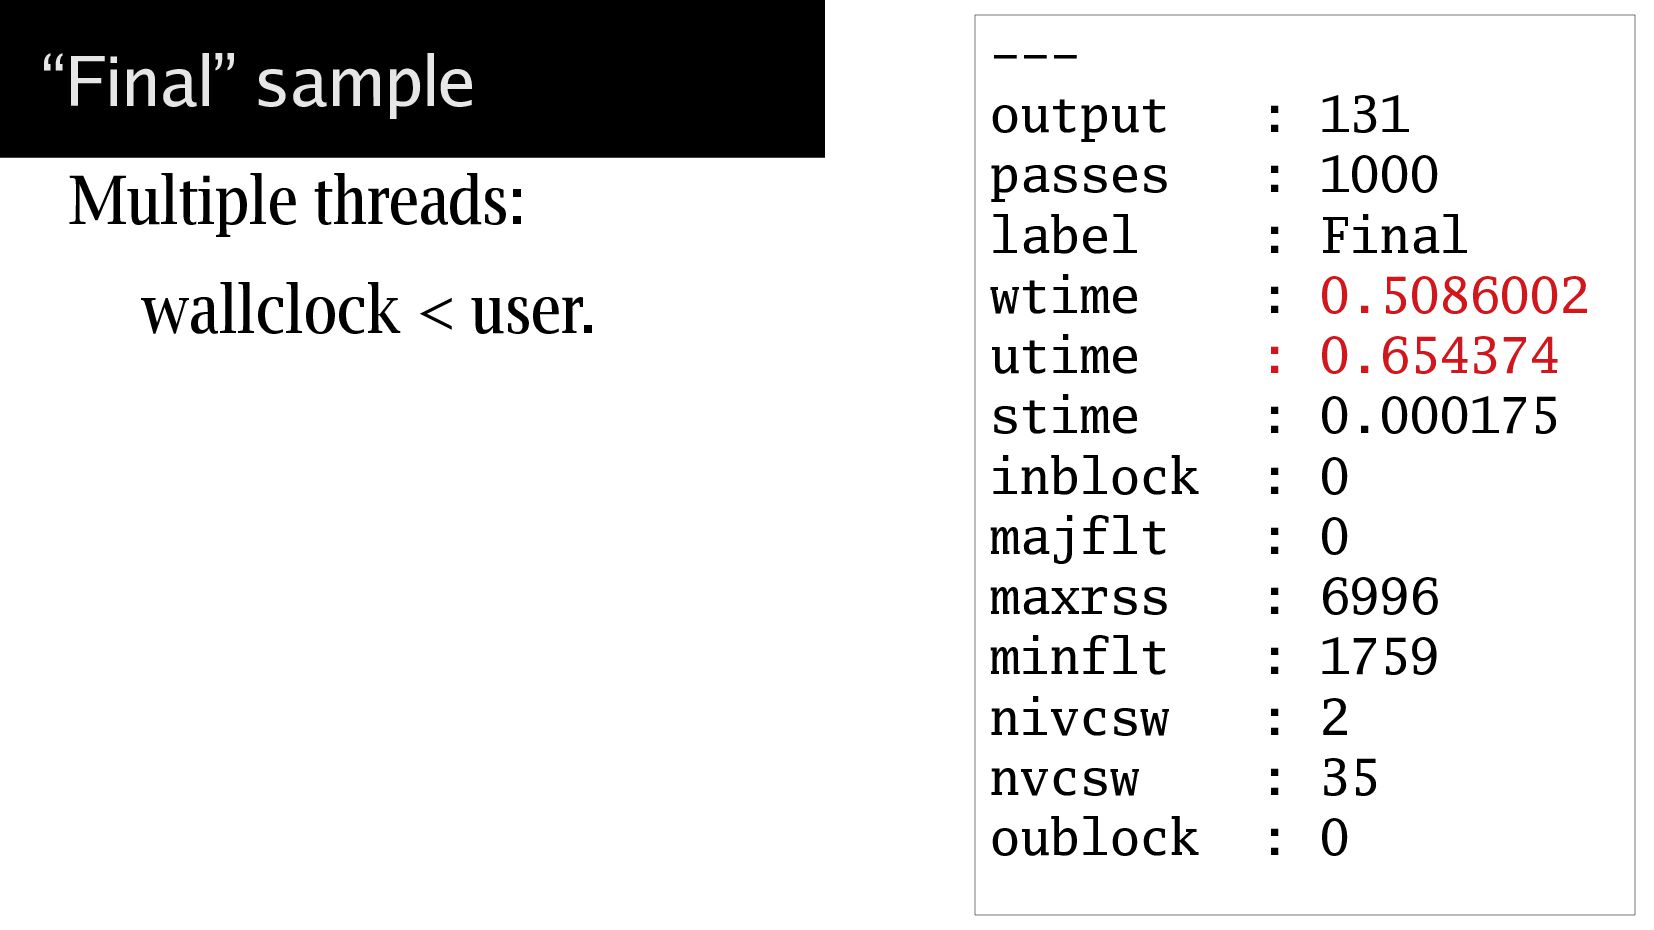
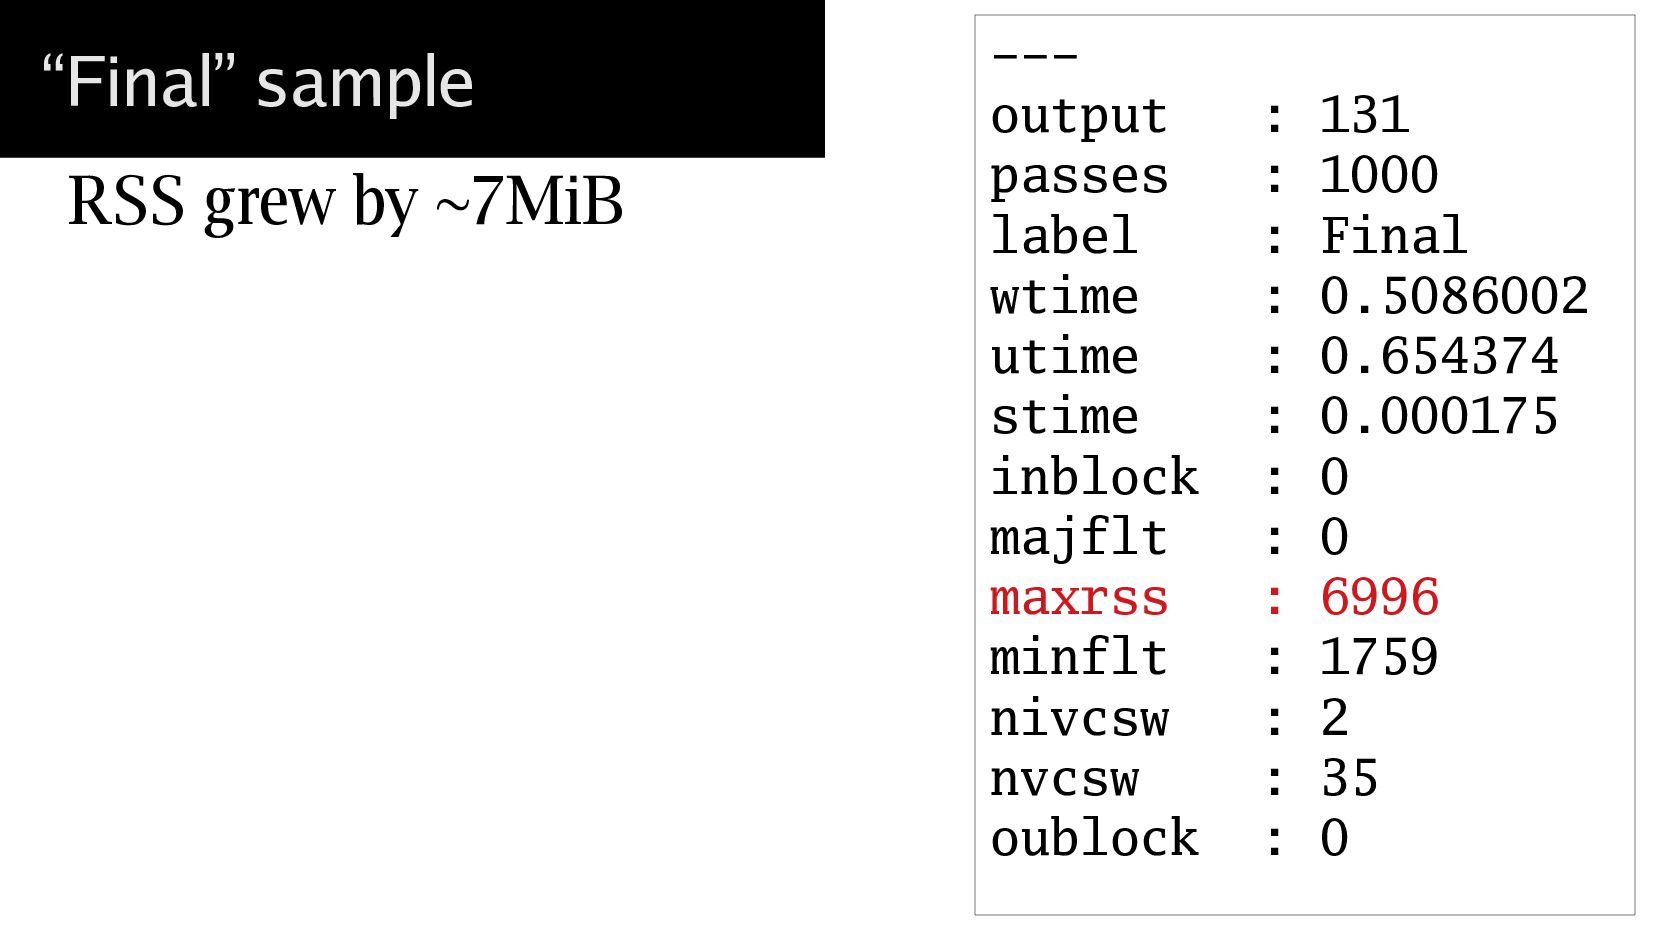
This talk describes the rusage values and shows how they are acquired and output in Raku, including the data handling facilities in Raku used to manage the results.

Steven Lembark
PRO

July 09, 2022
Tweet

More Decks by Steven Lembark

Other Decks in Technology

Transcript

  1. Raku Memory Manglement:
    Checking yourself out.
    Steven Lembark
    Workhorse Computing
    [email protected]

    View Slide

  2. Yes, size() matters.
    But it’s hard to find.
    Process-level stats.
    Mainly “RSS”.
    getrusage(2).
    Acquiring & analyze data.
    Raku tools.

    View Slide

  3. Raku?
    Started out as “Perl6”.
    Then became an entirely new language.
    20/20 hindsight is a wonderful design tool.

    View Slide

  4. RSS?
    “Resident Set Size”
    Virtual pages in physical memory.
    Accessible without a page fault.
    Non-resident VM may be swapped.
    Requires a page fault to access.

    View Slide

  5. Goals of memory managment:
    Work within RSS.
    Reduce page faults.
    Avoid hard faults & swapping.

    View Slide

  6. getrusage(2)
    Returns process memory stats.
    Aggregate values.
    Results constrained by system limits.

    View Slide

  7. getrusage(2)
    struct rusage
    {
    struct timeval ru_utime; /* user CPU time used */
    struct timeval ru_stime; /* system CPU time used */
    long ru_maxrss; /* maximum resident set size */
    long ru_ixrss; /* integral shared memory size */
    long ru_idrss; /* integral unshared data size */
    long ru_isrss; /* integral unshared stack size */
    long ru_minflt; /* page reclaims (soft page faults) */
    long ru_majflt; /* page faults (hard page faults) */
    long ru_nswap; /* swaps */
    long ru_inblock; /* block input operations */
    long ru_oublock; /* block output operations */
    long ru_msgsnd; /* IPC messages sent */
    long ru_msgrcv; /* IPC messages received */
    long ru_nsignals; /* signals received */
    long ru_nvcsw; /* voluntary context switches */
    long ru_nivcsw; /* involuntary context switches */
    };
    POSIX

    View Slide

  8. getrusage(2)
    struct rusage
    {
    struct timeval ru_utime; /* user CPU time used */
    struct timeval ru_stime; /* system CPU time used */
    long ru_maxrss; /* maximum resident set size */
    long ru_ixrss; /* integral shared memory size */
    long ru_idrss; /* integral unshared data size */
    long ru_isrss; /* integral unshared stack size */
    long ru_minflt; /* page reclaims (soft page faults) */
    long ru_majflt; /* page faults (hard page faults) */
    long ru_nswap; /* swaps */
    long ru_inblock; /* block input operations */
    long ru_oublock; /* block output operations */
    long ru_msgsnd; /* IPC messages sent */
    long ru_msgrcv; /* IPC messages received */
    long ru_nsignals; /* signals received */
    long ru_nvcsw; /* voluntary context switches */
    long ru_nivcsw; /* involuntary context switches */
    };
    Linux

    View Slide

  9. getrusage(2)
    struct rusage
    {
    struct timeval ru_utime; /* user CPU time used */
    struct timeval ru_stime; /* system CPU time used */
    long ru_maxrss; /* maximum resident set size */
    long ru_minflt; /* page reclaims (soft page faults) */
    long ru_majflt; /* page faults (hard page faults) */
    long ru_inblock; /* block input operations */
    long ru_oublock; /* block output operations */
    long ru_nvcsw; /* voluntary context switches */
    long ru_nivcsw; /* involuntary context switches */
    };
    Only max
    RSS.
    No way to
    track
    reduction.

    View Slide

  10. getrusage(2)
    struct rusage
    {
    struct timeval ru_utime; /* user CPU time used */
    struct timeval ru_stime; /* system CPU time used */
    long ru_maxrss; /* maximum resident set size */
    long ru_minflt; /* page reclaims (soft page faults) */
    long ru_majflt; /* page faults (hard page faults) */
    long ru_inblock; /* block input operations */
    long ru_oublock; /* block output operations */
    long ru_nvcsw; /* voluntary context switches */
    long ru_nivcsw; /* involuntary context switches */
    };
    Total
    fault
    counts,
    not
    periodic.

    View Slide

  11. Viewing RSS
    Telemetry module.
    Takes periodic snapshots.
    Allows inserting a label to track events.
    Core with nqp.
    Not synchronous with tasks.
    Raku

    View Slide

  12. Viewing RSS
    ProcStats
    Exports “dump-rusage”.
    Differences from first sample.
    Only output changes.
    Track wallclock time.
    Optional label.

    View Slide

  13. :final Output all stats compared to first sample
    ProcStats
    sub dump-rusage
    (
    Bool() :$final = False,
    Bool() :$first = $final,
    Bool() :$force = $final,
    Stringy() :$label = $final ?? 'Final' !! ''
    )
    is export( :DEFAULT )

    View Slide

  14. :first Values compared to first sample (vs. prior).
    ProcStats
    sub dump-rusage
    (
    Bool() :$final = False,
    Bool() :$first = $final,
    Bool() :$force = $final,
    Stringy() :$label = $final ?? 'Final' !! ''
    )
    is export( :DEFAULT )

    View Slide

  15. :force Write all stats (vs. only changed).
    ProcStats
    sub dump-rusage
    (
    Bool() :$final = False,
    Bool() :$first = $final,
    Bool() :$force = $final,
    Stringy() :$label = $final ?? 'Final' !! ''
    )
    is export( :DEFAULT )

    View Slide

  16. :label Add “label” key (default from :final).
    ProcStats
    sub dump-rusage
    (
    Bool() :$final = False,
    Bool() :$first = $final,
    Bool() :$force = $final,
    Stringy() :$label = $final ?? 'Final' !! ''
    )
    is export( :DEFAULT )

    View Slide

  17. Wallclock time
    Elapsed vs. CPU
    sub dump-rusage
    (
    Bool() :$final = False,
    Bool() :$first = $final,
    Bool() :$force = $final,
    Stringy() :$label = $final ?? 'Final' !! ''
    )
    is export( :DEFAULT )
    {
    my $wtime = now.Num;

    View Slide

  18. Wallclock time
    Sample at top to avoid time-shift.
    sub dump-rusage
    (
    Bool() :$final = False,
    Bool() :$first = $final,
    Bool() :$force = $final,
    Stringy() :$label = $final ?? 'Final' !! ''
    )
    is export( :DEFAULT )
    {
    my $wtime = now.Num;

    View Slide

  19. Values from RSS
    constant FIELDS =
    <
    maxrss ixrss idrss isrss minflt majflt
    nswap inblock oublock msgsnd msgrcv nsignals
    nvcsw nivcsw
    >;
    constant IGNORE = ;
    constant REPORT =
    < maxrss majflt minflt inblock oublock >;
    constant MICRO = 10 ** -6;
    COMPARE avoids reporting on CPU swithes.

    View Slide

  20. Track progress
    Unchanged samples are not reported.
    $passes tracks total calls.
    state $passes = 0;
    state %last = ();

    View Slide

  21. Acquire data
    Times are sec + µsec, deal with them separately.
    “Z=>” zips fields & values into a hash.
    use nqp;
    nqp::getrusage( my int @raw );
    my ( $user_s, $user_us, $syst_s, $syst_us )
    = splice @raw, 0, 4;
    my %sample = FIELDS Z=> @raw;
    %sample{ IGNORE } :delete;

    View Slide

  22. Making time
    my $utime
    = ( $user_s + $user_us / 1_000_000 ).round( MICRO );
    my $stime
    = ( $syst_s + $syst_us / 1_000_000 ).round( MICRO );
    user & system time begin as two ints.
    Round gives reasonable precision in output.

    View Slide

  23. Store baseline values.
    state %last =
    state %first =
    (
    |%sample,
    :$wtime,
    :$utime,
    :$stime,
    );
    First is never updated.
    Get a working “last” value on the first pass.

    View Slide

  24. Store baseline values.
    Flatten %sample into pairs.
    state %last =
    state %first =
    (
    |%sample,
    :$wtime,
    :$utime,
    :$stime,
    );

    View Slide

  25. Store baseline values.
    Times as pairs.
    state %last =
    state %first =
    (
    |%sample,
    :$wtime,
    :$utime,
    :$stime,
    );

    View Slide

  26. First is last at first.
    After first last is last.
    my %prior
    = $first
    ?? %first
    !! %last
    ;

    View Slide

  27. What to compare?
    Force reports full sample.
    COMPARE limits keys compare to %prior & output.
    my %curr
    = ( $force || ! $passes )
    ?? %sample
    !! do
    {
    my @diffs
    = REPORT.grep( { %sample{$_} != %prior{$_} } );
    @diffs Z=> %sample{ @diffs }
    };

    View Slide

  28. Write out one stat heading & value.
    Compute column width once during execution.
    sub write-stat ( Pair $p )
    {
    note
    sprintf
    '%-*s : %s',
    once {FIELDS».chars.max},
    $p.key,
    $p.value
    ;
    }

    View Slide

  29. Write progressive value
    Numerics compared to starting baseline.
    Simplifies tracking code results.
    sub write-diff ( Pair $p )
    {
    my $k = $p.key;
    my $v = $p.value - %first{ $k };
    write-stat $k => $v;
    }

    View Slide

  30. First pass writes all stats.
    First pass has to report baseline values.
    state $write = &write-stat;

    View Slide

  31. First pass writes all stats.
    First pass has to report baseline values.
    After that report differences.
    state &write = &write-stat;
    ...
    write $stat;
    ...
    once { &write = &write-diff };

    View Slide

  32. for %curr.sort -> $stat
    {
    FIRST
    {
    note '---';
    write-stat ( output => $++ );
    write-stat ( :$passes );
    write-stat ( :$label ) if $label;
    write-diff ( :$wtime );
    write-diff ( :$utime );
    write-diff ( :$stime );
    }
    write $stat
    }

    View Slide

  33. for %curr.sort -> $stat
    {
    FIRST
    {
    note '---';
    write-stat ( output => $++ );
    write-stat ( :$passes );
    write-stat ( :$label ) if $label;
    write-diff ( :$wtime );
    write-diff ( :$utime );
    write-diff ( :$stime );
    }
    write $stat
    }

    View Slide

  34. for %curr.sort -> $stat
    {
    FIRST
    {
    note '---';
    write-stat ( output => $++ );
    write-stat ( :$passes );
    write-stat ( :$label ) if $label;
    write-diff ( :$wtime );
    write-diff ( :$utime );
    write-diff ( :$stime );
    }
    write $stat
    }

    View Slide

  35. for %curr.sort -> $stat
    {
    FIRST
    {
    note '---';
    write-stat ( output => $++ );
    write-stat ( :$passes );
    write-stat ( :$label ) if $label;
    write-diff ( :$wtime );
    write-diff ( :$utime );
    write-diff ( :$stime );
    }
    write $stat
    }

    View Slide

  36. for %curr.sort -> $stat
    {
    FIRST
    {
    note '---';
    write-stat ( output => $++ );
    write-stat ( :$passes );
    write-stat ( :$label ) if $label;
    write-diff ( :$wtime );
    write-diff ( :$utime );
    write-diff ( :$stime );
    }
    write $stat
    }

    View Slide

  37. Last steps
    Up total count.
    Store current sample for re-use.
    ++$passes;
    %last = %sample;
    once { &write = &write-diff };

    View Slide

  38. Baseline usage
    Bare for-loop
    Shows overhead of rusage output.
    #!/usr/bin/env Raku
    use v6.d;
    use FindBin::libs;
    use ProcStats;
    dump-rusage for 1 .. 1_000;
    dump-rusage( :final );

    View Slide

  39. Sample 0
    Pass 0 as all values.
    Baseline for RSS &
    friends.
    ---
    output : 0
    passes : 0
    wtime : 1560968261.746507
    utime : 0.344793
    stime : 0.020896
    inblock : 0
    majflt : 0
    maxrss : 99732
    minflt : 25039
    nivcsw : 10
    nvcsw : 204
    oublock : 64

    View Slide

  40. Sample 0
    wtime is ‘real world’.
    Reasonable candidate
    key for sample history.
    ---
    output : 0
    passes : 0
    wtime : 1560968261.746507
    utime : 0.344793
    stime : 0.020896
    inblock : 0
    majflt : 0
    maxrss : 99732
    minflt : 25039
    nivcsw : 10
    nvcsw : 204
    oublock : 64

    View Slide

  41. Sample 0
    RSS is ~100MiB at
    startup.
    ---
    output : 0
    passes : 0
    wtime : 1560968261.746507
    utime : 0.344793
    stime : 0.020896
    inblock : 0
    majflt : 0
    maxrss : 99732
    minflt : 25039
    nivcsw : 10
    nvcsw : 204
    oublock : 64

    View Slide

  42. Output
    Output 1+ are relative to %first.
    Sample N ---
    output : 1
    passes : 1
    wtime : 0.0081639
    utime : 0.007295
    stime : 0.000228
    maxrss : 1588
    minflt : 255
    ---
    ...

    View Slide

  43. Output
    Output 1+ are relative to %first.
    maxrss & minflt cause output.
    Output ---
    output : 1
    passes : 1
    wtime : 0.0081639
    utime : 0.007295
    stime : 0.000228
    maxrss : 1588
    minflt : 255
    ---
    ...

    View Slide

  44. Output
    Inermediate passes.
    Output #130:
    minflt 1758 -> 1759.
    Output ---
    output : 129
    passes : 812
    wtime : 0.4603018
    utime : 0.60607
    stime : 0.000175
    minflt : 1758
    ---
    output : 130
    passes : 813
    wtime : 0.4636268
    utime : 0.609417
    stime : 0.000175
    minflt : 1759
    ---

    View Slide

  45. Output
    getrulsage( :final );
    Shows all fields.
    About 1/8 of passes had output.
    “Final” sample ---
    output : 131
    passes : 1000
    label : Final
    wtime : 0.5086002
    utime : 0.654374
    stime : 0.000175
    inblock : 0
    majflt : 0
    maxrss : 6996
    minflt : 1759
    nivcsw : 2
    nvcsw : 35
    oublock : 0

    View Slide

  46. Default label.
    ---
    output : 131
    passes : 1000
    label : Final
    wtime : 0.5086002
    utime : 0.654374
    stime : 0.000175
    inblock : 0
    majflt : 0
    maxrss : 6996
    minflt : 1759
    nivcsw : 2
    nvcsw : 35
    oublock : 0
    “Final” sample

    View Slide

  47. Fairly low overhead.
    ---
    output : 131
    passes : 1000
    label : Final
    wtime : 0.5086002
    utime : 0.654374
    stime : 0.000175
    inblock : 0
    majflt : 0
    maxrss : 6996
    minflt : 1759
    nivcsw : 2
    nvcsw : 35
    oublock : 0
    “Final” sample

    View Slide

  48. Multiple threads:
    wallclock < user.
    ---
    output : 131
    passes : 1000
    label : Final
    wtime : 0.5086002
    utime : 0.654374
    stime : 0.000175
    inblock : 0
    majflt : 0
    maxrss : 6996
    minflt : 1759
    nivcsw : 2
    nvcsw : 35
    oublock : 0
    “Final” sample

    View Slide

  49. RSS grew by ~7MiB
    ---
    output : 131
    passes : 1000
    label : Final
    wtime : 0.5086002
    utime : 0.654374
    stime : 0.000175
    inblock : 0
    majflt : 0
    maxrss : 6996
    minflt : 1759
    nivcsw : 2
    nvcsw : 35
    oublock : 0
    “Final” sample

    View Slide

  50. Really do something...
    Simulate traking userid’s on a web server:
    Add a hash key.
    Increment a random value.
    Drop a key.

    View Slide

  51. Roll your own
    Random hash key via random sample.
    sub random-string
    (
    Int() :$size = ( 1 .. 10 ).pick
    --> Str
    )
    {
    constant alpha = [ 'a' ... 'z', 'A' ... 'Z' ];
    alpha.roll( $size ).join;
    }

    View Slide

  52. Roll your own
    pick() returns a single, random value.
    sub random-string
    (
    Int() :$size = ( 1 .. 10 ).pick
    --> Str
    )
    {
    constant alpha = [ 'a' ... 'z', 'A' ... 'Z' ];
    alpha.roll( $size ).join;
    }

    View Slide

  53. Roll your own
    roll() returns a random sample.
    sub random-string
    (
    Int() :$size = ( 1 .. 10 ).pick
    --> Str
    )
    {
    constant alpha = [ 'a' ... 'z', 'A' ... 'Z' ];
    alpha.roll( $size ).join;
    }

    View Slide

  54. Fake userid
    Track key counts, active keys.
    sub user-add
    {
    ++%user-data{ random-string };
    ++$adds;
    $max-keys = max $max-keys, %user-data.elems;
    }

    View Slide

  55. Random key selection
    sub user-drop
    {
    %user-data or return;
    ++$drops;
    %user-data{ %user-data.pick.key } :delete;
    }
    sub user-op
    {
    %user-data or return;
    ++$ops;
    ++%user-data{ %user-data.pick.key };
    }

    View Slide

  56. Randomized, weighted trial.
    for 1 .. 1000
    {
    constant weighted_operations =
    (
    &user-add => 0.10,
    &user-drop => 0.10,
    &user-op => 0.80,
    ).Mix;
    weighted_operations.roll( 1_000 )».();
    dump-rusage(label => 'Keys: '~%user‑data.elems );
    }

    View Slide

  57. Define op’s and weights.
    for 1 .. 1000
    {
    constant weighted_operations =
    (
    &user-add => 0.10,
    &user-drop => 0.10,
    &user-op => 0.80,
    ).Mix;
    weighted_operations.roll( 1_000 )».();
    dump-rusage(label => 'Keys: '~%user‑data.elems );
    }

    View Slide

  58. 1000 iterations of trial.
    for 1 .. 1000
    {
    constant weighted_operations =
    (
    &user-add => 0.10,
    &user-drop => 0.10,
    &user-op => 0.80,
    ).Mix;
    weighted_operations.roll( 1_000 )».();
    dump-rusage(label => 'Keys: '~%user‑data.elems );
    }

    View Slide

  59. Report summary
    “say” is stdout, dump-rusage is stderr.
    :final uses %first as reference for values.
    dump-rusage( :final );
    say 'Total adds: ' ~ $adds;
    say 'Total drops: ' ~ $drops;
    say 'Total ops: ' ~ $ops;
    say 'Max keys: ' ~ $max-keys;
    say 'Final keys: ' ~ %user-data.elems;

    View Slide

  60. Getting stats
    Easier to read with separate files.
    $ ./rand-user-table >stats.out 2>stats.yaml;

    View Slide

  61. Stats results
    Final results from
    “say”.
    Total adds: 99738
    Total drops: 98755
    Total ops: 787133
    Max keys: 213
    Final keys: 144

    View Slide

  62. Stats results
    Final sample:
    1000 iterations/pass.
    Extra time from
    threading.
    ~18MiB RSS growth.
    ---
    output : 518
    passes : 1001
    label : Final
    wtime : 18.668069
    utime : 18.846082
    stime : 0.01101
    inblock : 0
    majflt : 0
    maxrss : 18404
    minflt : 5522
    nivcsw : 61
    nvcsw : 83
    oublock : 128

    View Slide

  63. What you see is all you get.
    RSS, faults.
    Per-process totals.
    Not per structure.
    Randomized trials simple in Raku.
    Monitor results after specific operations.

    View Slide