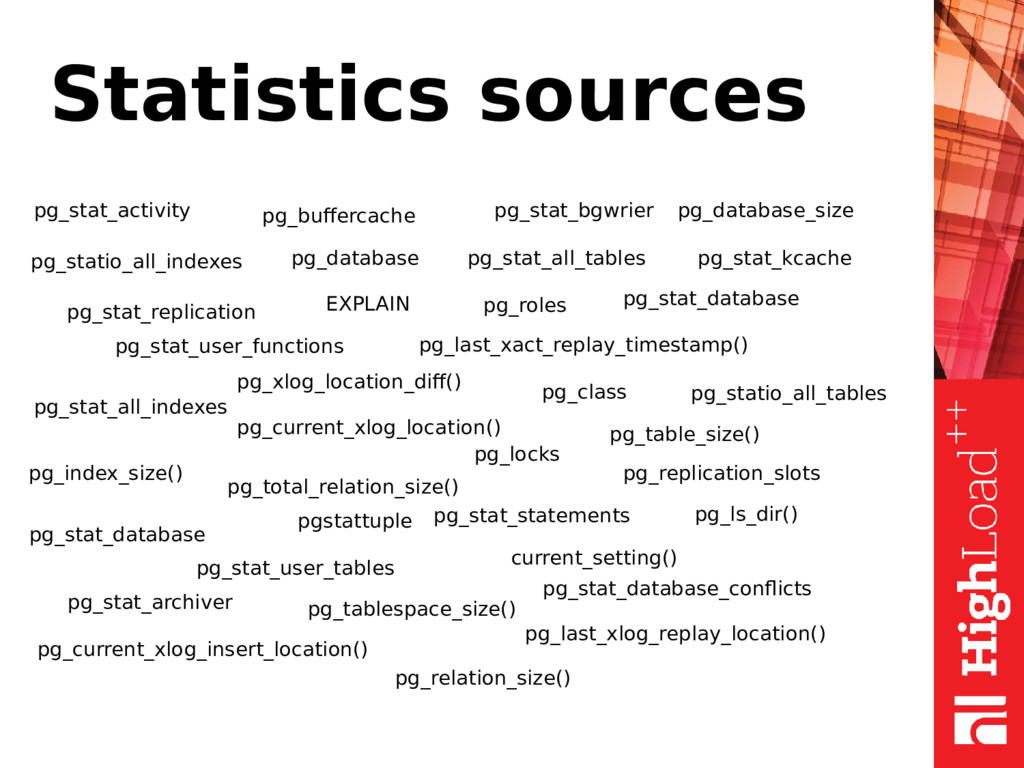
Statistics provided as an online counters. No history (but reset functions are available). No native handy stat tools in PostgreSQL. Too many 3rd party tools and programs.
Statistics provided as an online counters. No history (but reset functions are available). No native handy stat tools in PostgreSQL. Too many 3rd party tools and programs. Important to use stats directly from Postgres. Basic SQL skills are required.
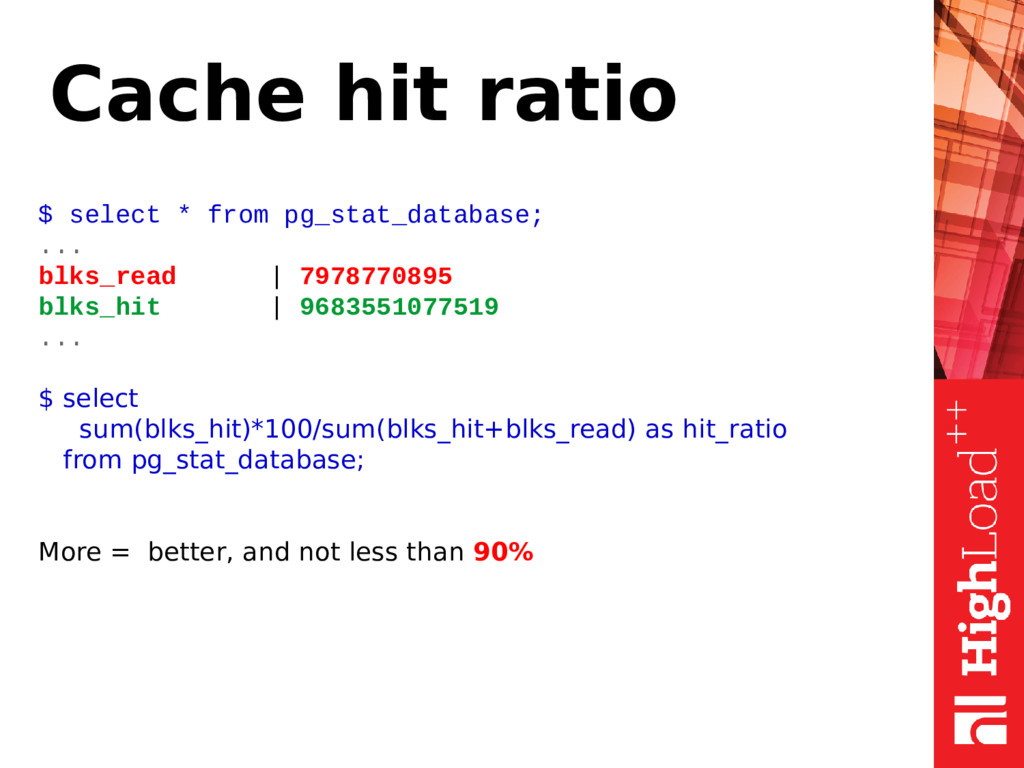
| 7978770895 blks_hit | 9683551077519 ... $ select sum(blks_hit)*100/sum(blks_hit+blks_read) as hit_ratio from pg_stat_database; More = better, and not less than 90%
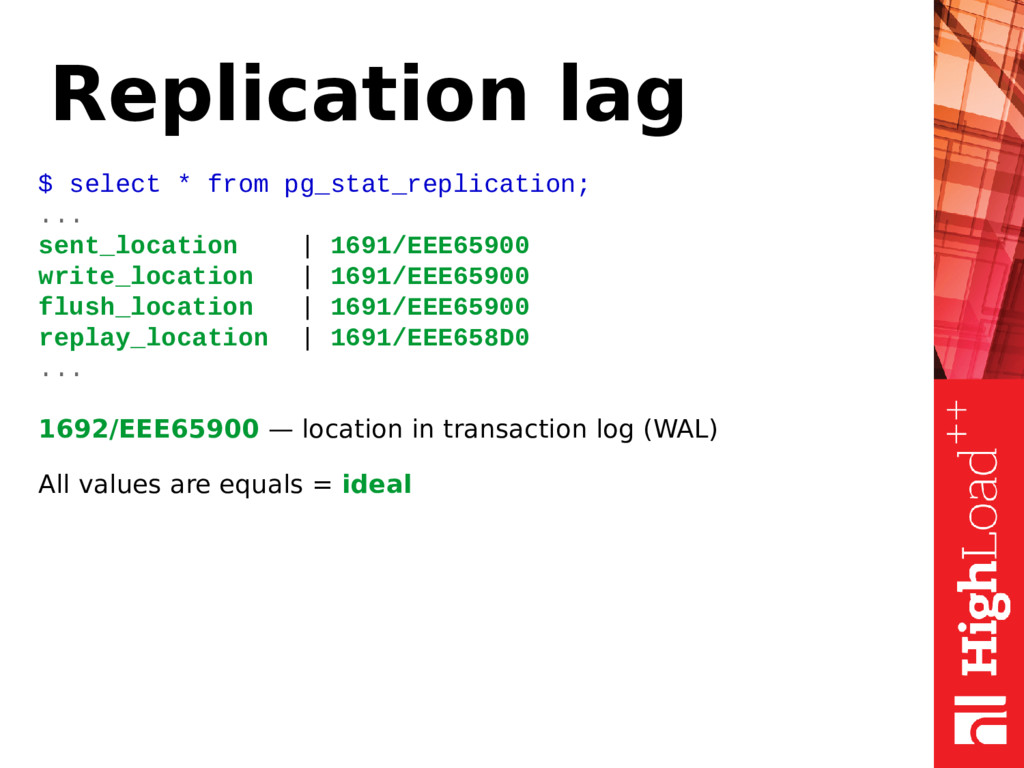
much bytes written in WAL $ select pg_xlog_location_diff(pg_current_xlog_location(),'0/00000000'); Replication lag in bytes $ select client_addr, pg_xlog_location_diff(pg_current_xlog_location(), replay_location) from pg_stat_replication; Replication lag in seconds $ select extract(epoch from now() - pg_last_xact_replay_timestamp());
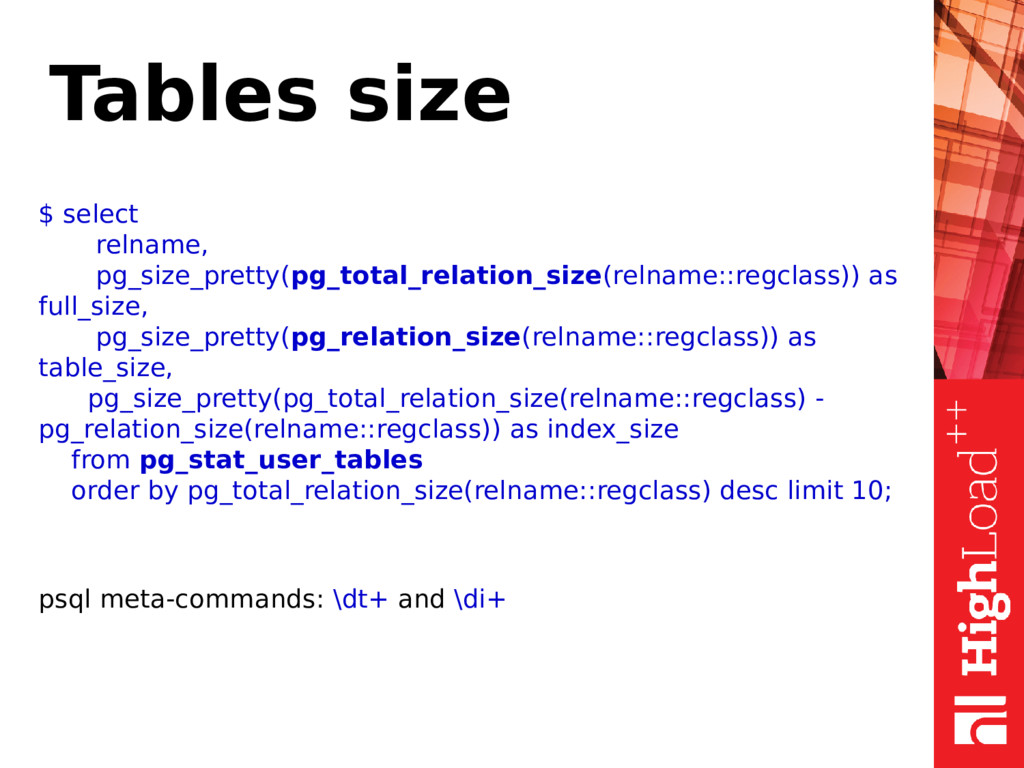
table_size, pg_size_pretty(pg_total_relation_size(relname::regclass) - pg_relation_size(relname::regclass)) as index_size from pg_stat_user_tables order by pg_total_relation_size(relname::regclass) desc limit 10; psql meta-commands: \dt+ and \di+
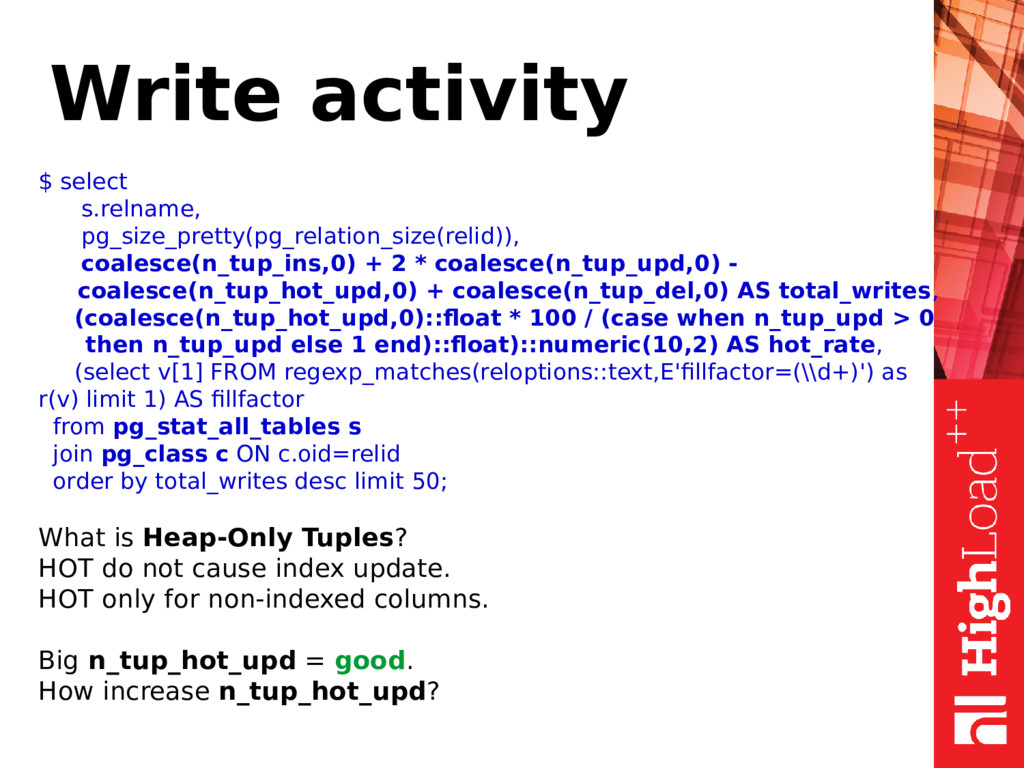
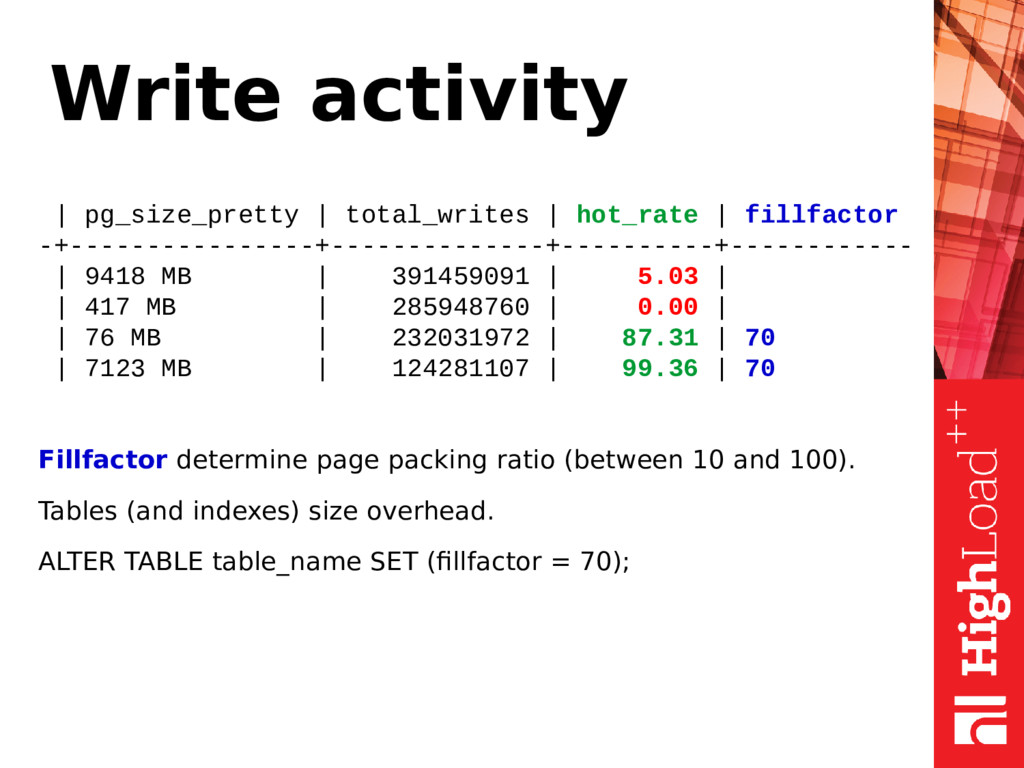
coalesce(n_tup_upd,0) - coalesce(n_tup_hot_upd,0) + coalesce(n_tup_del,0) AS total_writes, (coalesce(n_tup_hot_upd,0)::float * 100 / (case when n_tup_upd > 0 then n_tup_upd else 1 end)::float)::numeric(10,2) AS hot_rate, (select v[1] FROM regexp_matches(reloptions::text,E'fillfactor=(\\d+)') as r(v) limit 1) AS fillfactor from pg_stat_all_tables s join pg_class c ON c.oid=relid order by total_writes desc limit 50; What is Heap-Only Tuples? HOT do not cause index update. HOT only for non-indexed columns. Big n_tup_hot_upd = good. How increase n_tup_hot_upd?
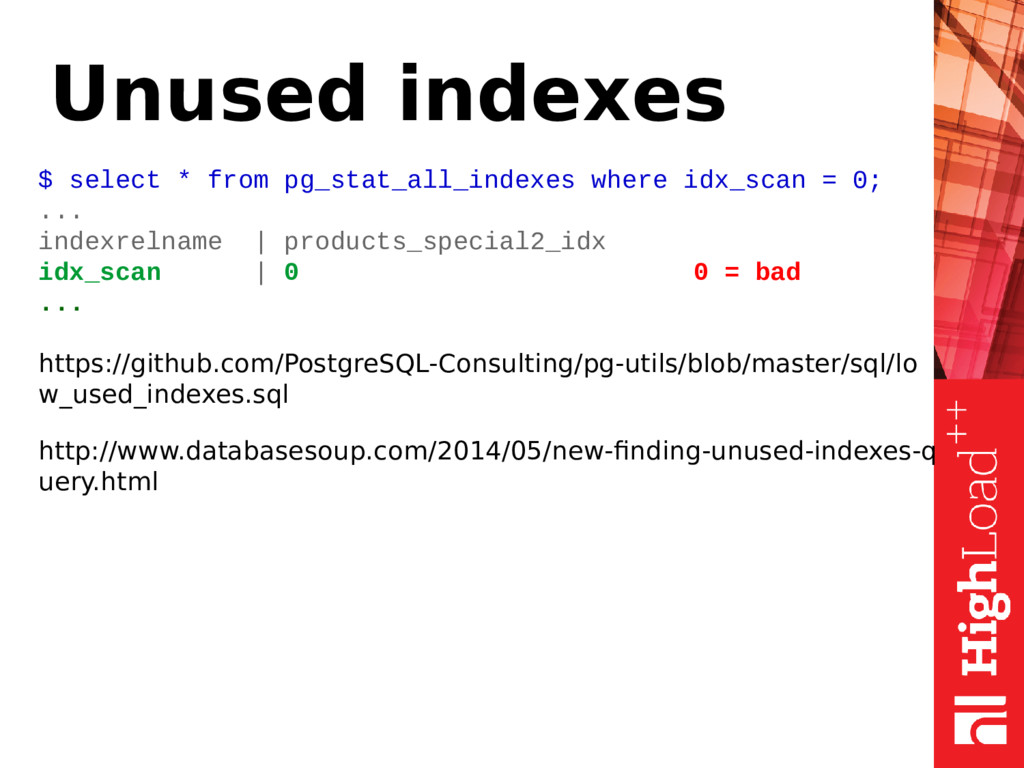
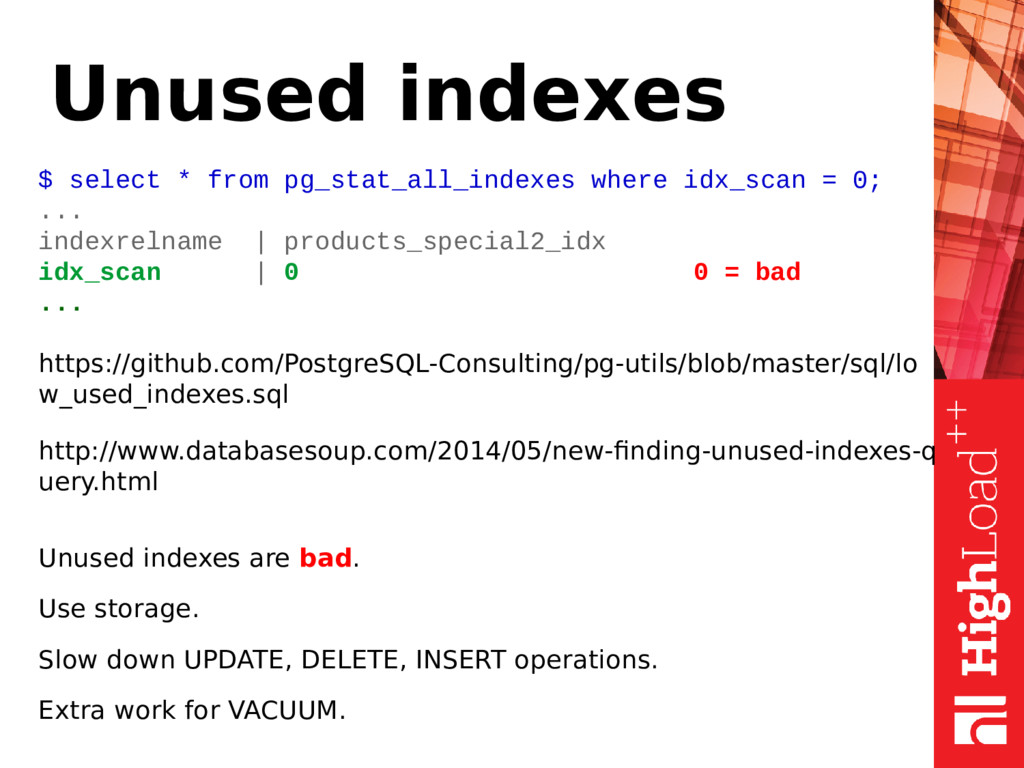
0; ... indexrelname | products_special2_idx idx_scan | 0 0 = bad ... https://github.com/PostgreSQL-Consulting/pg-utils/blob/master/sql/lo w_used_indexes.sql http://www.databasesoup.com/2014/05/new-finding-unused-indexes-q uery.html Unused indexes are bad. Use storage. Slow down UPDATE, DELETE, INSERT operations. Extra work for VACUUM.
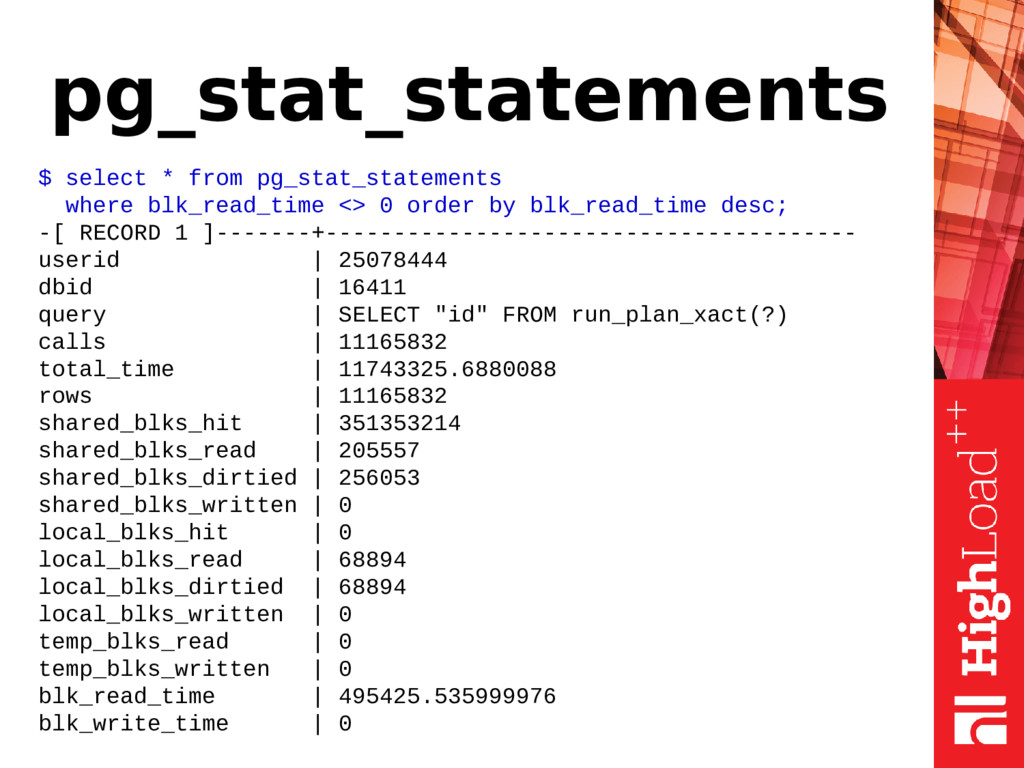
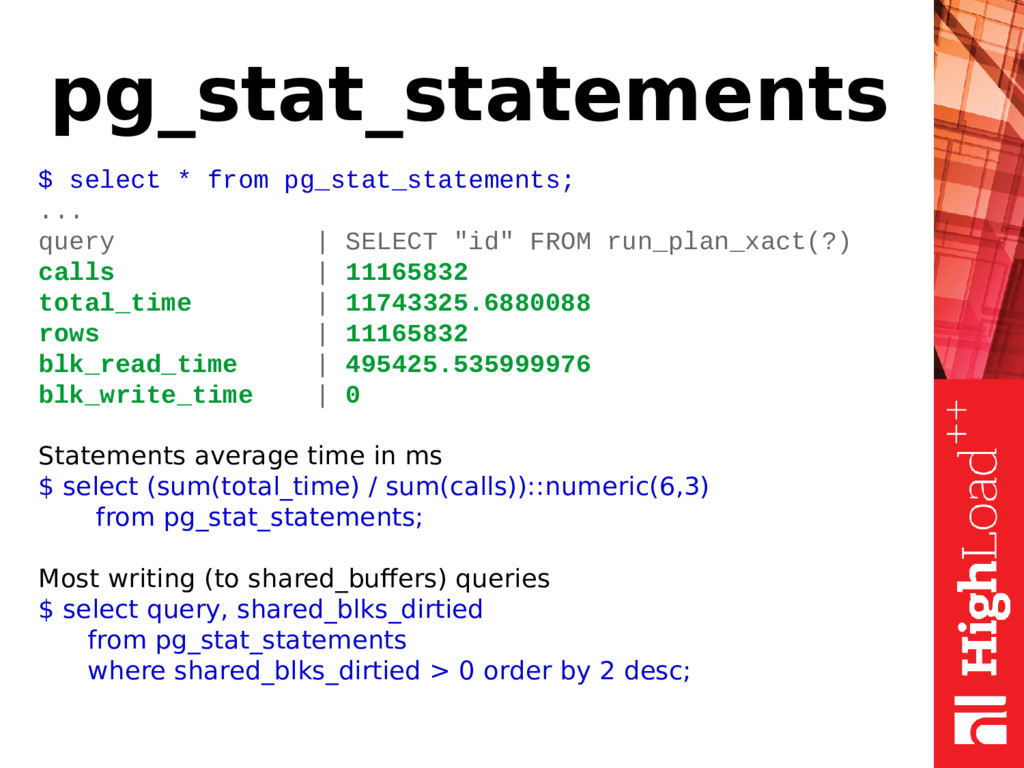
"id" FROM run_plan_xact(?) calls | 11165832 total_time | 11743325.6880088 rows | 11165832 blk_read_time | 495425.535999976 blk_write_time | 0 Statements average time in ms $ select (sum(total_time) / sum(calls))::numeric(6,3) from pg_stat_statements; Most writing (to shared_buffers) queries $ select query, shared_blks_dirtied from pg_stat_statements where shared_blks_dirtied > 0 order by 2 desc;
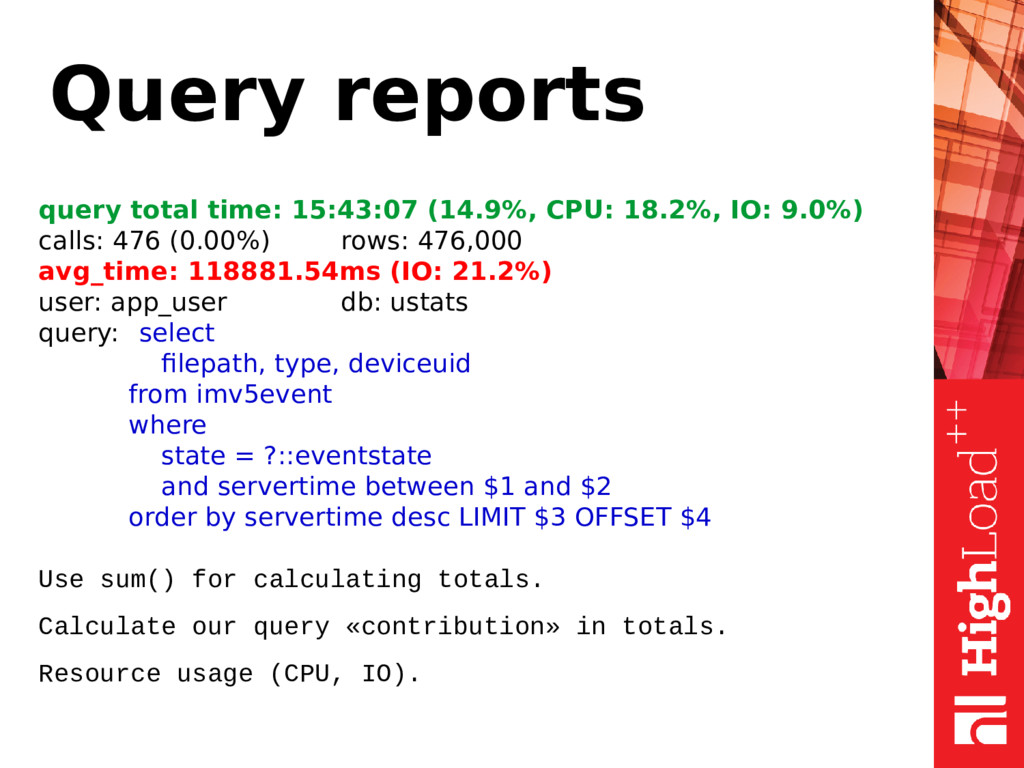
9.0%) сalls: 476 (0.00%) rows: 476,000 avg_time: 118881.54ms (IO: 21.2%) user: app_user db: ustats query: select filepath, type, deviceuid from imv5event where state = ?::eventstate and servertime between $1 and $2 order by servertime desc LIMIT $3 OFFSET $4
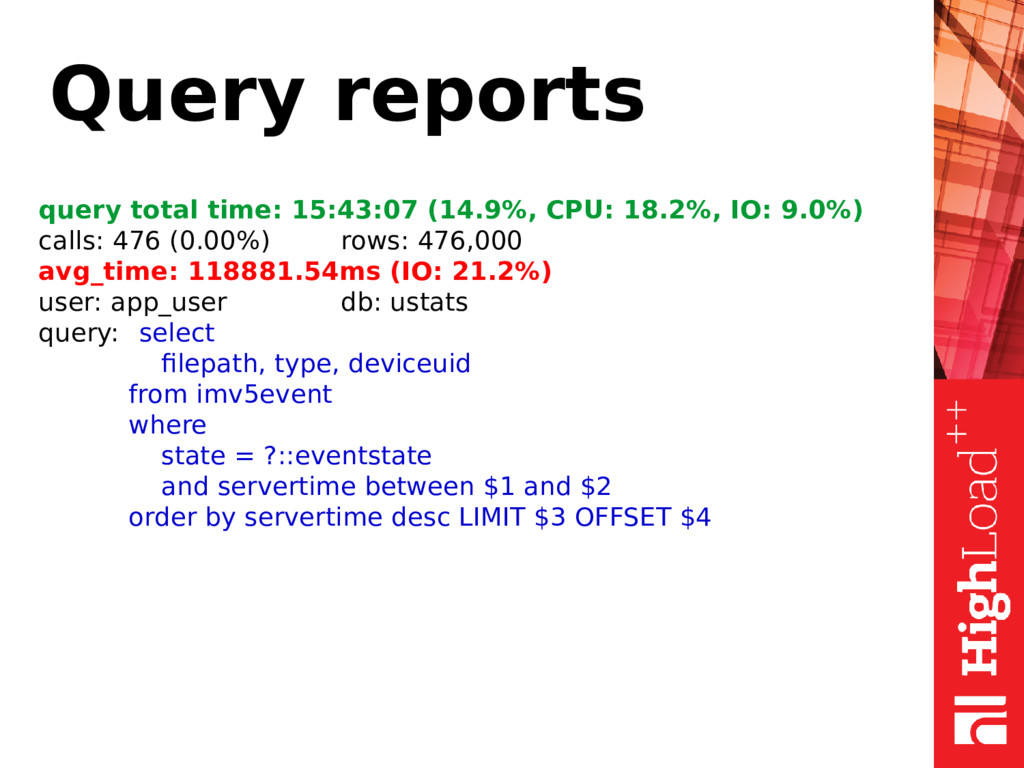
9.0%) сalls: 476 (0.00%) rows: 476,000 avg_time: 118881.54ms (IO: 21.2%) user: app_user db: ustats query: select filepath, type, deviceuid from imv5event where state = ?::eventstate and servertime between $1 and $2 order by servertime desc LIMIT $3 OFFSET $4 Use sum() for calculating totals. Calculate our query «contribution» in totals. Resource usage (CPU, IO).
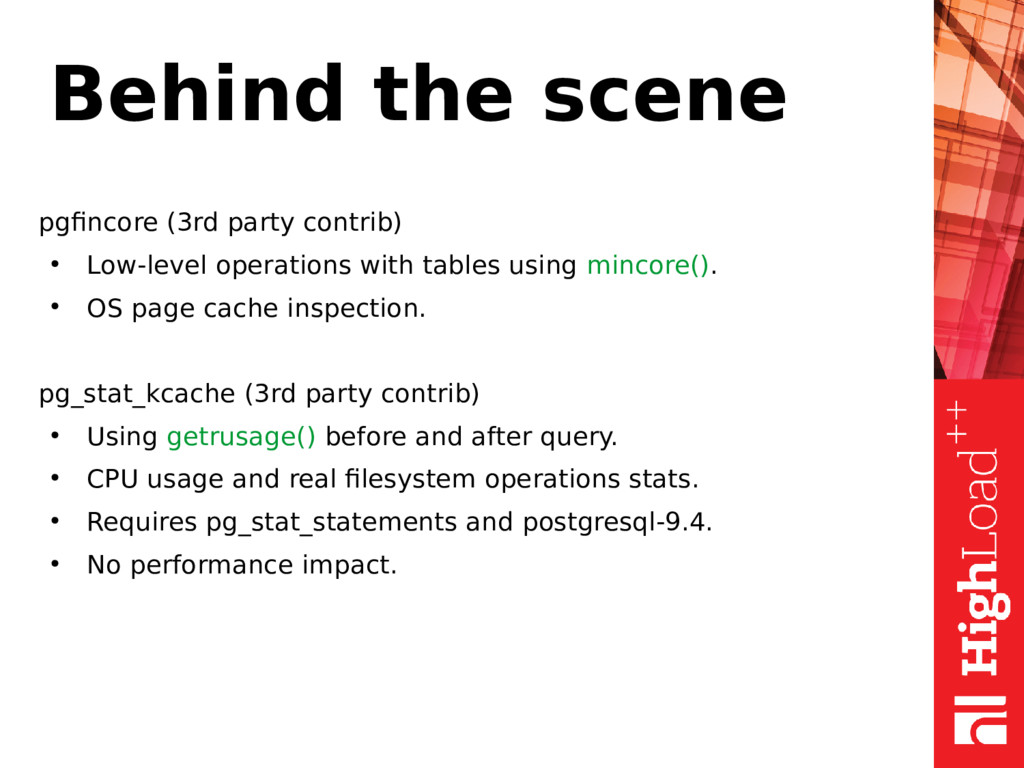
with tables using mincore(). • OS page cache inspection. pg_stat_kcache (3rd party contrib) • Using getrusage() before and after query. • CPU usage and real filesystem operations stats. • Requires pg_stat_statements and postgresql-9.4. • No performance impact.
![pg_stat_bgwriter $ select * from pg_stat_bgwriter; -[ RECORD 1 ]---------+------------------------------------](https://files.speakerdeck.com/presentations/53ace298a5f64f249799b21024b0fe67/slide_16.jpg)
![pg_stat_replication $ select * from pg_stat_replication; -[ RECORD 1 ]----+------------------------------------](https://files.speakerdeck.com/presentations/53ace298a5f64f249799b21024b0fe67/slide_19.jpg)
![pg_stat_all_tables $ select * from pg_stat_all_tables; -[ RECORD 1 ]-------+------------------------------------](https://files.speakerdeck.com/presentations/53ace298a5f64f249799b21024b0fe67/slide_22.jpg)
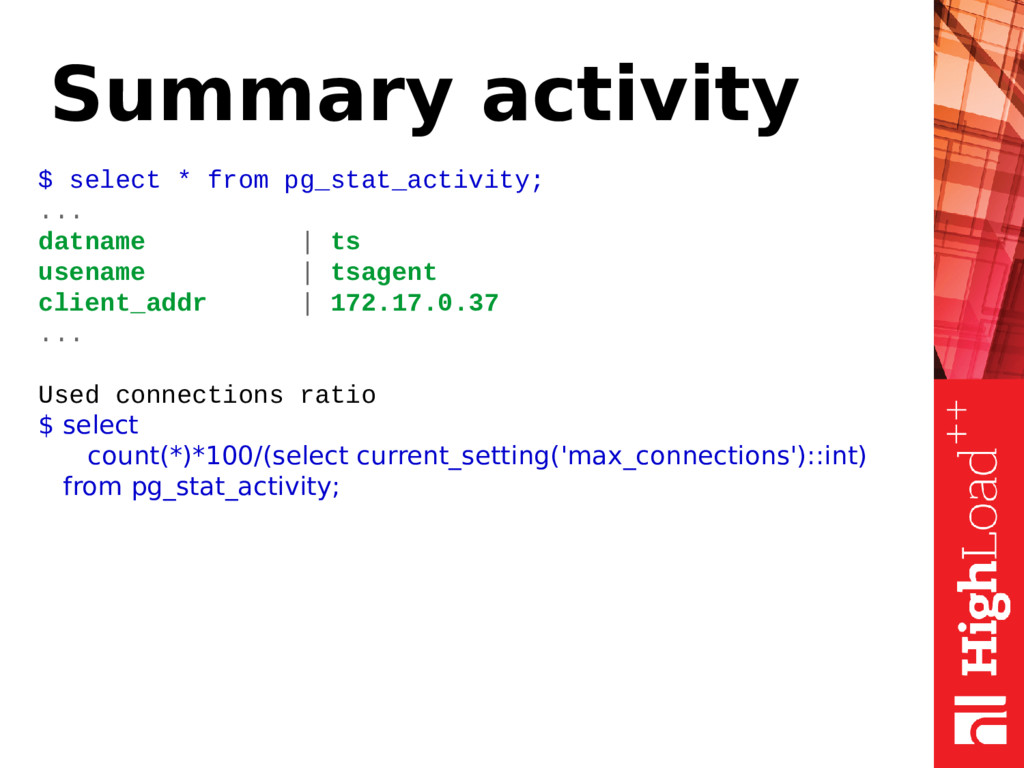
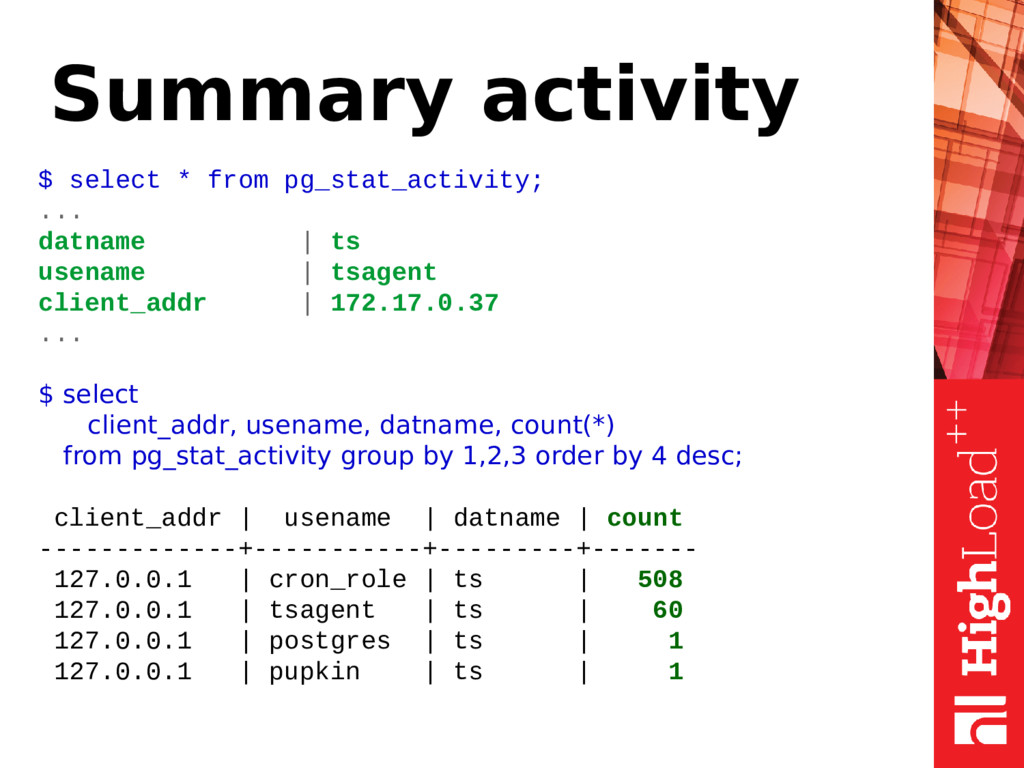
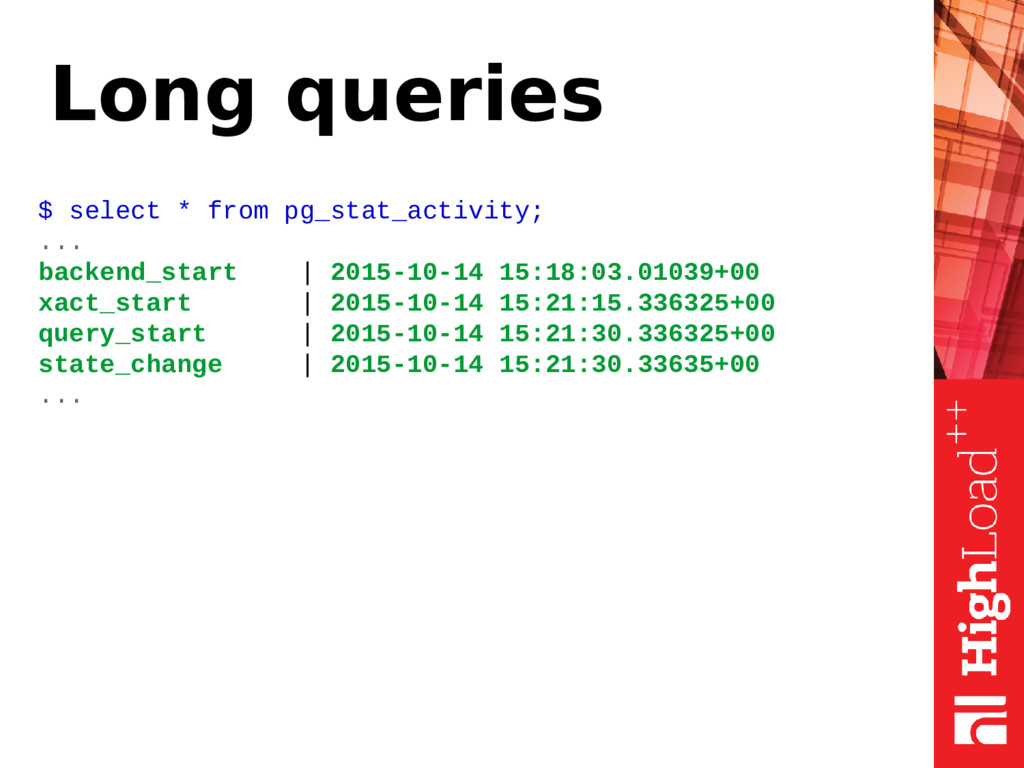
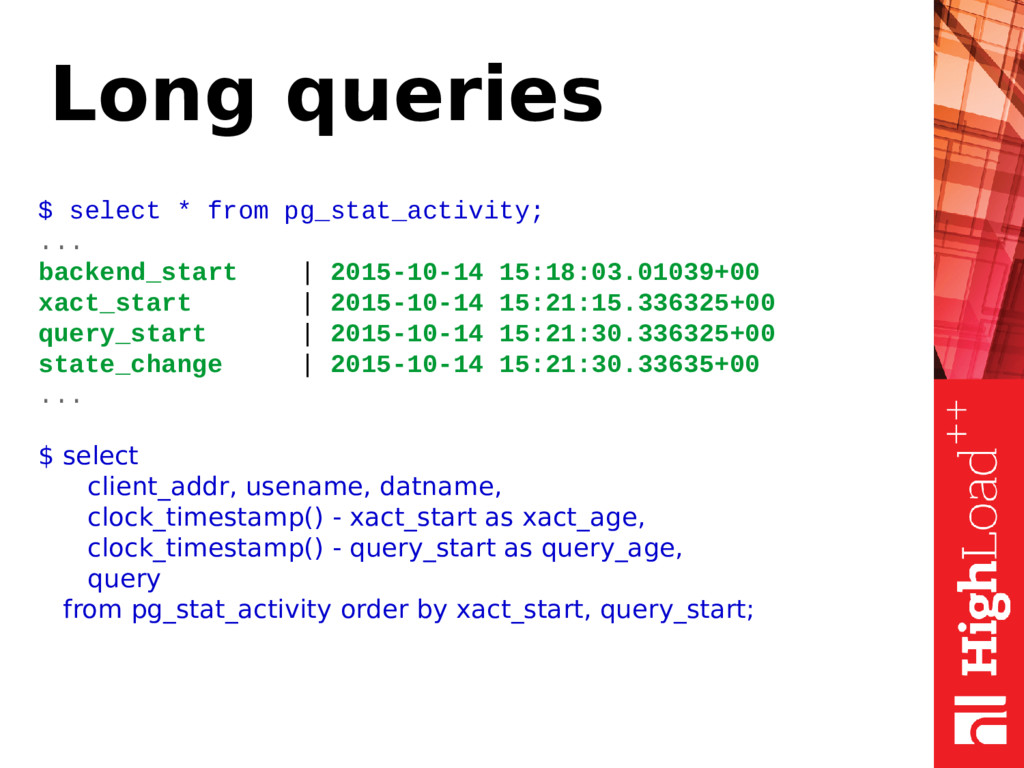
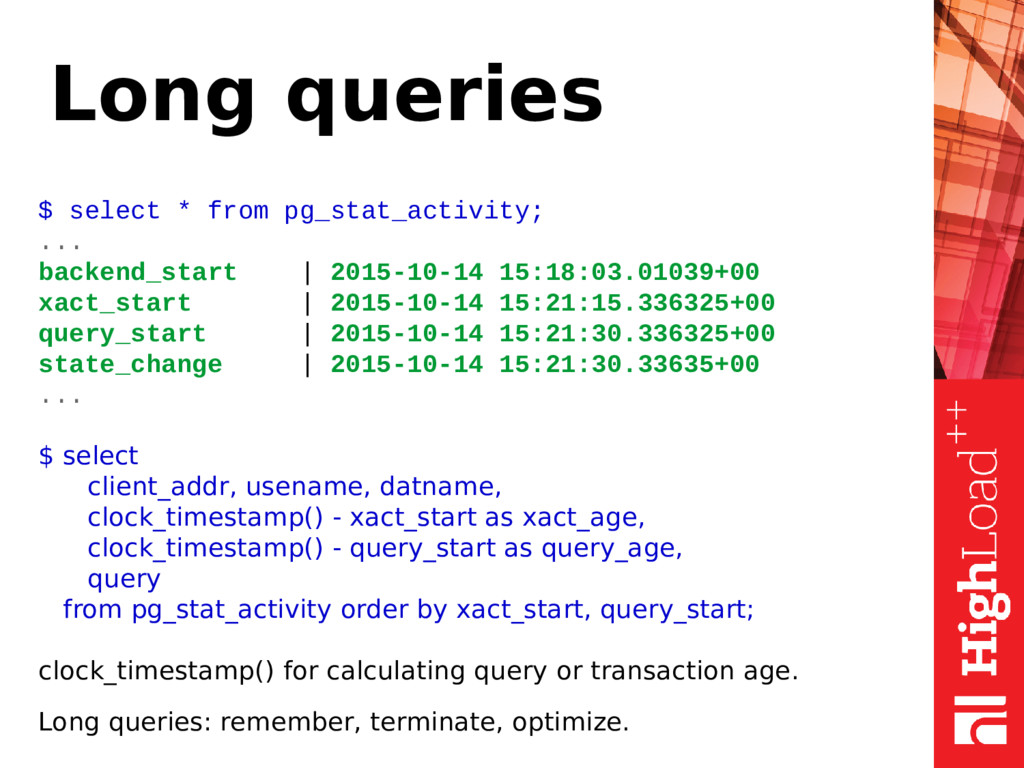
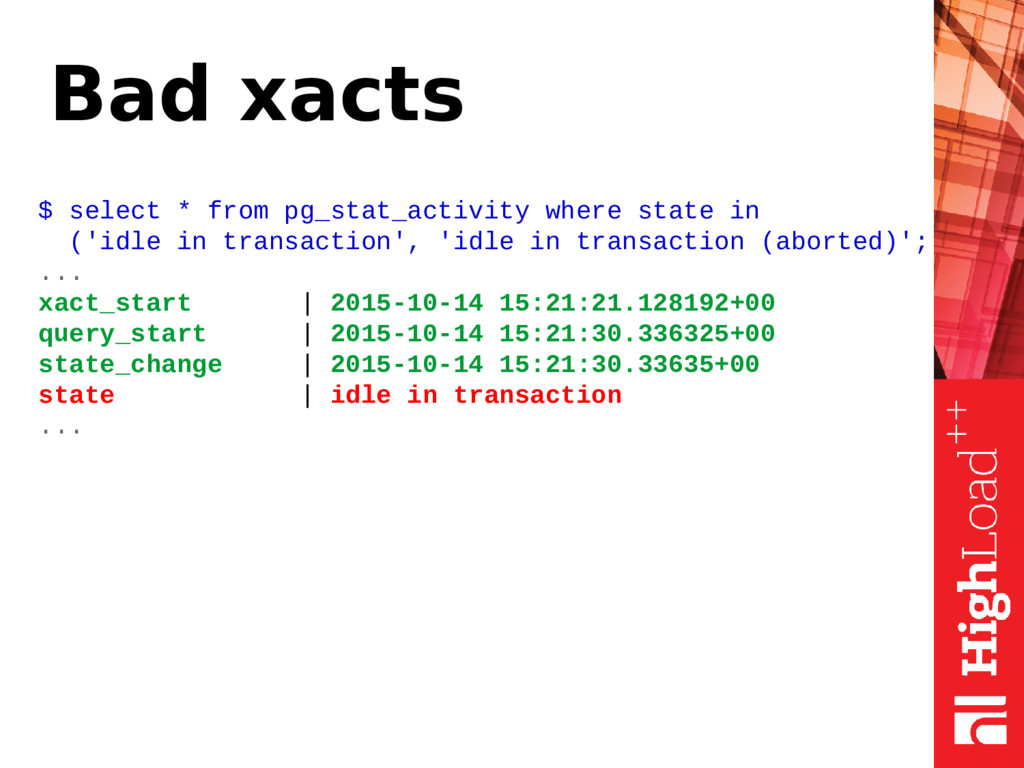
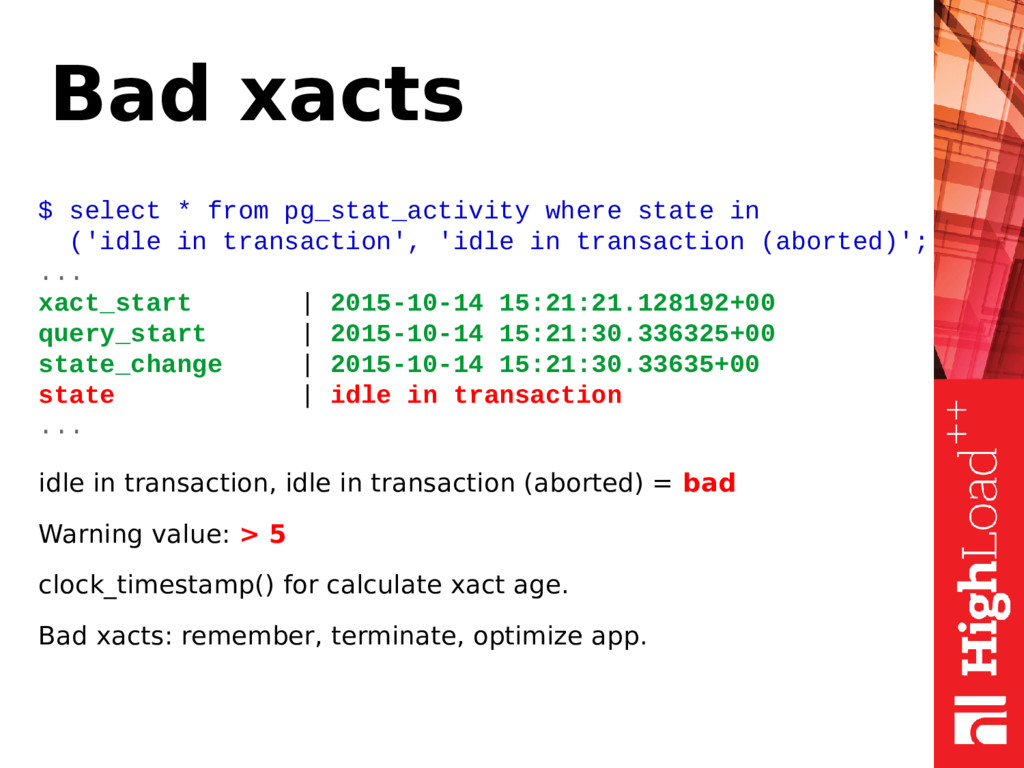
![pg_stat_activity $ select * from pg_stat_activity; -[ RECORD 1 ]----+--------------------------------------------](https://files.speakerdeck.com/presentations/53ace298a5f64f249799b21024b0fe67/slide_33.jpg)