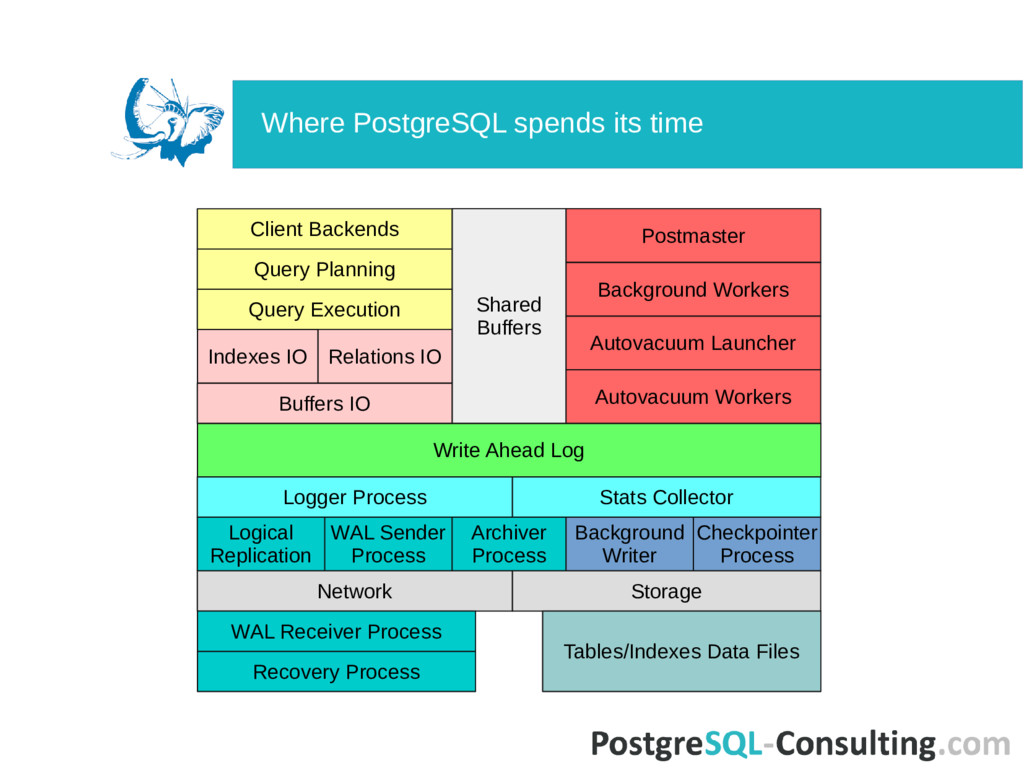
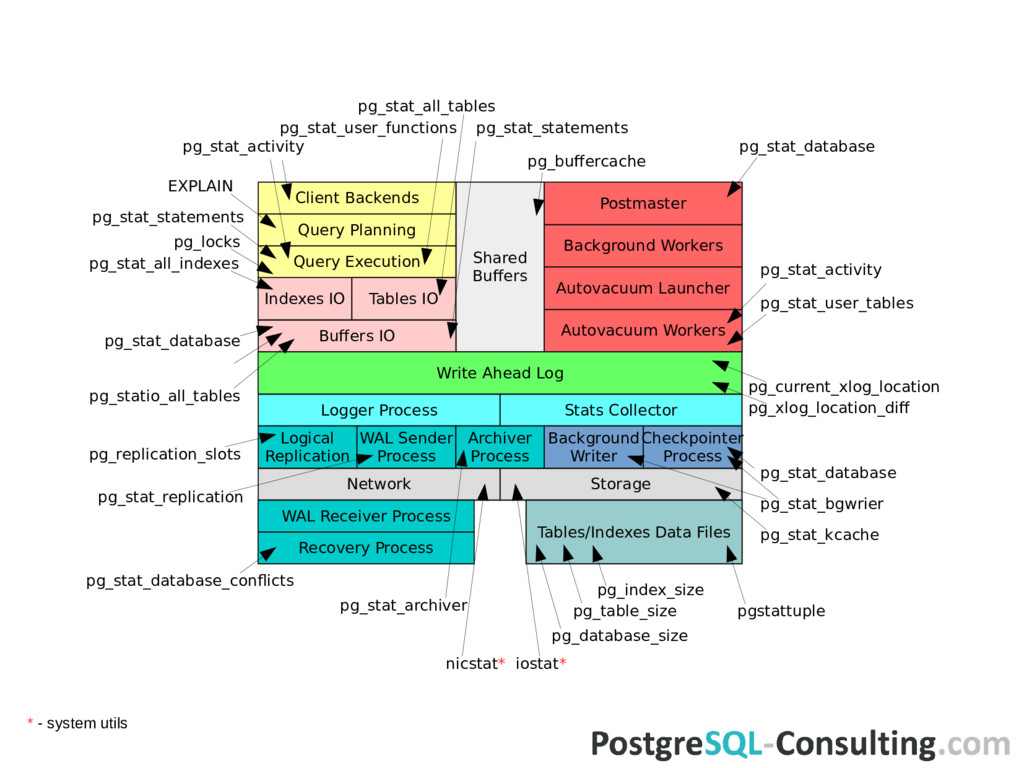
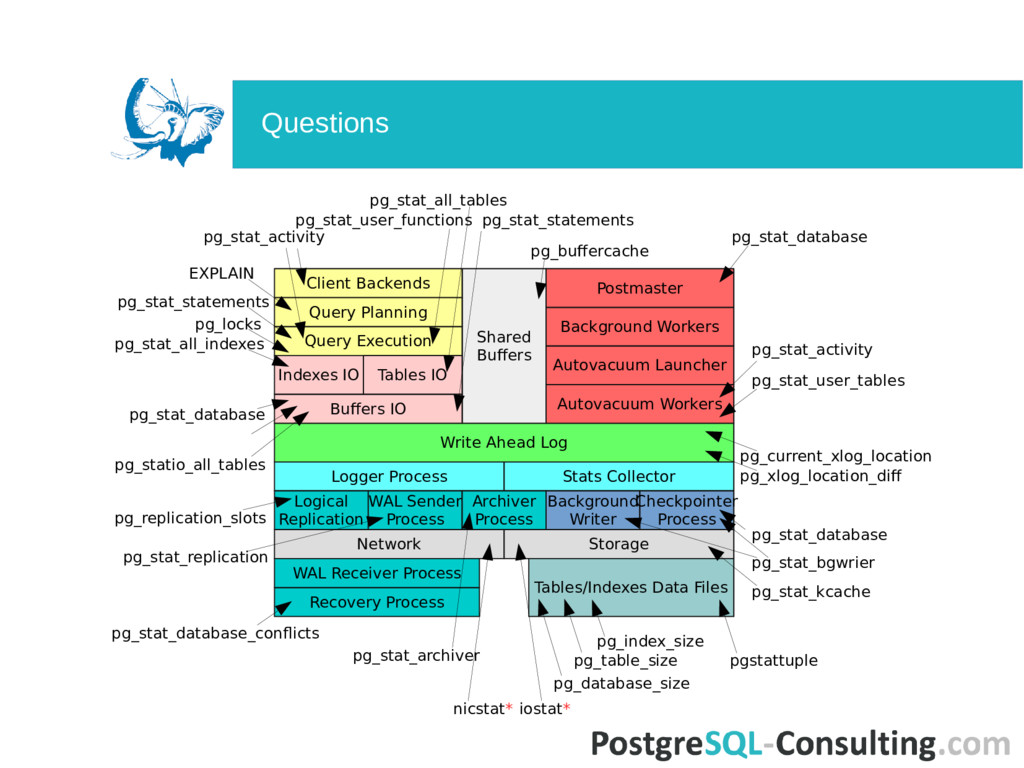
Launcher Background Workers Indexes IO Query Execution Query Planning Client Backends Postmaster Relations IO Logger Process Stats Collector Logical Replication WAL Sender Process Archiver Process Background Writer Checkpointer Process Network Storage Recovery Process WAL Receiver Process Tables/Indexes Data Files Where PostgreSQL spends its time
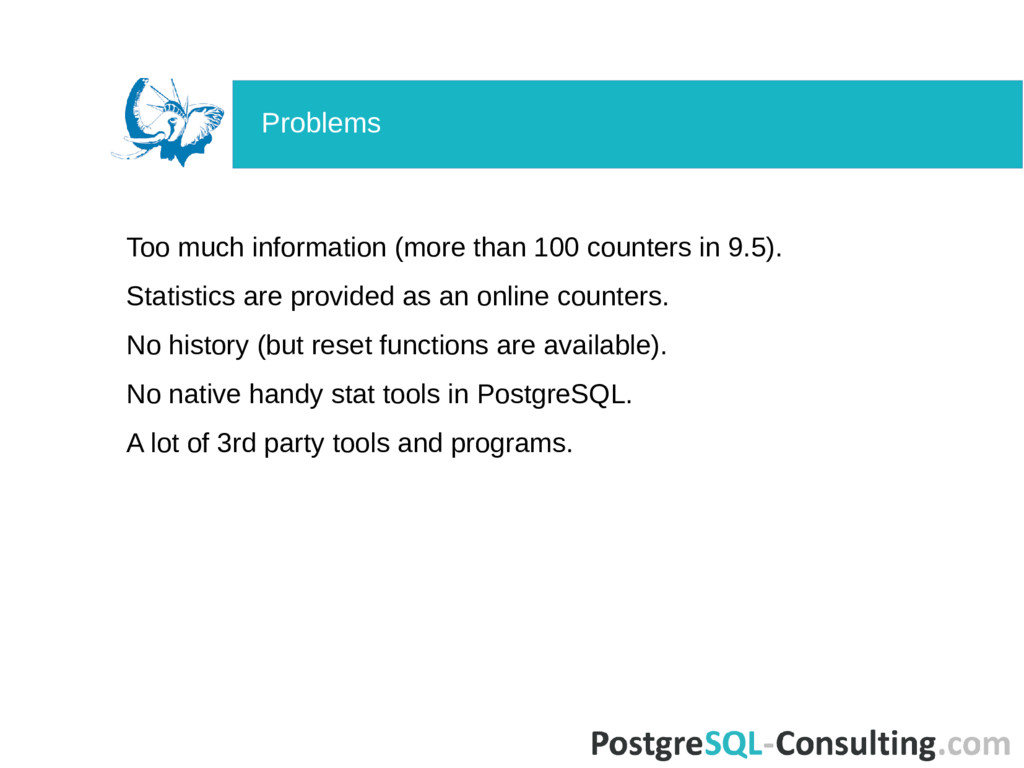
are provided as an online counters. No history (but reset functions are available). No native handy stat tools in PostgreSQL. A lot of 3rd party tools and programs. Problems
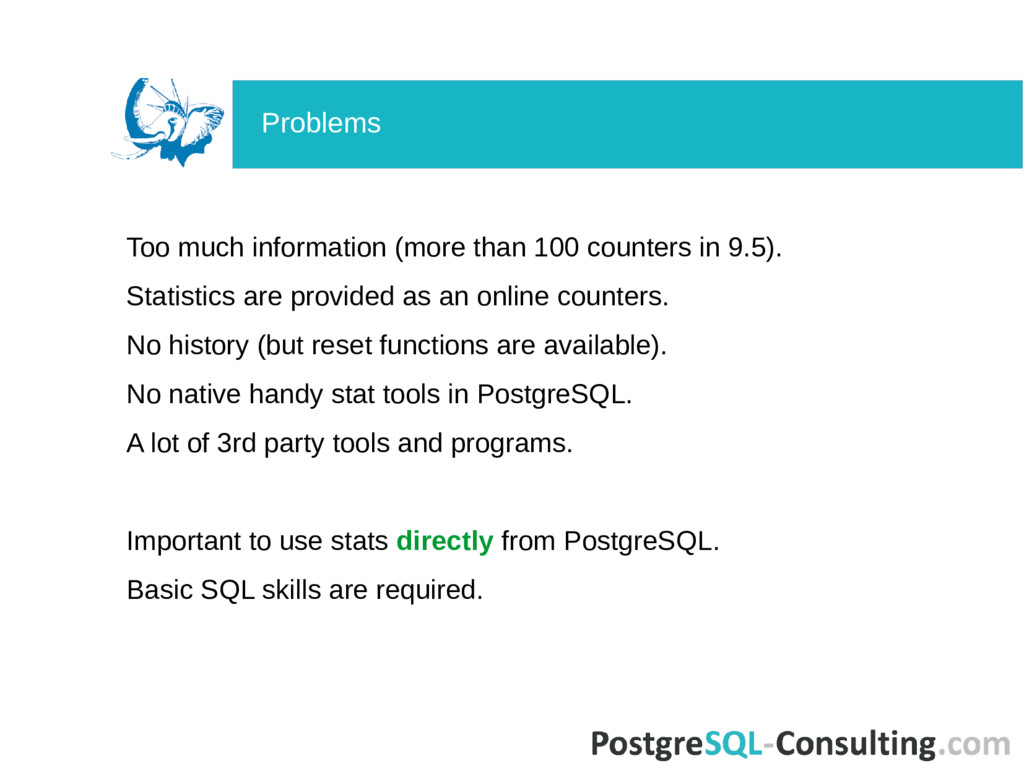
are provided as an online counters. No history (but reset functions are available). No native handy stat tools in PostgreSQL. A lot of 3rd party tools and programs. Important to use stats directly from PostgreSQL. Basic SQL skills are required. Problems
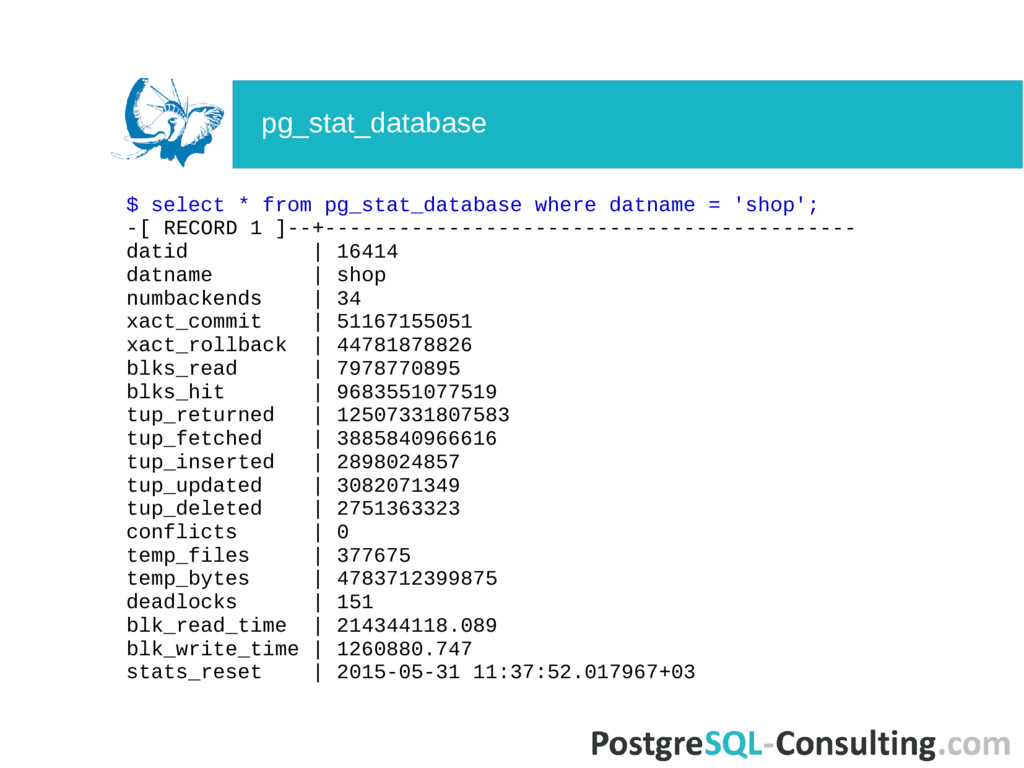
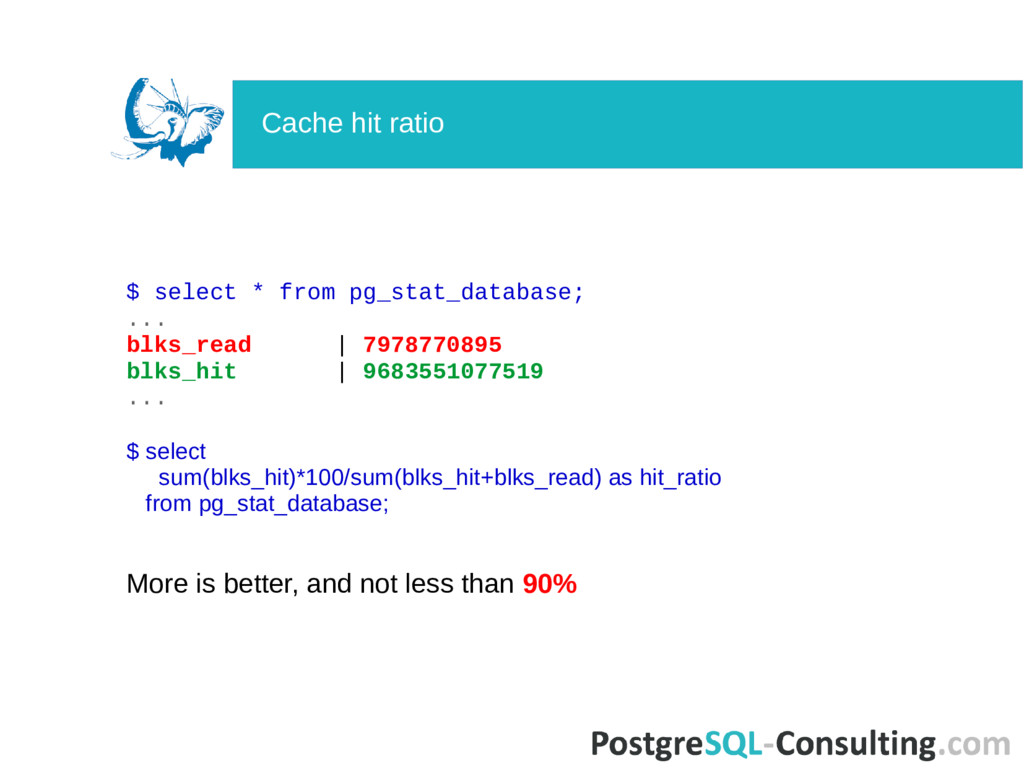
| 9683551077519 ... $ select sum(blks_hit)*100/sum(blks_hit+blks_read) as hit_ratio from pg_stat_database; More is better, and not less than 90% Cache hit ratio
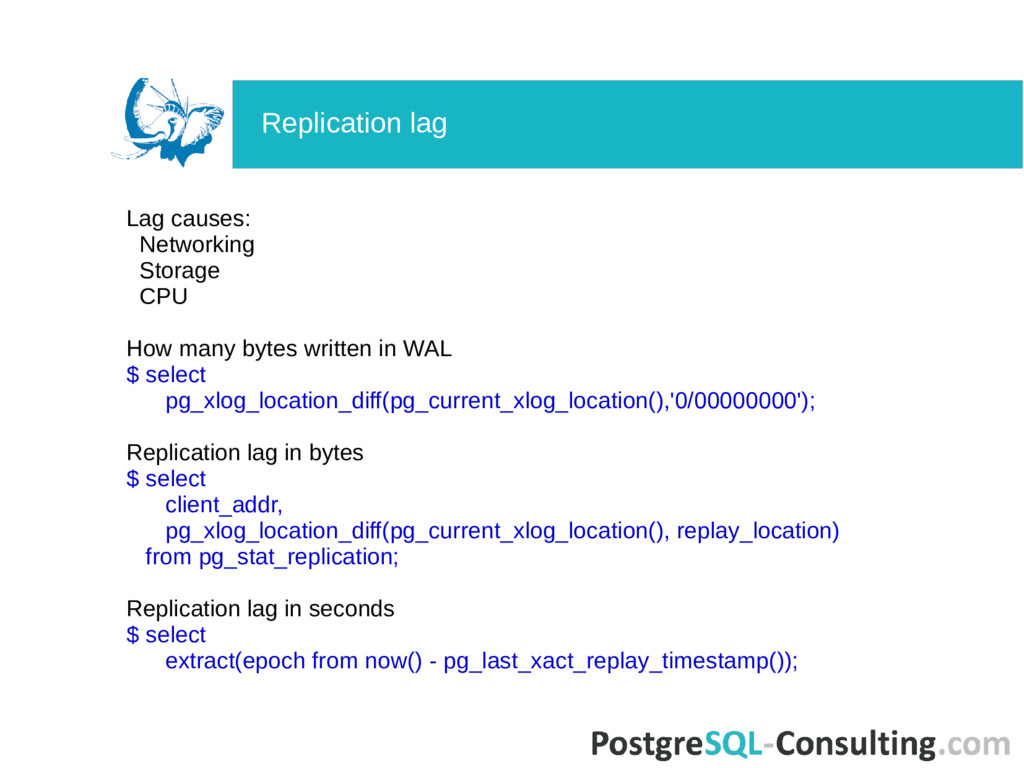
WAL $ select pg_xlog_location_diff(pg_current_xlog_location(),'0/00000000'); Replication lag in bytes $ select client_addr, pg_xlog_location_diff(pg_current_xlog_location(), replay_location) from pg_stat_replication; Replication lag in seconds $ select extract(epoch from now() - pg_last_xact_replay_timestamp()); Replication lag
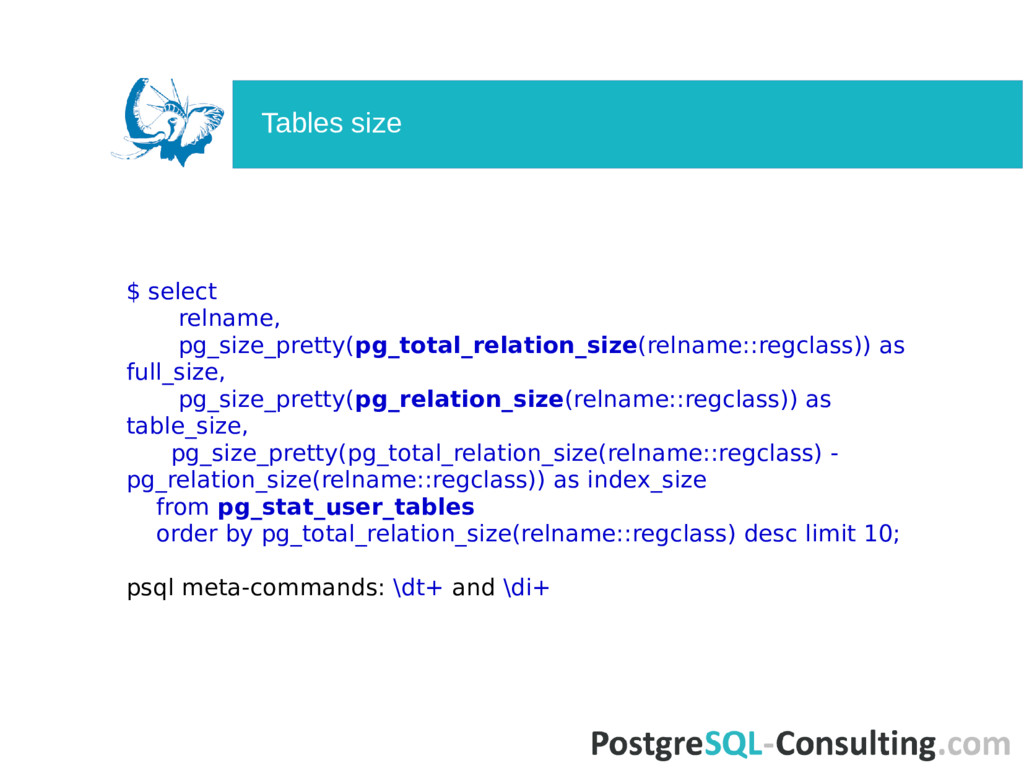
- pg_relation_size(relname::regclass)) as index_size from pg_stat_user_tables order by pg_total_relation_size(relname::regclass) desc limit 10; psql meta-commands: \dt+ and \di+ Tables size
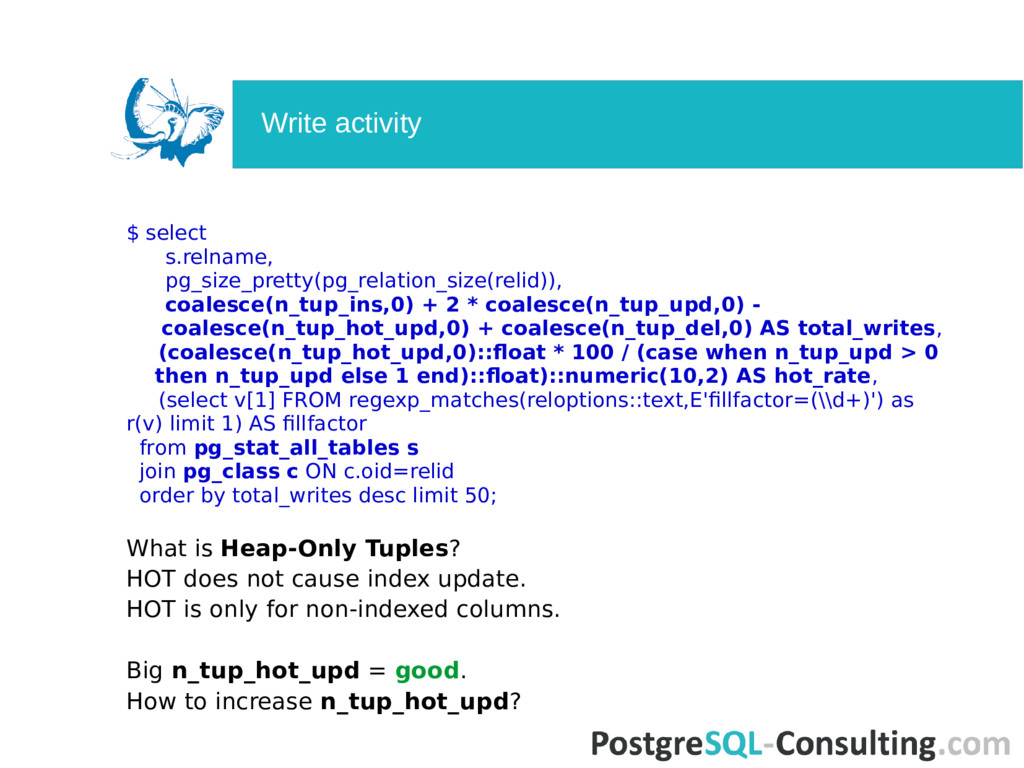
coalesce(n_tup_hot_upd,0) + coalesce(n_tup_del,0) AS total_writes, (coalesce(n_tup_hot_upd,0)::float * 100 / (case when n_tup_upd > 0 then n_tup_upd else 1 end)::float)::numeric(10,2) AS hot_rate, (select v[1] FROM regexp_matches(reloptions::text,E'fillfactor=(\\d+)') as r(v) limit 1) AS fillfactor from pg_stat_all_tables s join pg_class c ON c.oid=relid order by total_writes desc limit 50; What is Heap-Only Tuples? HOT does not cause index update. HOT is only for non-indexed columns. Big n_tup_hot_upd = good. How to increase n_tup_hot_upd? Write activity
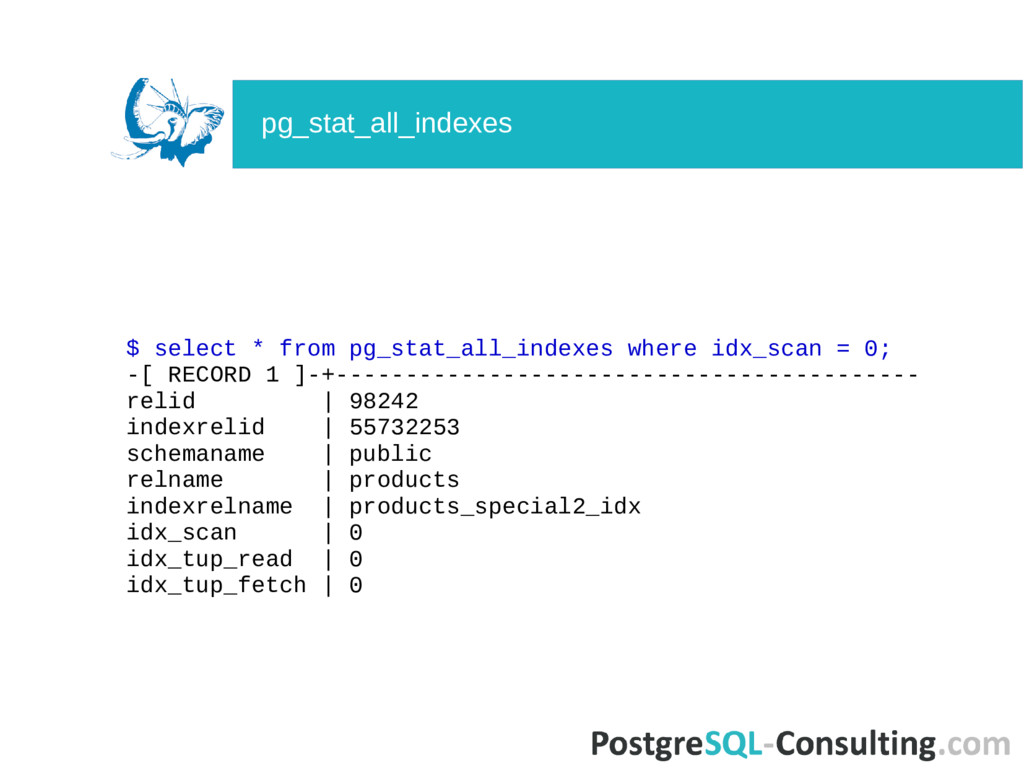
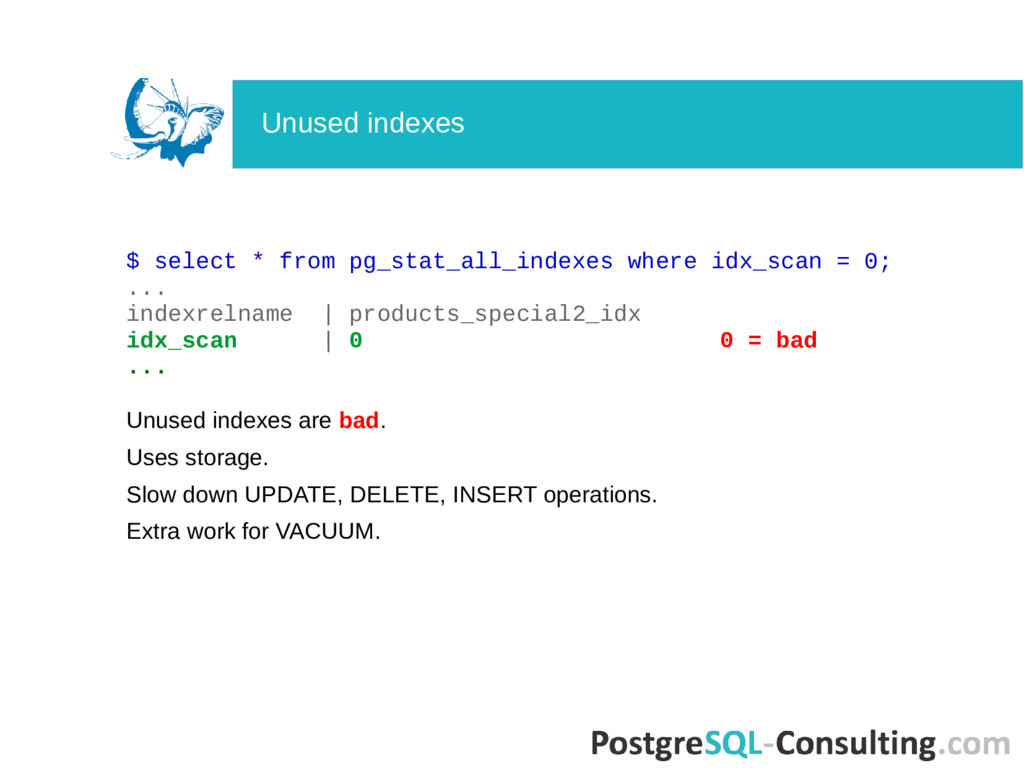
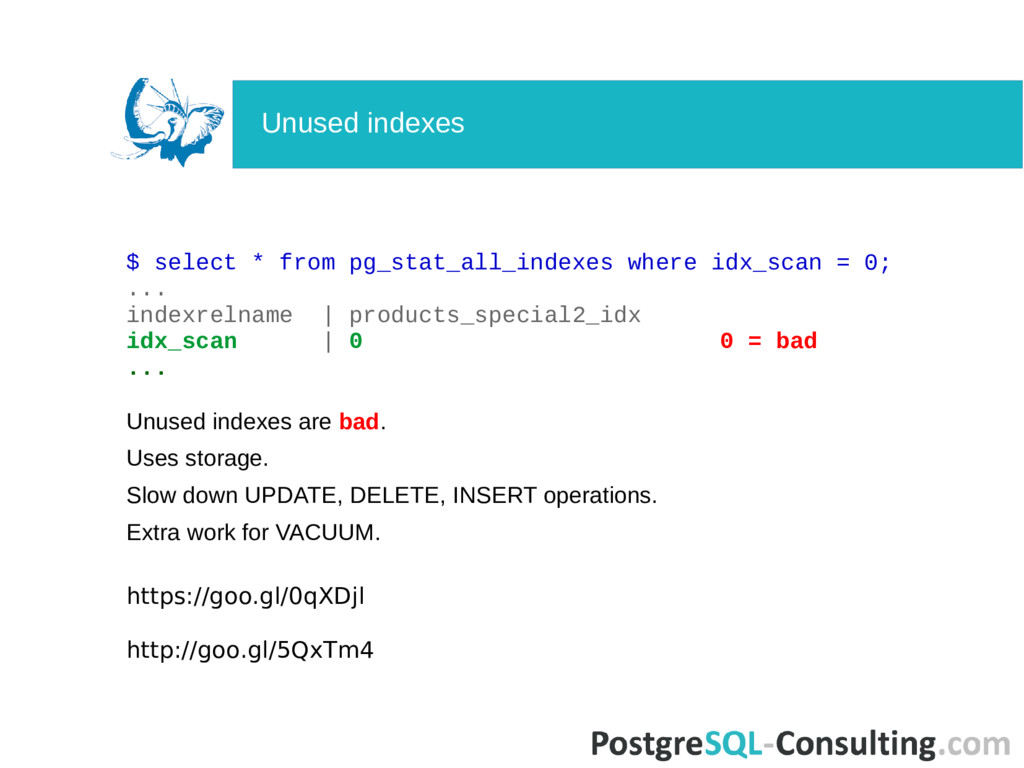
indexrelname | products_special2_idx idx_scan | 0 0 = bad ... Unused indexes are bad. Uses storage. Slow down UPDATE, DELETE, INSERT operations. Extra work for VACUUM. Unused indexes
indexrelname | products_special2_idx idx_scan | 0 0 = bad ... Unused indexes are bad. Uses storage. Slow down UPDATE, DELETE, INSERT operations. Extra work for VACUUM. https://goo.gl/0qXDjl http://goo.gl/5QxTm4 Unused indexes
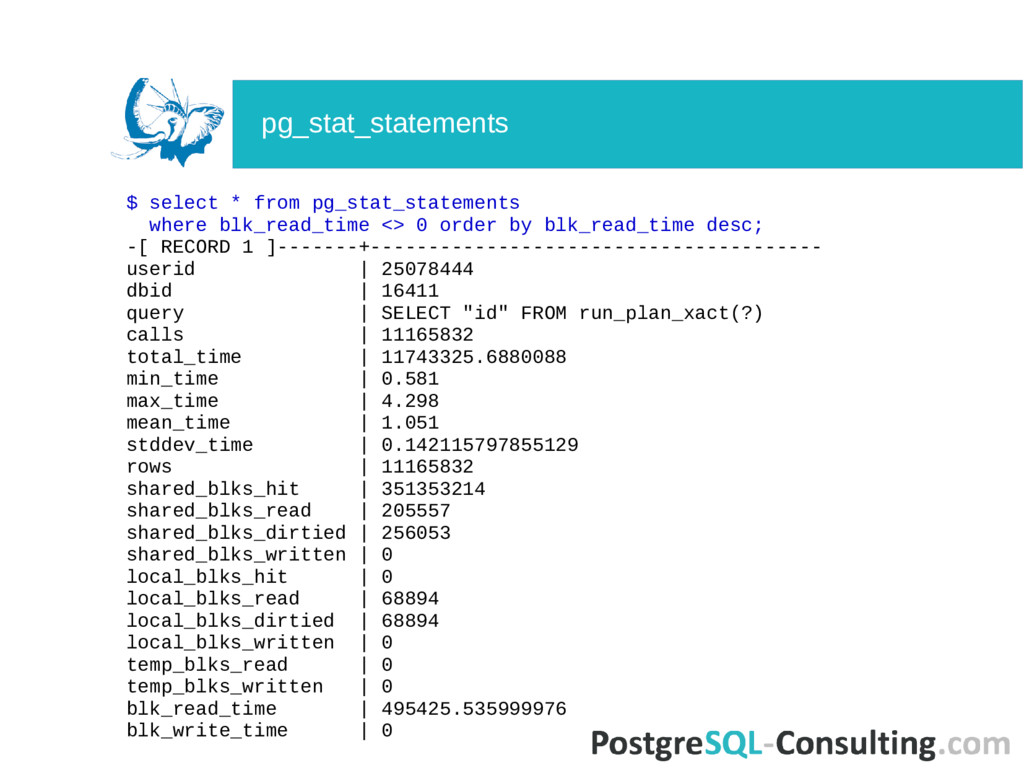
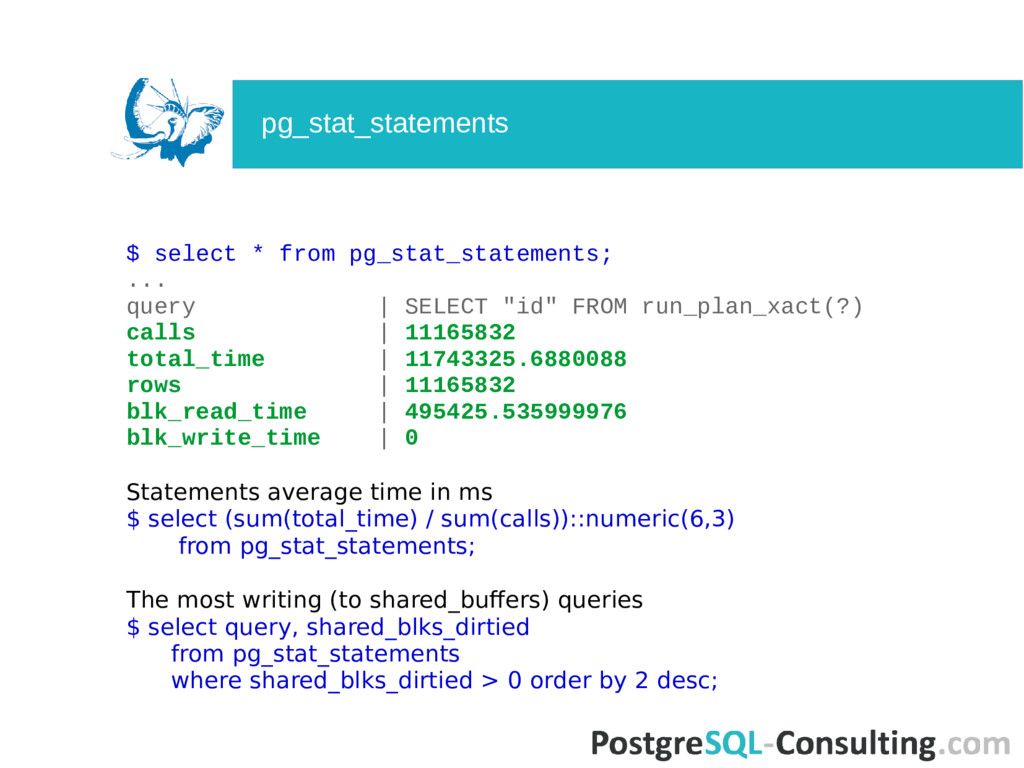
FROM run_plan_xact(?) calls | 11165832 total_time | 11743325.6880088 rows | 11165832 blk_read_time | 495425.535999976 blk_write_time | 0 Statements average time in ms $ select (sum(total_time) / sum(calls))::numeric(6,3) from pg_stat_statements; The most writing (to shared_buffers) queries $ select query, shared_blks_dirtied from pg_stat_statements where shared_blks_dirtied > 0 order by 2 desc; pg_stat_statements
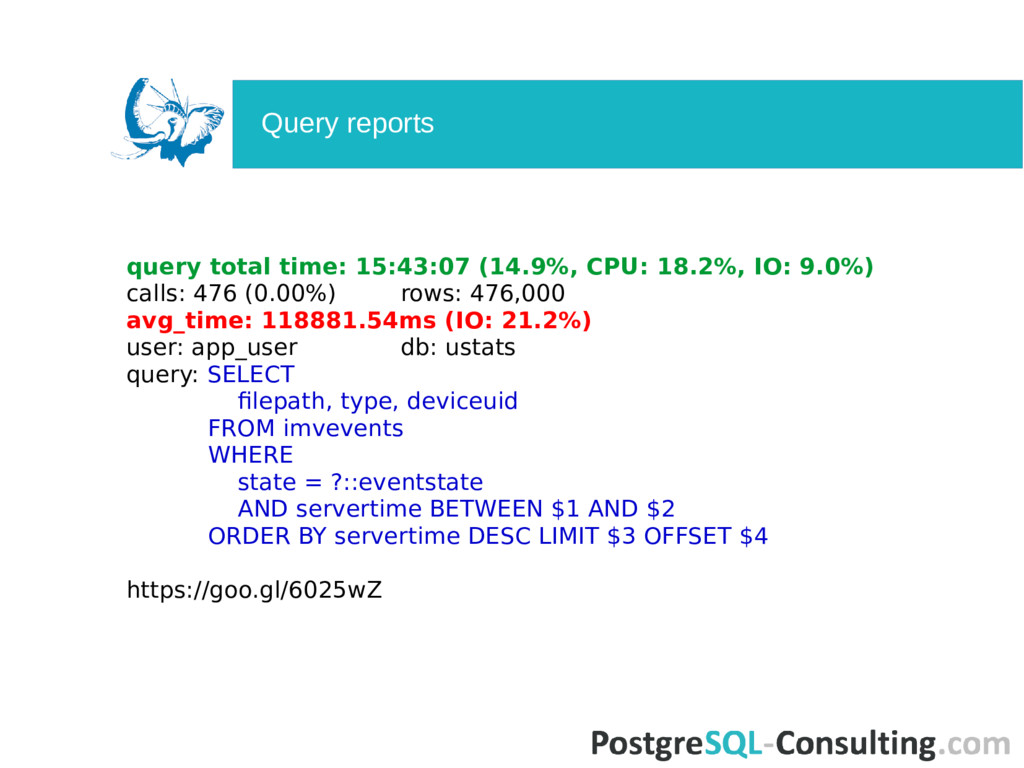
476 (0.00%) rows: 476,000 avg_time: 118881.54ms (IO: 21.2%) user: app_user db: ustats query: SELECT filepath, type, deviceuid FROM imvevents WHERE state = ?::eventstate AND servertime BETWEEN $1 AND $2 ORDER BY servertime DESC LIMIT $3 OFFSET $4 https://goo.gl/6025wZ Query reports
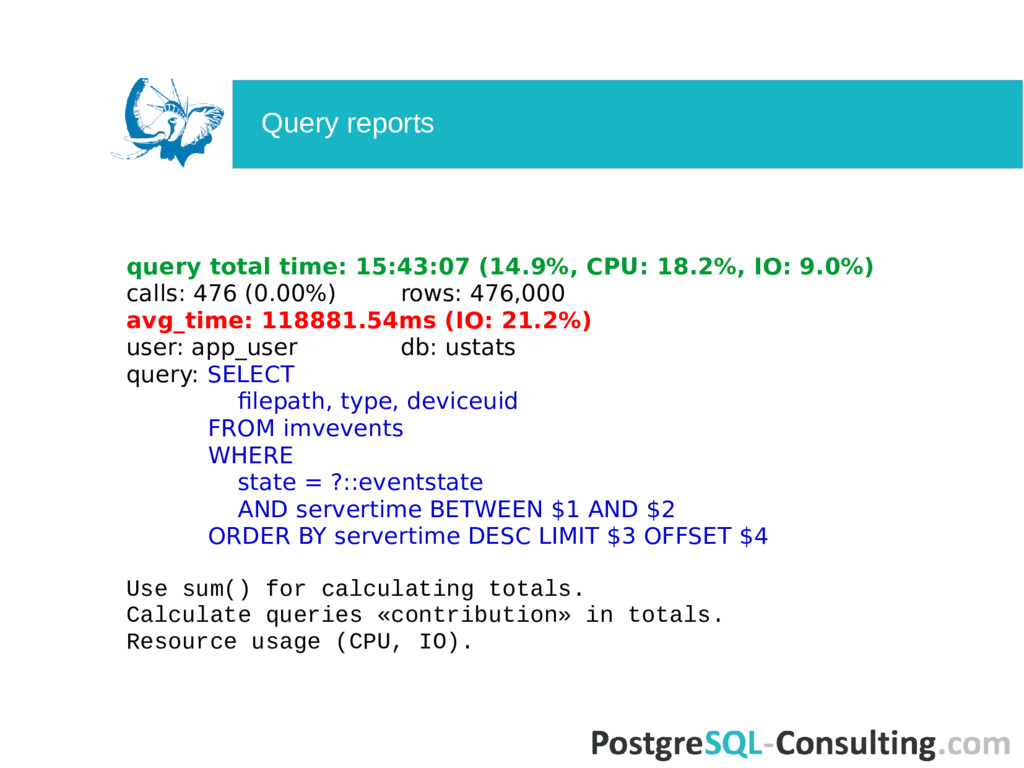
476 (0.00%) rows: 476,000 avg_time: 118881.54ms (IO: 21.2%) user: app_user db: ustats query: SELECT filepath, type, deviceuid FROM imvevents WHERE state = ?::eventstate AND servertime BETWEEN $1 AND $2 ORDER BY servertime DESC LIMIT $3 OFFSET $4 Use sum() for calculating totals. Calculate queries «contribution» in totals. Resource usage (CPU, IO). Query reports
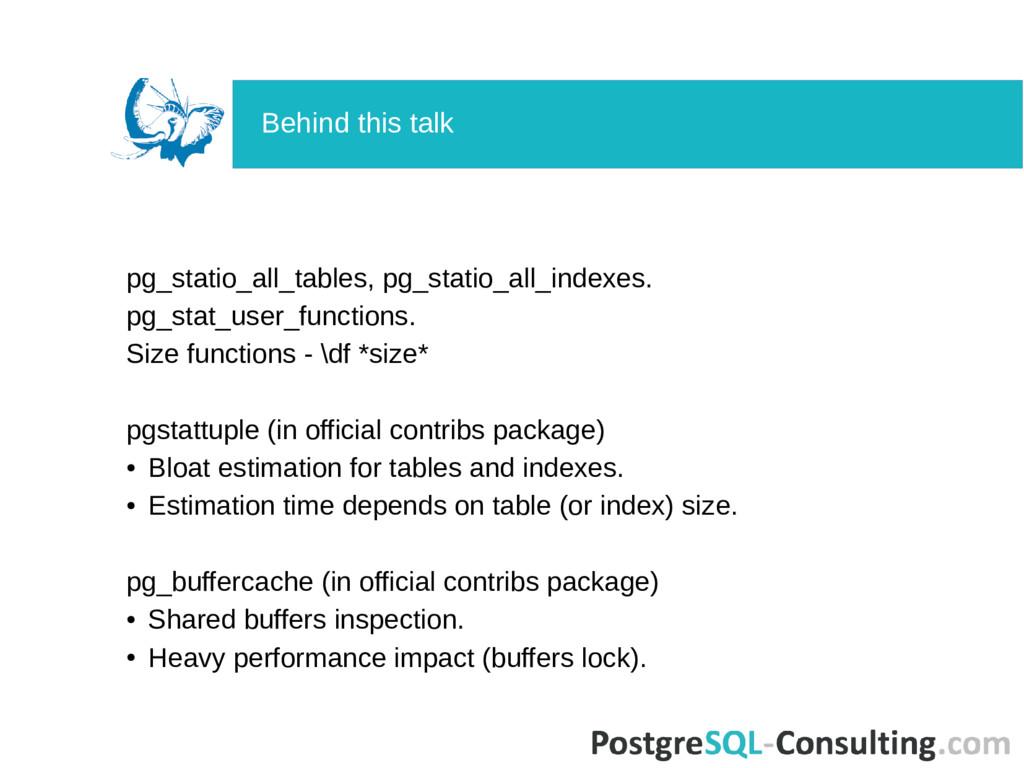
official contribs package) • Bloat estimation for tables and indexes. • Estimation time depends on table (or index) size. pg_buffercache (in official contribs package) • Shared buffers inspection. • Heavy performance impact (buffers lock). Behind this talk
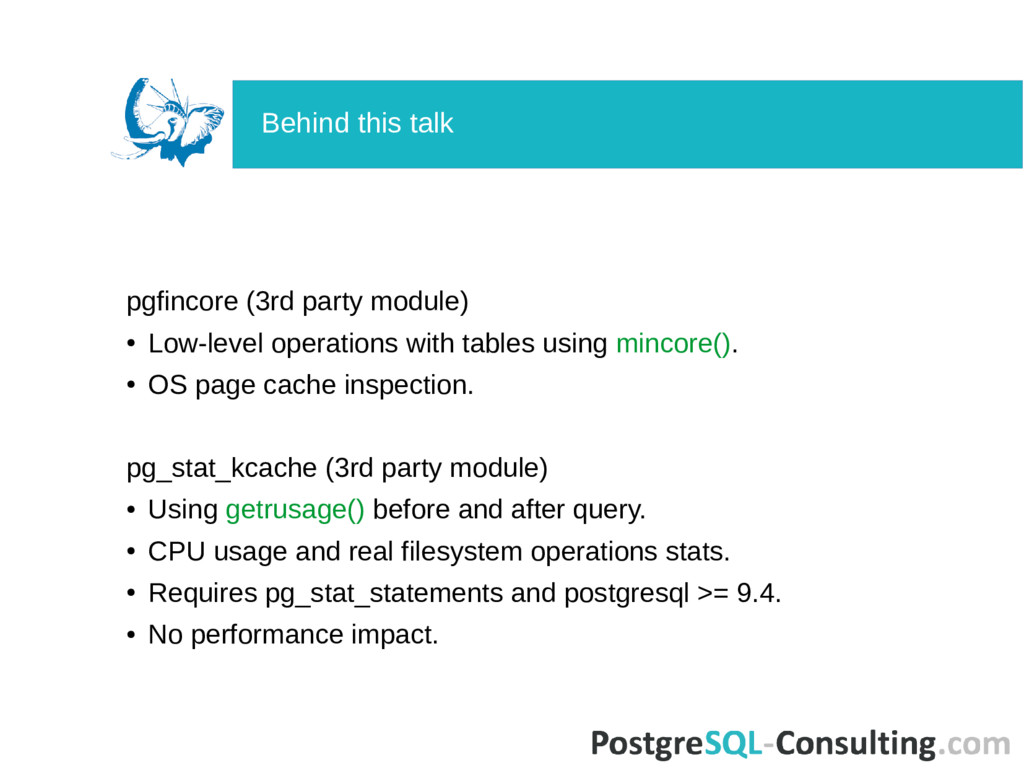
mincore(). • OS page cache inspection. pg_stat_kcache (3rd party module) • Using getrusage() before and after query. • CPU usage and real filesystem operations stats. • Requires pg_stat_statements and postgresql >= 9.4. • No performance impact. Behind this talk
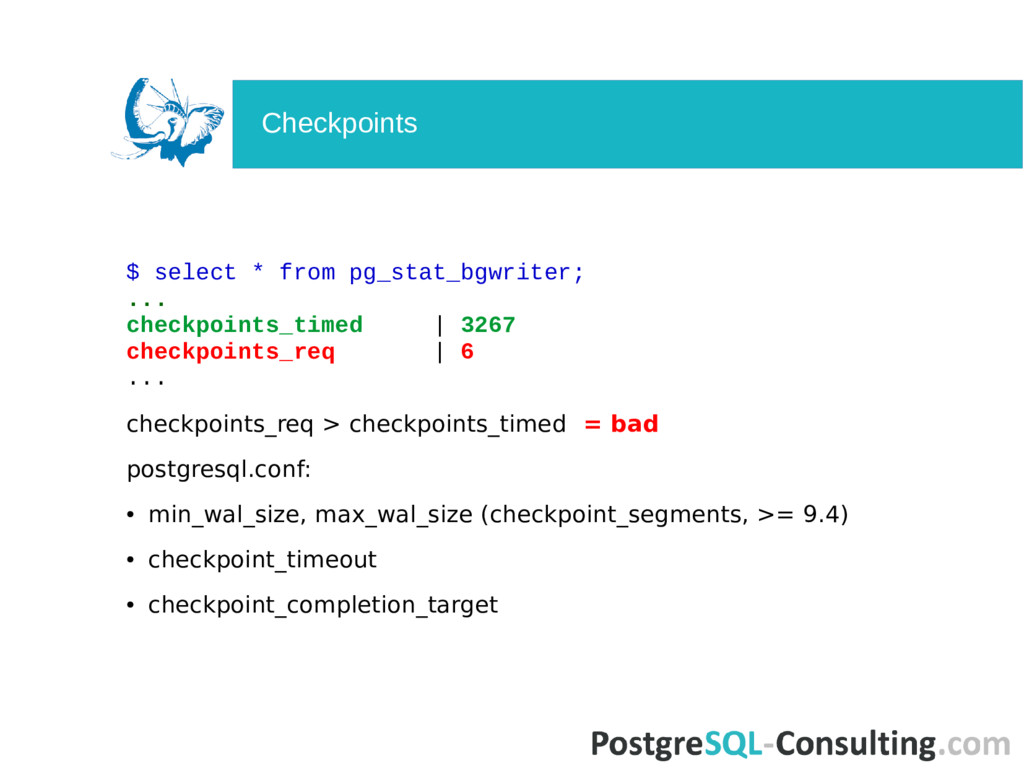
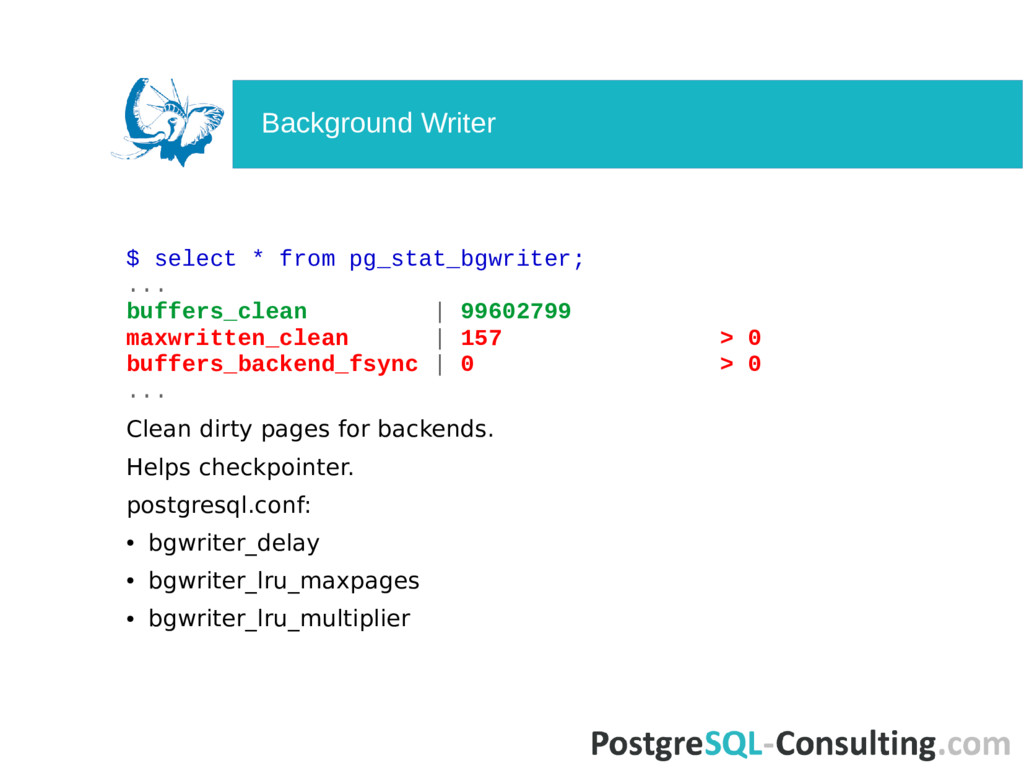
![$ select * from pg_stat_bgwriter; -[ RECORD 1 ]---------+------------------------------------ checkpoints_timed](https://files.speakerdeck.com/presentations/6d43d0083a694bcca5d595c27550b776/slide_16.jpg)
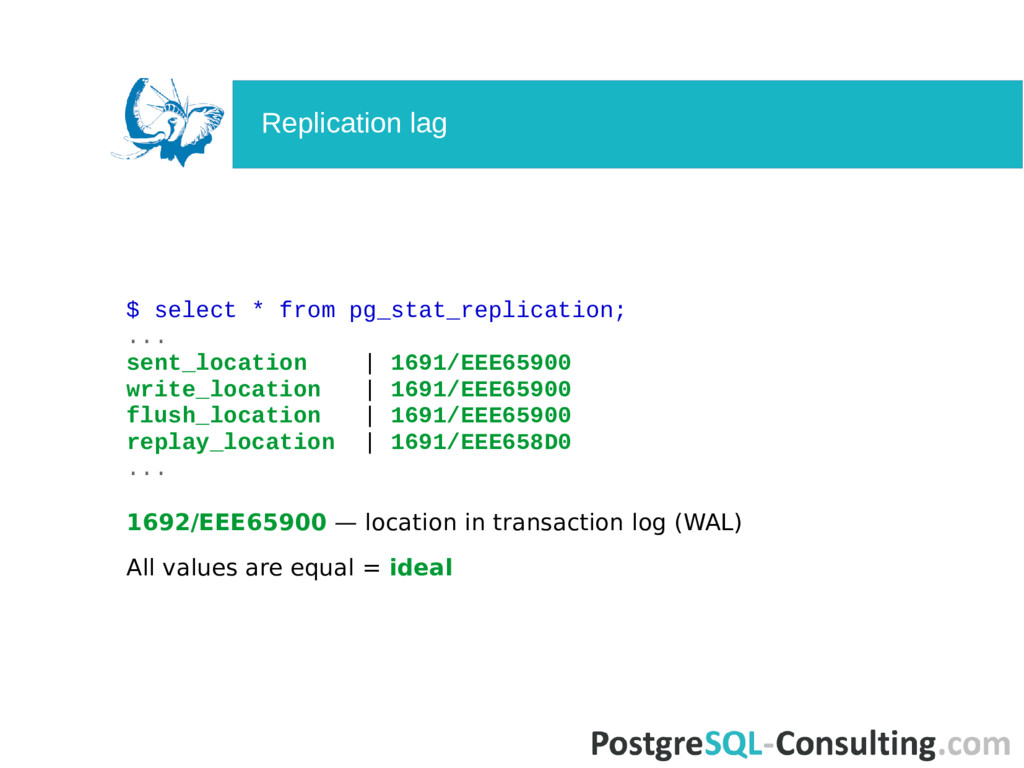
![$ select * from pg_stat_replication; -[ RECORD 1 ]----+------------------------------------ pid](https://files.speakerdeck.com/presentations/6d43d0083a694bcca5d595c27550b776/slide_19.jpg)
![$ select * from pg_stat_all_tables; -[ RECORD 1 ]-------+------------------------------------ relid](https://files.speakerdeck.com/presentations/6d43d0083a694bcca5d595c27550b776/slide_23.jpg)
![$ select * from pg_stat_activity; -[ RECORD 1 ]----+-------------------------------------------- datid](https://files.speakerdeck.com/presentations/6d43d0083a694bcca5d595c27550b776/slide_34.jpg)