Upgrade to Pro
— share decks privately, control downloads, hide ads and more …
Speaker Deck
Sign up for free
Menu
Search
Features
All features
Private URLs
Password Protection
Custom URLS
Scheduled publishing
Remove Branding
Restrict embedding
Deck Collections
Notes
Features
All features
Private URLs
Password Protection
Custom URLS
Scheduled publishing
Remove Branding
Restrict embedding
Deck Collections
Notes
Explore
Featured decks
Featured speakers
Programming
Technology
Storyboards
Explore
Featured decks
Featured speakers
Programming
Technology
Storyboards
Pricing
Search
Sign in
Sign up for free
rでgoogle_analyticsデータ解析~グラフィックス編~ #TechLunch
Search
Livesense Inc.
PRO
April 23, 2014
Technology
83
0
Share
Embed
Copy iframe code
Copy JS code
Copy link
Start on current slide
rでgoogle_analyticsデータ解析~グラフィックス編~ #TechLunch
2011/06/29(水) @ Livesense TechLunch
発表者:福田 絵里
Livesense Inc.
PRO
April 23, 2014
More Decks by Livesense Inc.
See All by Livesense Inc.
味覇で作るパスタが美味い - 20261001_yabaubuki.dev
livesense
PRO
0
140
Rubyはただの⾔語に⾮ず
livesense
PRO
0
580
28新卒_Webエンジニア職採用_会社説明資料
livesense
PRO
0
130
27新卒_総合職採用_会社説明資料
livesense
PRO
0
7.5k
27新卒_Webエンジニア職採用_会社説明資料
livesense
PRO
0
13k
株式会社リブセンス・転職会議 採用候補者様向け資料
livesense
PRO
0
600
株式会社リブセンス 会社説明資料(報道関係者様向け)
livesense
PRO
1
1.8k
データ基盤の負債解消のためのリプレイス
livesense
PRO
0
730
26新卒_総合職採用_会社説明資料
livesense
PRO
0
13k
Other Decks in Technology
See All in Technology
オントロジーって 結局なにもの? AI エージェントに「意味」を渡す知識設計の話
greenmidori
0
230
USB PDを使ってスマホを労わりたい
raspython3
0
180
夫婦で子育てするための育児標準化
codmoninc
PRO
0
450
How to Design Configuration for Rails Applications
willnet
1
830
初海外で注意すべきこと12選!!!安全快適なre:invent生活にするために
yuuuuuuu168
1
180
CTO Night|NotionのAIエージェントとFDE
kzkhykw1991
0
230
JAWS-UGグッズ職人仕事の流儀
kentapapa
0
120
Active Record Connection Adaptersにおける長年の課題に再び取り組む
yahonda
0
200
実践! SRE × AI - ABEMA における AIOps -
tetsuya28
8
3.1k
事業成長とデータ活用を止めないためのマネジメントへ挑戦
hiracky16
0
400
hackers_champloo_2026_tidb
makocchi
0
170
アウトプット初心者、半年間のふりかえり
4o1sobblue
0
440
Featured
See All Featured
Connecting the Dots Between Site Speed, User Experience & Your Business [WebExpo 2025]
tammyeverts
11
1.1k
Building Flexible Design Systems
yeseniaperezcruz
330
41k
svc-hook: hooking system calls on ARM64 by binary rewriting
retrage
2
630
Conquering PDFs: document understanding beyond plain text
inesmontani
PRO
4
3.2k
What does AI have to do with Human Rights?
axbom
PRO
1
2.5k
SEO in 2025: How to Prepare for the Future of Search
ipullrank
3
3.9k
Money Talks: Using Revenue to Get Sh*t Done
nikkihalliwell
0
520
Distributed Sagas: A Protocol for Coordinating Microservices
caitiem20
333
23k
30 Presentation Tips
portentint
PRO
1
430
The Anti-SEO Checklist Checklist. Pubcon Cyber Week
ryanjones
0
270
Templates, Plugins, & Blocks: Oh My! Creating the theme that thinks of everything
marktimemedia
31
2.9k
Site-Speed That Sticks
csswizardry
13
1.6k
Transcript
RでGoogleAnalyticsデータ解析 ~グラフィックス編~ Eri Fukuda 2011/06/29
Contents 主目的 Rを利用して、Google Analytics Data Export APIからデータを取り出 し、統計解析を行う。 今回の目標 Rを利用して、Analyticsデータのグラフィック化する。
1. デバイスと関数 2. データのグラフィック化 3. おまけ
デバイスと関数 作図デバイス:グラフを出力するウィンドウ 作図関数:グラフを出力する関数 高水準作図関数 ← 要データ 低水準作図関数 ← データ不必要
対話的作図関数(作図デバイス上で直接編集)
ArbeitStock(PC版)の日にち毎の訪問者数取得(Firefox 利用者に限定) install.packages("RCurl", repos = "http://cran.md.tsukuba.ac.jp") install.packages("XML", repos = "http://cran.md.tsukuba.ac.jp")
library(RGoogleAnalytics) ga <- RGoogleAnalytics() options(RCurlOptions = list(capath = system.file("CurlSSL", "cacert.pem", package = "RCurl"), ssl.verifypeer = FALSE)) ga$SetCredentials("INSERT_USER_NAME", "INSERT_PASSWORD") profiles <- ga$GetProfileData() query <- QueryBuilder() query$Init(start.date = "2011-03-01", end.date = "2011-03-31", dimensions = "ga:date", metrics = "ga:visits", sort = "ga:date", filters = "ga:browser=~^Firefox", table.id = "ga:15300579") ga.data <- ga$GetReportData(query) ga.data$data ArbeitStock(PC版)のプロファイルID 訪問者数 日にちごと Firefox利用者に絞り込み
ga:date ga:visits 1 20110301 1932 2 20110302 1776 3 20110303
1713 4 20110304 1636 5 20110305 1111 6 20110306 1179 7 20110307 1774 8 20110308 1722 9 20110309 1690 10 20110310 1577 11 20110311 1071 12 20110312 608 13 20110313 706 14 20110314 961 15 20110315 1166 16 20110316 1186 17 20110317 1187 18 20110318 1163 19 20110319 1007 20 20110320 988 21 20110321 1261 22 20110322 1589 23 20110323 1541 24 20110324 1562 25 20110325 1476 26 20110326 1172 27 20110327 1205 28 20110328 1785 29 20110329 1779 30 20110330 1798 31 20110331 1784 ArbeitStock(PC版)の日にち毎の訪問者数取得(Firefox 利用者に限定)
作図の標準的な関数:plot() オプション:pch, col, type, main, lwd, xlim, ylim, etc...
おまけ
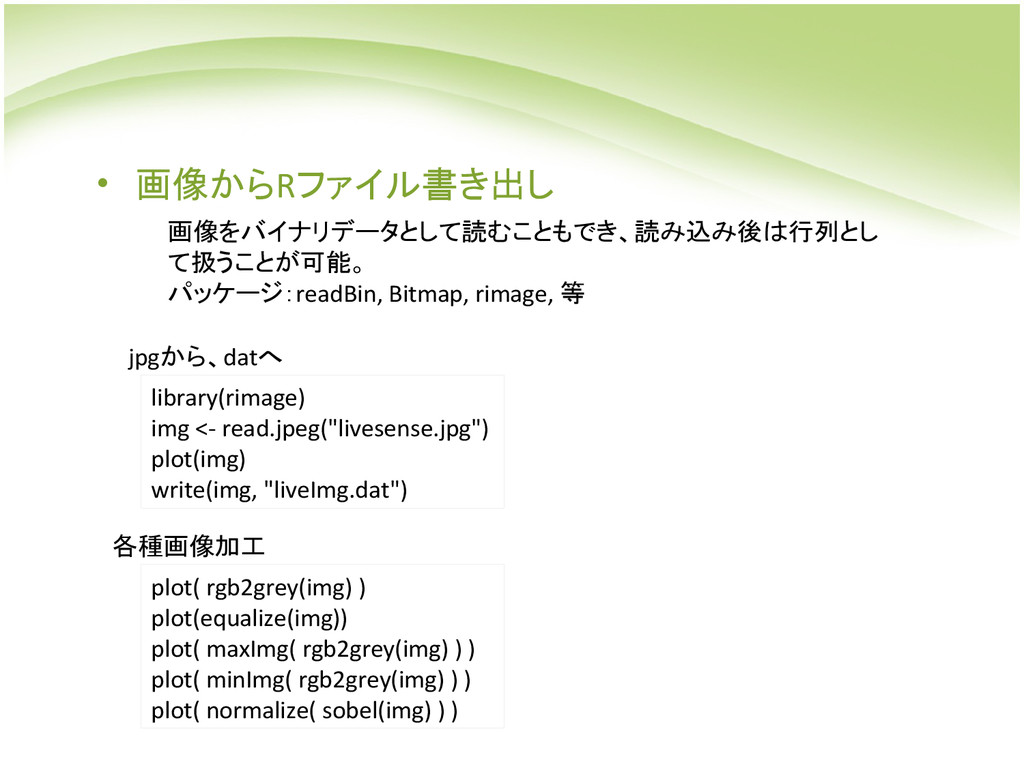
画像をバイナリデータとして読むこともでき、読み込み後は行列とし て扱うことが可能。 パッケージ:readBin, Bitmap, rimage, 等 library(rimage) img <- read.jpeg("livesense.jpg")
plot(img) write(img, "liveImg.dat") jpgから、datへ plot( rgb2grey(img) ) plot(equalize(img)) plot( maxImg( rgb2grey(img) ) ) plot( minImg( rgb2grey(img) ) ) plot( normalize( sobel(img) ) ) 各種画像加工 • 画像からRファイル書き出し
画像をバイナリデータとして読むこともでき、読み込み後は行列とし て扱うことが可能。 パッケージ:readBin, Bitmap, rimage, 等 library(rimage) img <- read.jpeg("livesense.jpg")
plot(img) write(img, "liveImg.dat") jpgから、datへ plot( rgb2grey(img) ) plot(equalize(img)) plot( maxImg( rgb2grey(img) ) ) plot( minImg( rgb2grey(img) ) ) plot( normalize( sobel(img) ) ) 各種画像加工 グレースケール ヒストグラムの平坦化 最大値フィルタ 最小値フィルタ ソーベルフィルタ • 画像からRファイル書き出し
• TeachingDemos package require(TeachingDemos) plot(dice(1,6)) set.seed(17) faces(matrix(sample(1:1000,128) ,4 ,32) ,main="random
faces") faces2(matrix( runif(18*10), nrow=10), main='random faces2') 統計的概念やRの使用法を学ぶためのパッケージ
• sinx^y=siny^x par(mfrow=c(1,2)) x <- seq(0, 9.5, length=50) y <-
seq(0, 6, length=50) f <- function(x,y) {r <- sin(x^y)} z <- outer(x,y,f) persp(x, y, z, theta = -10, phi = 50, col = "lightblue", ltheta = -120, shade = 0.75, box = T) f <- function(x,y) {r <- sin(y^x)} z <- outer(x,y,f) persp(x, y, z, theta = -10, phi = 50, col = "pink", ltheta = -120, shade = 0.75, box = T) z=sinx^y と z=siny^x のグラフ
RでGoogleAnalyticsデータ解析 ~統計処理編~ 次回テーマ


 livesense
 greenmidori
 raspython3
 codmoninc
 willnet
 yuuuuuuu168
 kzkhykw1991
 kentapapa
 yahonda
 tetsuya28
 hiracky16
 makocchi
 4o1sobblue
 tammyeverts
 yeseniaperezcruz
 retrage
 inesmontani
 axbom
 ipullrank
 nikkihalliwell
 caitiem20
 portentint
 ryanjones
 marktimemedia
 csswizardry