Upgrade to Pro — share decks privately, control downloads, hide ads and more …

Economic Forecast for 2014

Economic Forecast for 2014

Stephen Dickson
Vice President & Controller
Wisconsin Energy Corporation
February 12, 2014
Maranatha Baptist University

Maranatha Baptist University

February 12, 2014
Tweet

More Decks by Maranatha Baptist University

Other Decks in Business

Transcript

  1. Economic Forecast for 2014 Stephen Dickson Vice President & Controller

    Wisconsin Energy Corporation February 12, 2014 Maranatha Baptist University
  2. Stephen Dickson – We Energies Vice President, Controller & Chief

    Accounting Officer Wisconsin Energy – 15 years Arthur Andersen – 15 years Chair of audit committee – Aurora Health Care Board – Center for Urban Teaching Volunteer – St. Marcus Lutheran School
  3. About We Energies 4 Largest electric and gas company in

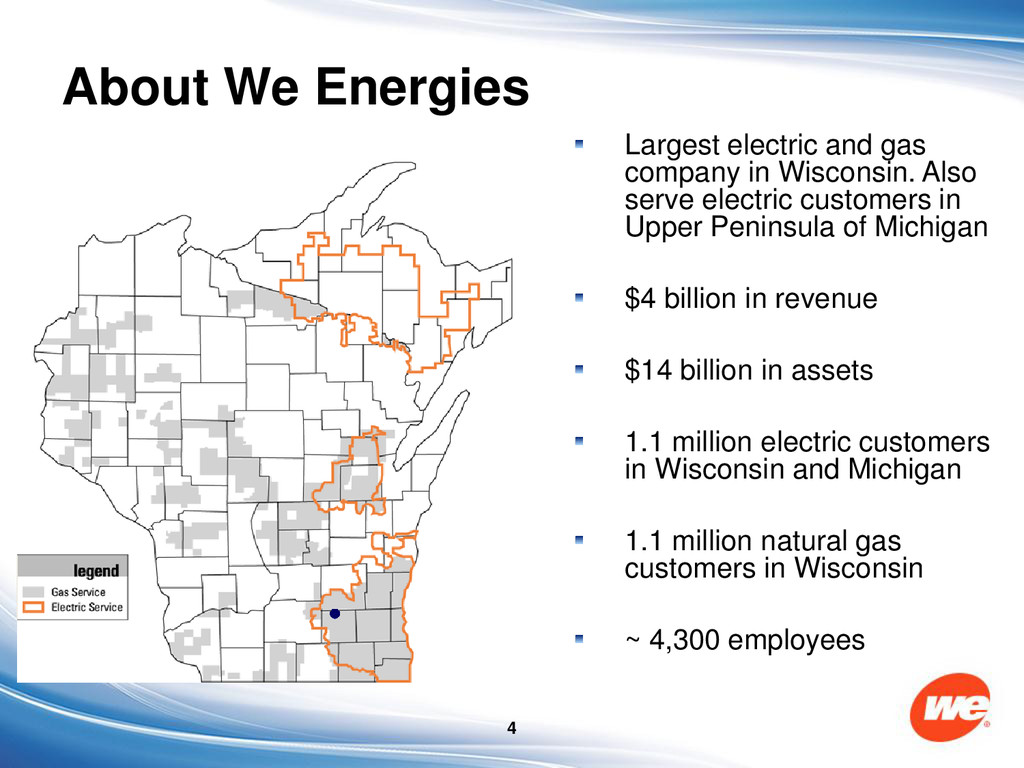
    Wisconsin. Also serve electric customers in Upper Peninsula of Michigan $4 billion in revenue $14 billion in assets 1.1 million electric customers in Wisconsin and Michigan 1.1 million natural gas customers in Wisconsin ~ 4,300 employees
  4. U.S. Economy: The numbers are good… GDP - expect 3%

    range Inflation - low Interest rates - low Households - reduced debt service Housing markets - recovering Jobs - jobs up, unemployment down Corporations – profits up, cash on balance sheets
  5. …But it doesn’t feel that way Memories of 2007-2008 Jobs

    – people leaving the workforce Companies  Unwilling to make new investments  Unwilling to hire new employees
  6. Headwinds to economic growth Healthcare costs Income tax policy Educated

    workforce Government – balance sheets Regulation
  7. National energy trends The environment Fuel sources  Coal 

    Natural gas  Nuclear  Renewables  wind, solar, biomass Conservation
  8. 17 Possible Timeline for Environmental Regulatory Requirements for the Utility

    Industry Ozone (O3 ) PM/PM2.5 '08 '09 '10 '11 '12 '13 '14 '15 '16 '17 Begin CAIR Phase I Seasonal NOx Cap HAPs MACT Proposed Rule Revised Ozone NAAQS Begin CAIR Phase I Annual SO2 Cap -- Adapted from Wegman (EPA 2003) Updated 04-11-2012 Proposed PM-2.5 NAAQS Revision PM Transport Rule SO2 Primary NAAQS SOX/NOx Secondary NAAQS NOx Primary NAAQS SOx/NOx/Visibility CAMR & Delisting Rule vacated Hg/HAPS Transport Rule Proposal Issued (CAIR Replacement) HAPs MACT Rule Finalized (04/16/12) CAIR Vacated HAPS MACT Compliance 3 yrs After Final Rule CAIR Remanded CAIR/Transport Begin CAIR Phase I Annual NOx Cap 316(b) Proposed Rule 316(b) Final Rule Expected 316(b) Compliance 1-8 yrs After Final rule Effluent Guidelines Proposed Rule Expected Water Effluent Guidelines Final Rule Expected Effluent Guidelines Compliance 0-5+ yrs After Final Rule Begin Compliance Requirements Under Final CCB Rule (ground water monitoring, double liners, closure, dry ash conversion) Ash Proposed Rule for CCBs Management Final Rule for CCBs Mgmt CSAPR Issued (CAIR/Transport Rule Replacement) CO2 CO2 Regulation (PSD/BACT) Ozone NAAQS Revision CSAPR Phase I Reductions CSAPR Phase II Reductions Ozone Transport Rule GHG NSPS Proposal Expected (existing sources) GHG NSPS Published (new sources) (04/13/12) Expected Final PM-2.5 NAAQS Revision PCB Phase-out PCB ANPR PCB Proposed Rule Expected PCB Final Rule Expected (start of phase-out period) EPA Notice - Regional Haze SIPS Overdue BART (Visibility) Deadline at Some Plants EPA Action on Regional Haze/BART GHG NSPS Implementation (existing sources)
  9. Wisconsin government: Getting healthier State budget – from $3.6 B

    deficit to surplus State tax revenues increase Funded pension plan Positive debt ratings
  10. Wisconsin businesses: Optimistic Business owners – 95% believe state is

    headed in right direction Reduced unemployment – 6.2% vs national 6.7% Growth in exports – 6% increase in agricultural exports
  11. -10% 0% 10% 20% 30% 40% 50% 60% 70% 80%

    90% 100% 2000 2001 2002 2003 2004 2005 2006 2007 2008 2009 2010 2011 2012 2013 Percent Increase Cumulative Increase 69.0% Avg Annual 4.9% Day to Day Operations & Infrastructure -2.7% Reliability/Air Quality Control 11.8% Fuel 22.7% Transmission 11.5% Power the Future 18.0% Conservation, Low Income Programs & Misc Tax 3.4% Renewable Energy 4.3% Impact on electric rates
  12. We Energies & the deep freeze December/January - coldest two-month

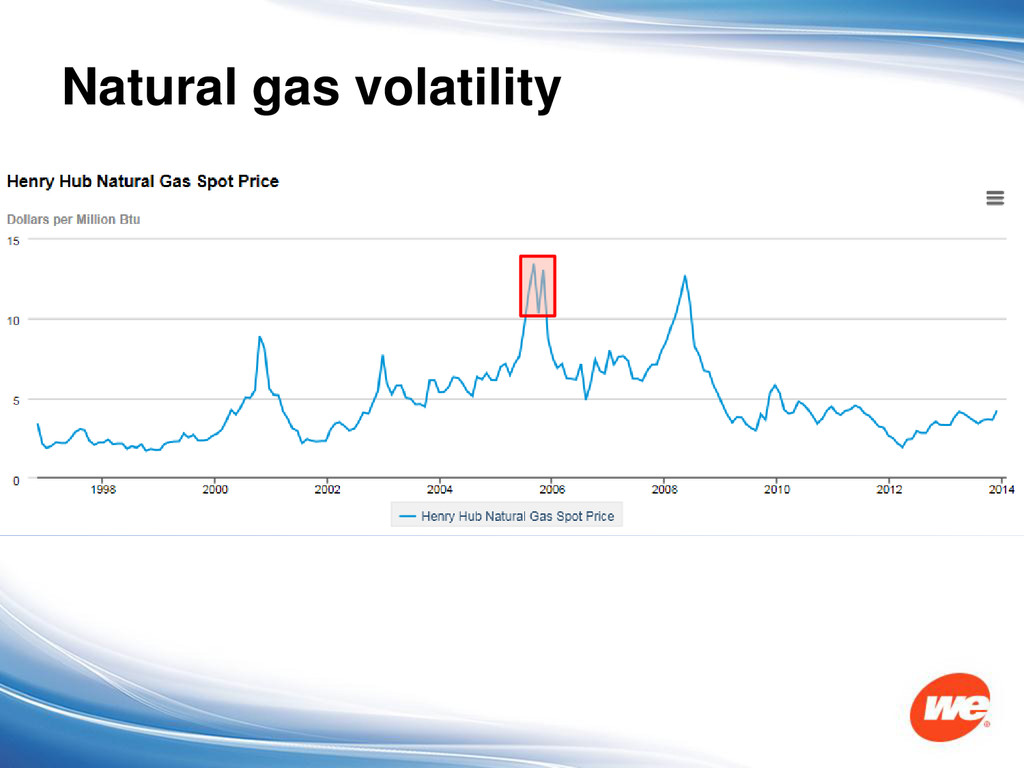
    period in 30 years Record set - most natural gas use ever during January’s polar vortex Record set – new all-time winter peak demand for electricity on Jan. 7.