Upgrade to Pro — share decks privately, control downloads, hide ads and more …

New Crafts: How to relate your OKRs to your technical real-estate

New Crafts: How to relate your OKRs to your technical real-estate

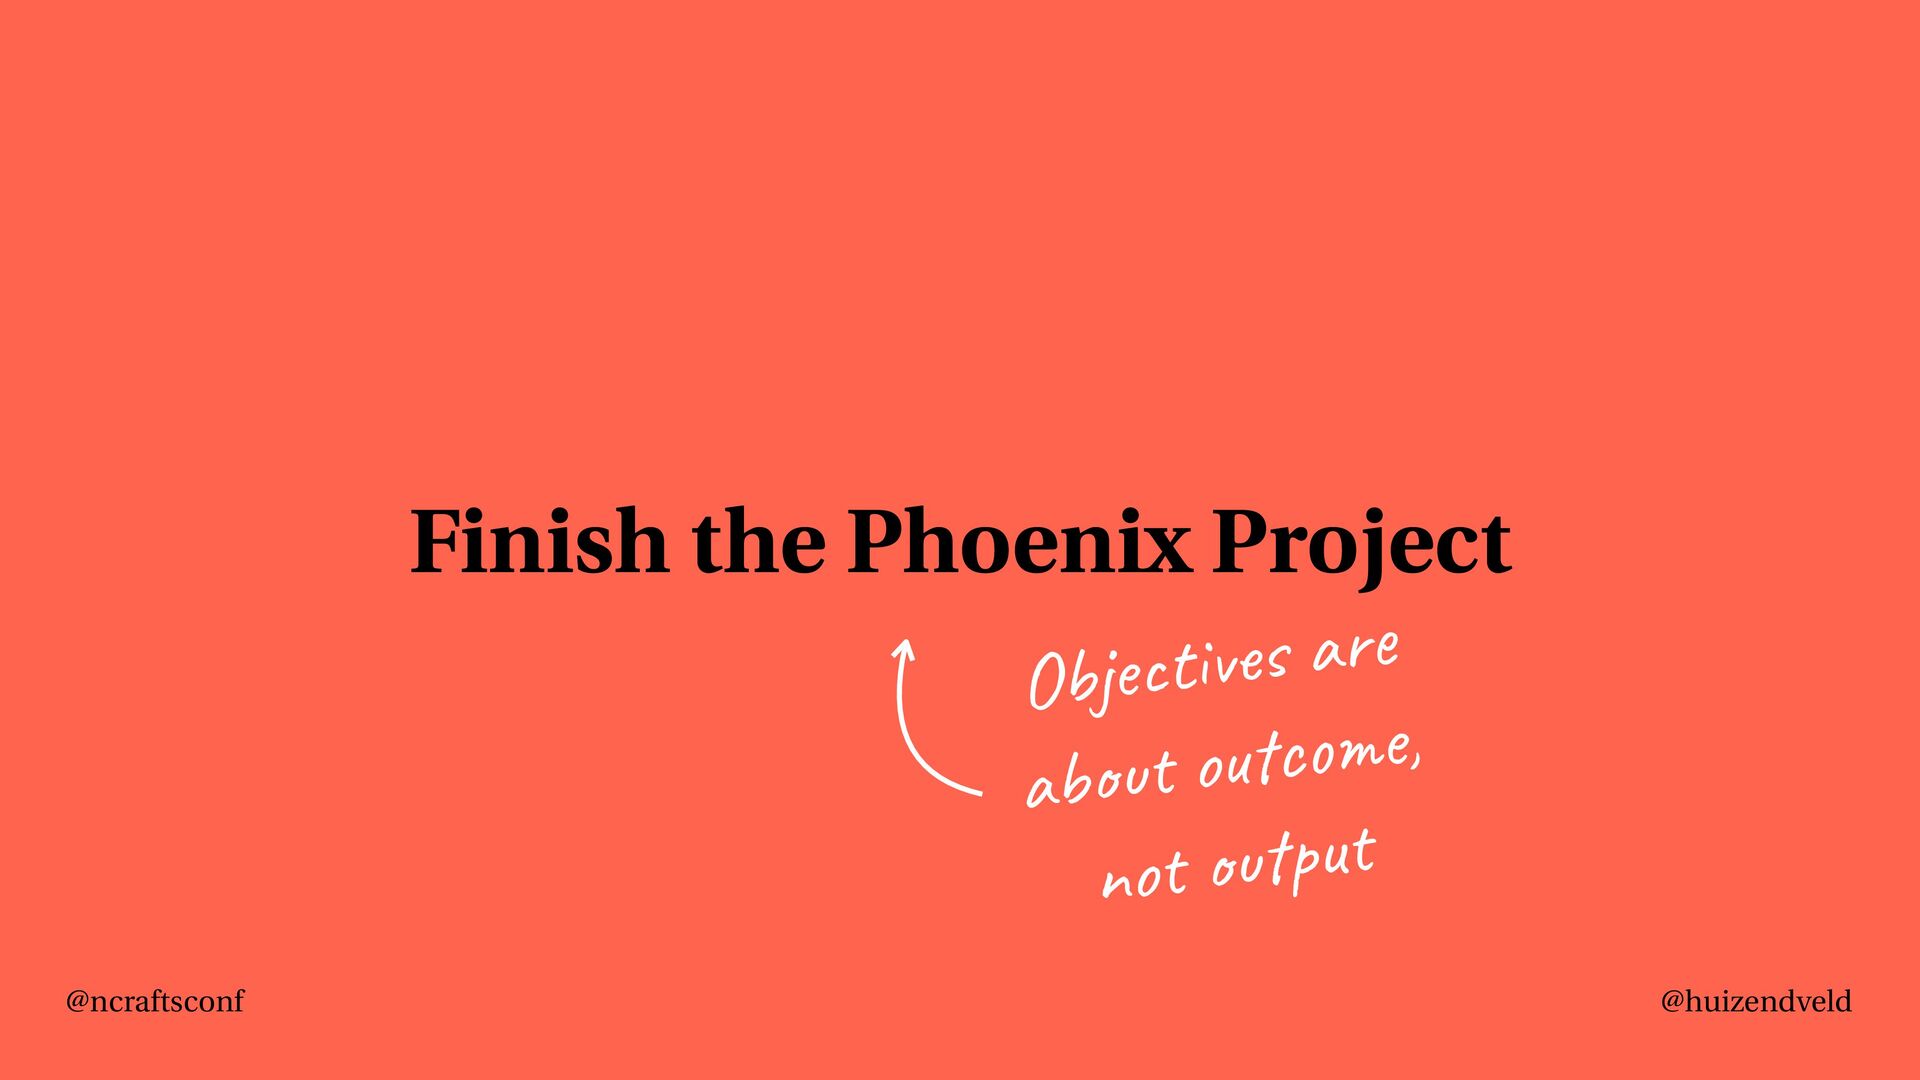
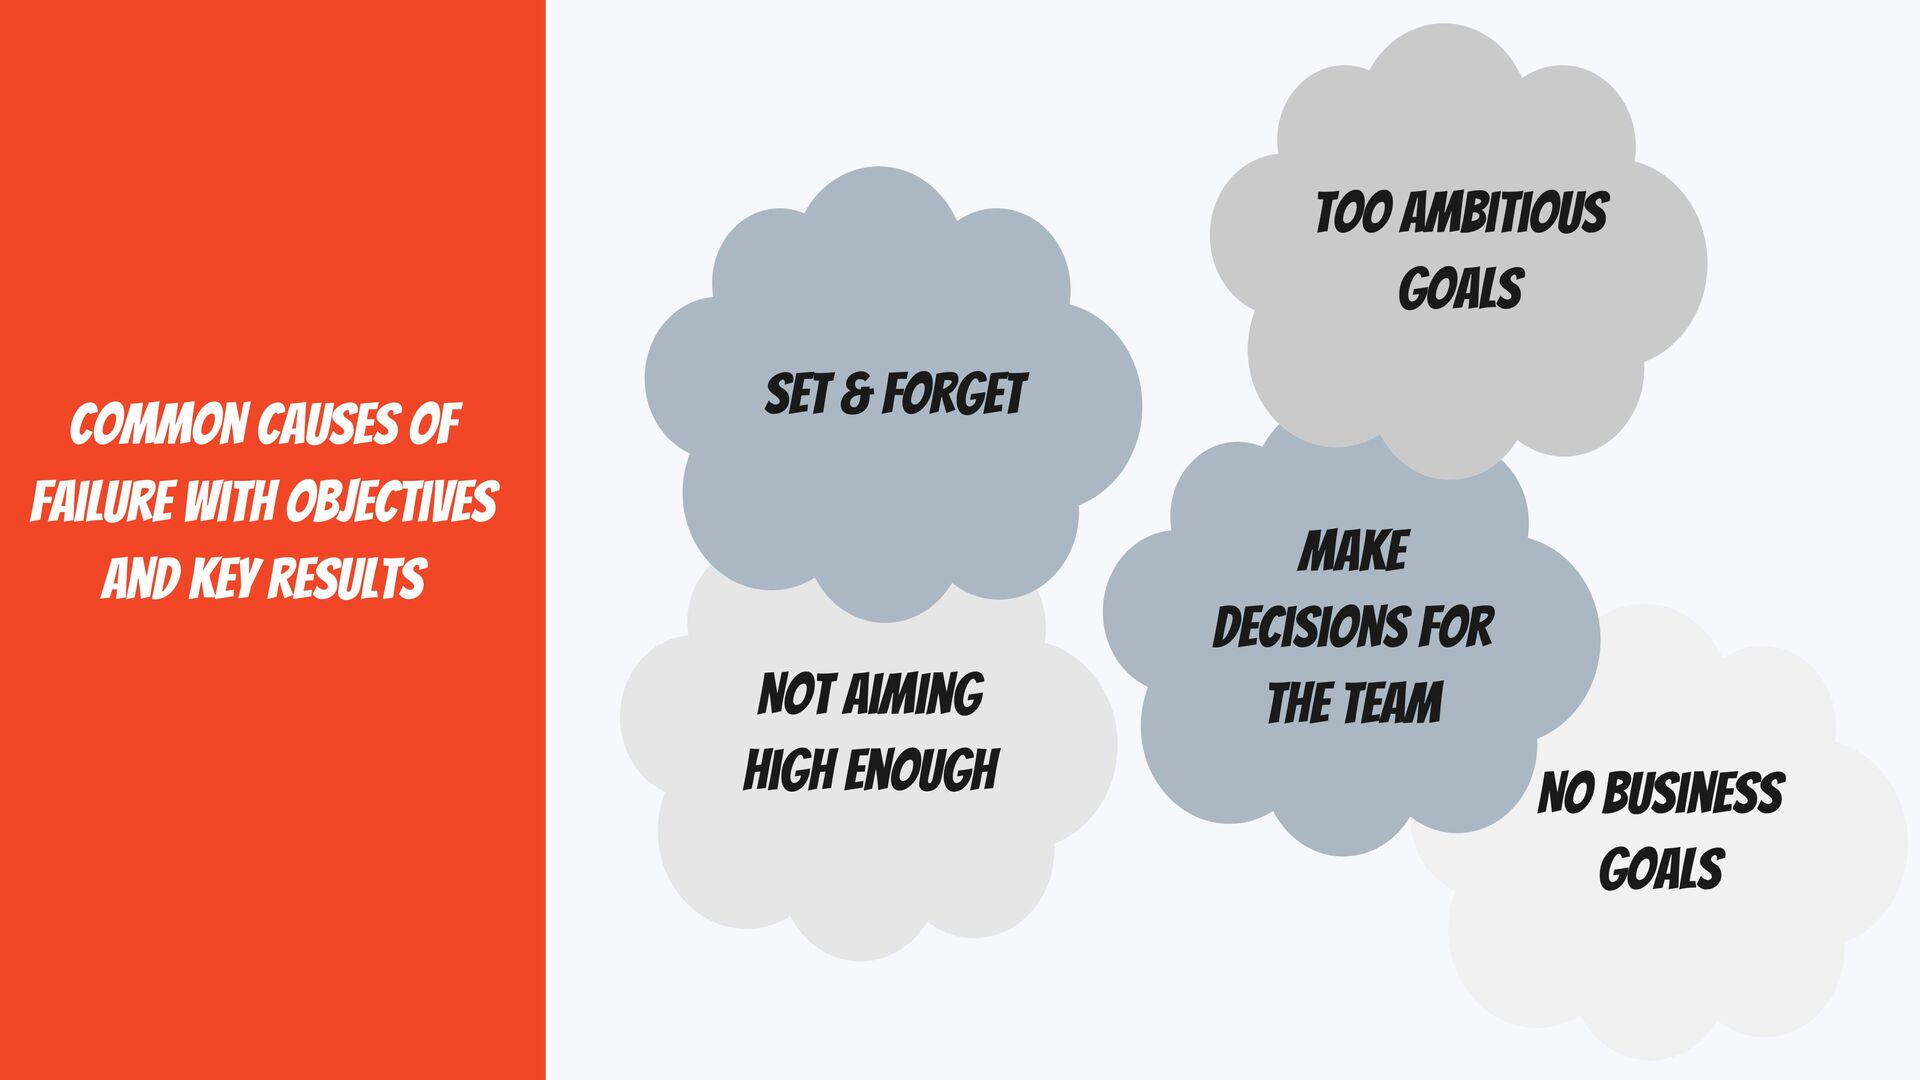
TL,DR; Successful initiatives to change software architectures are directed at achieving an outcome, rather than producing output. Objectives & Key Results provide an accessible mechanism to set and track desired outcomes as goals.
Wardley Maps enable software teams to challenge the goals by linking the higher level objectives to constraints in the domain model and in the software architecture.

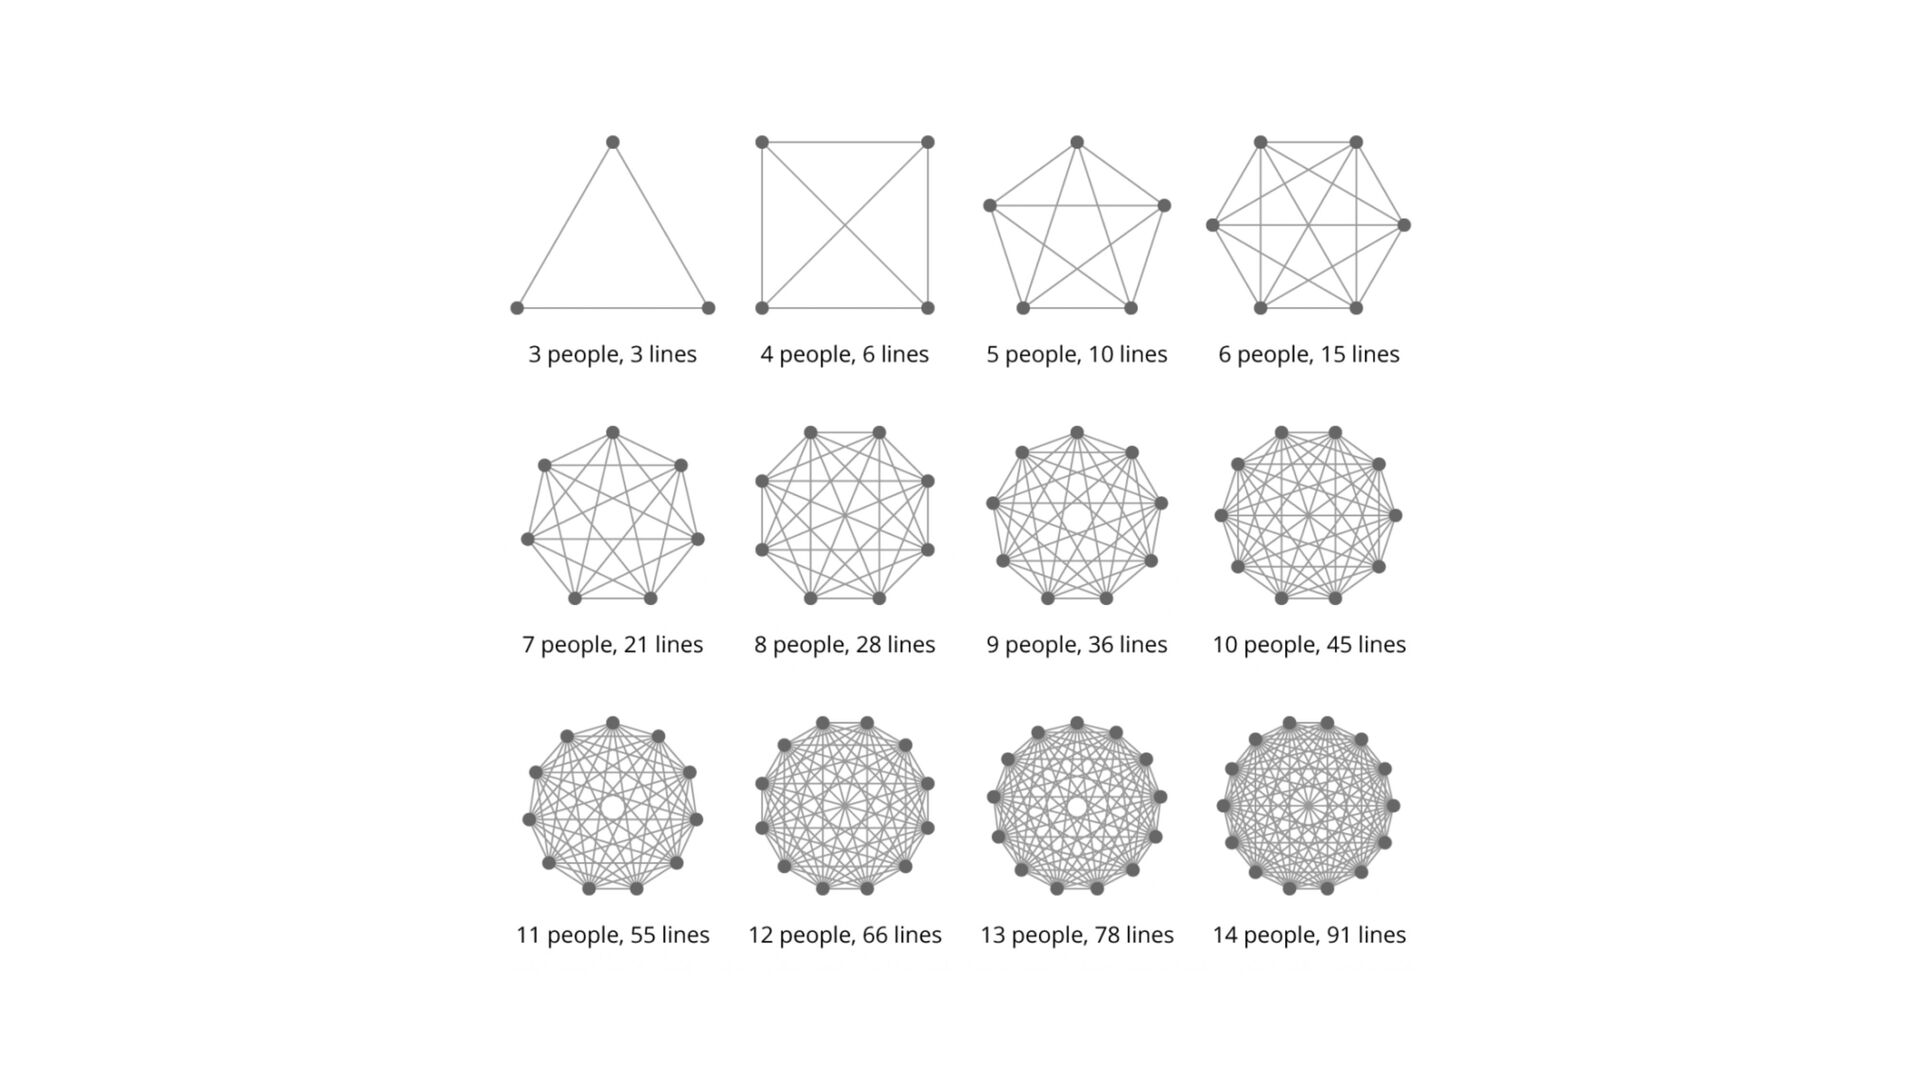
When was the last time that you saw an organization that frequently was saying goodbye to features or entire products? Most organizations keep their systems around for a considerable amount of time. As a consequence of that, teams are faced with ever growing complexity thanks to the mesh of products, services, technology, and the people that work to build, operate, and maintain these things. Even if solutions are contained within system boundaries, the landscape made up of interconnected systems may become a beast of its own. This poses a challenge for people that want to improve systems and change the landscape...

To make matters worse, choosing what opportunities to pursue is a challenge by itself. You may have a team that is able to solve a problem the right way, but what helps this team to solve the right problem? How can they continuously validate their progress – or the absence of progress – with people in “tech” and “non-tech” roles? And what should they do when new opportunities present themselves? Is the plan they had still valid?

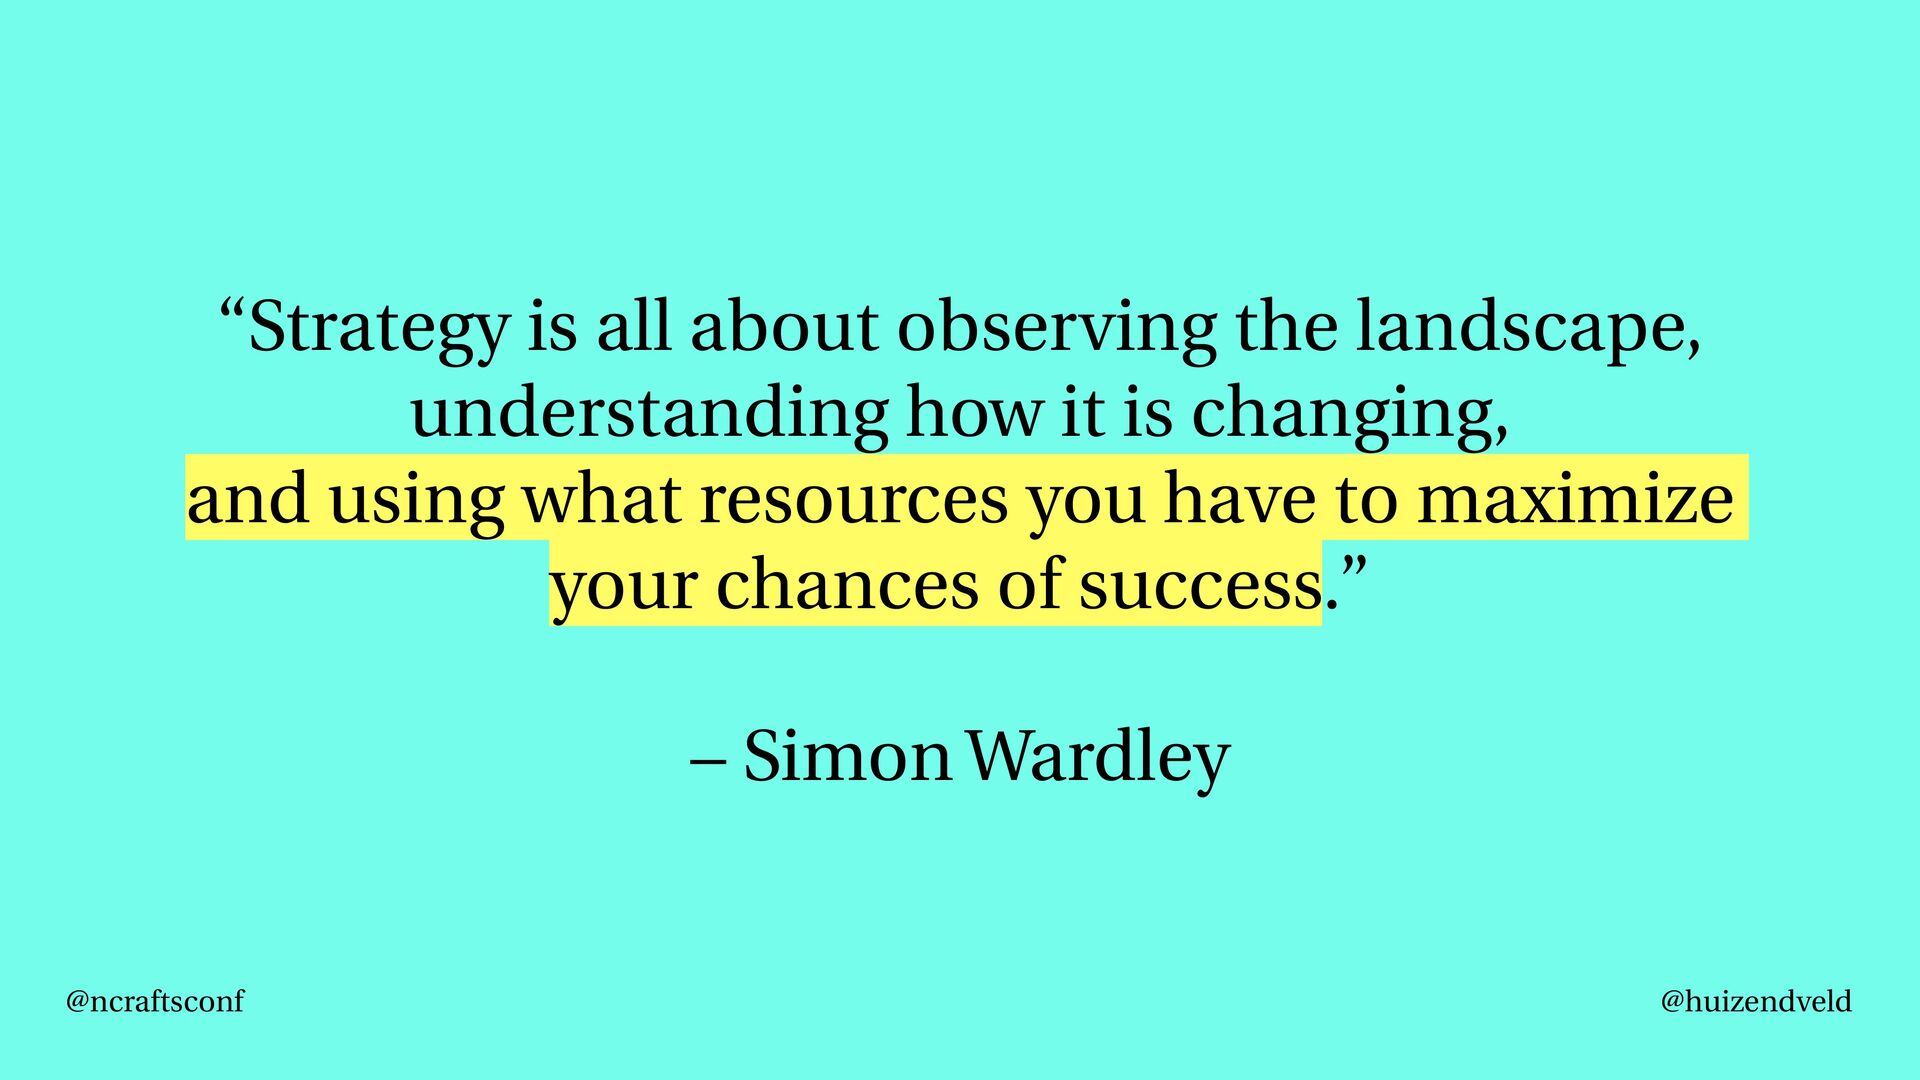
Strategy is about playing your cards right: A good strategy takes into account the resources that can be leveraged, and the constraints that limit what can be done. But how do you devise a strategy, and what can you do to implement it?

This talk is about collaborative product ownership. How teams can discover and implement solutions to business problems that are both feasible and sustainable.

Imagine:

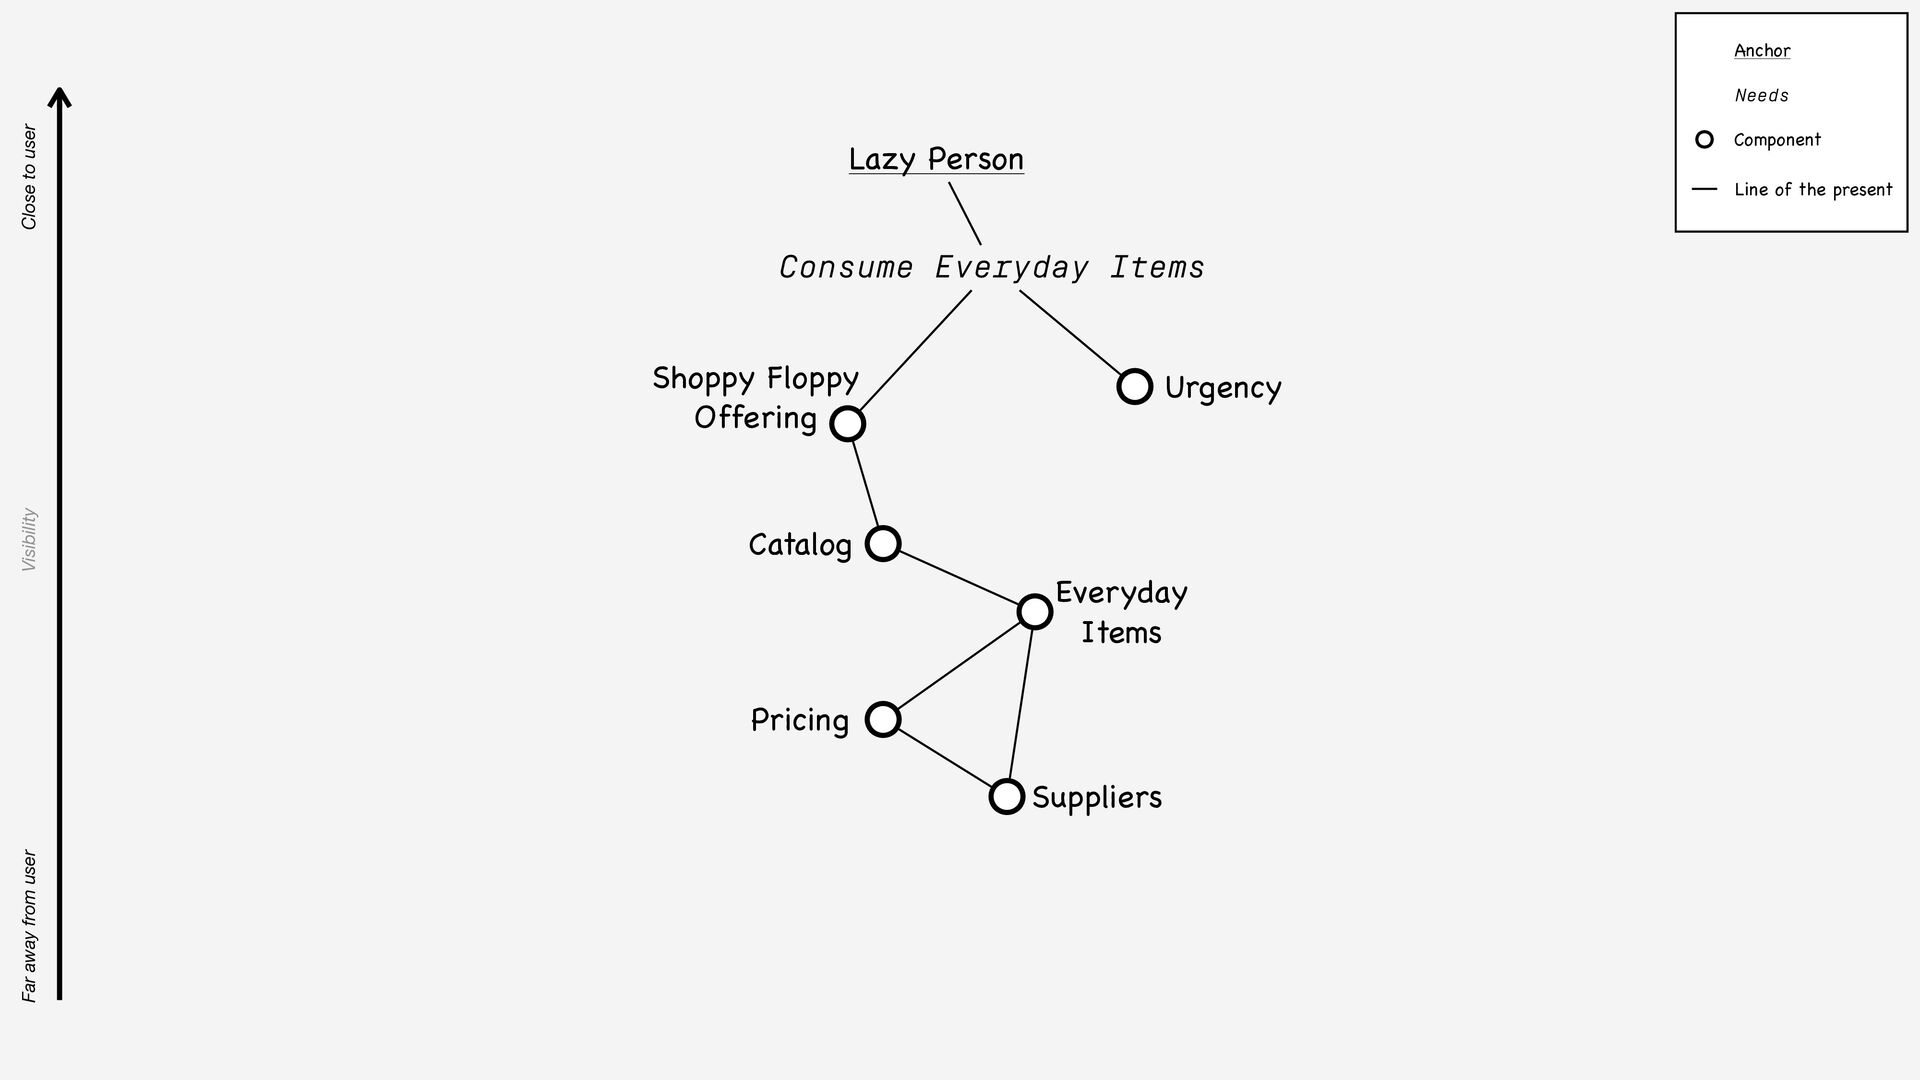
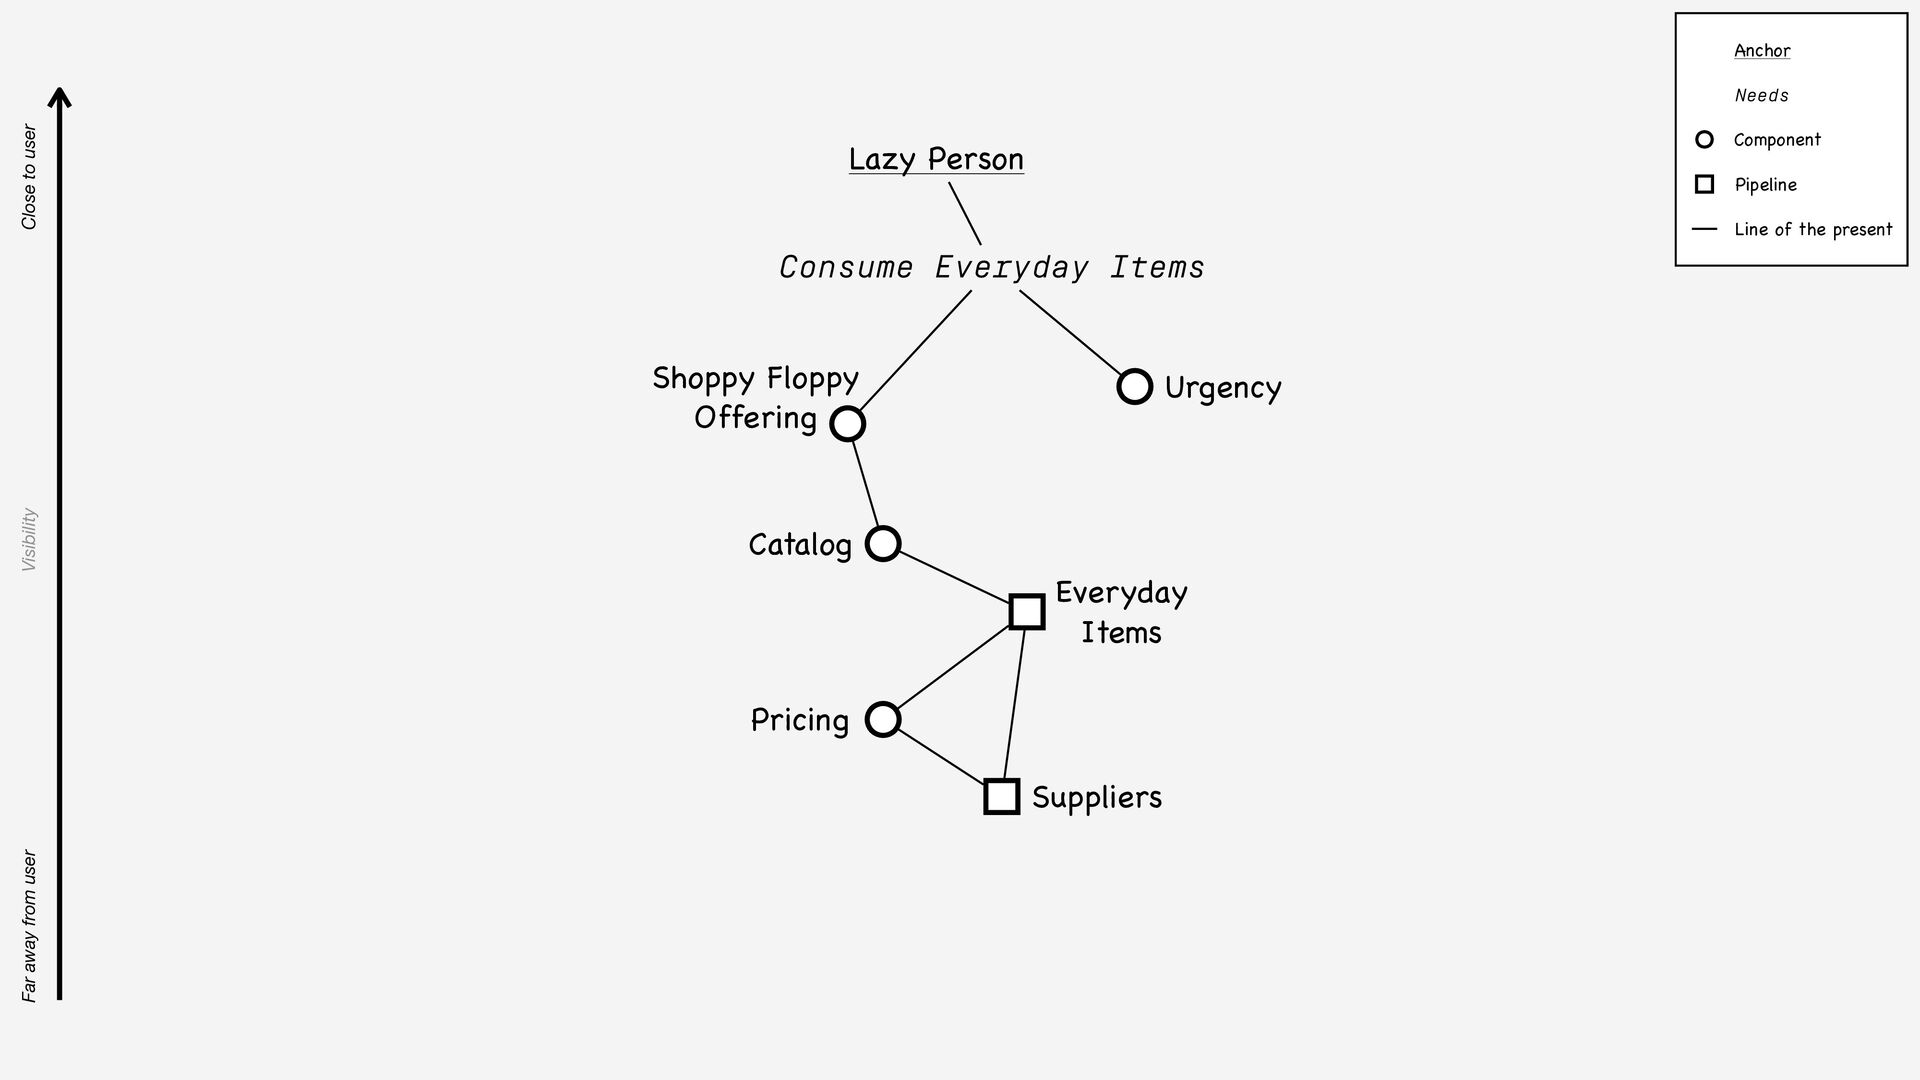
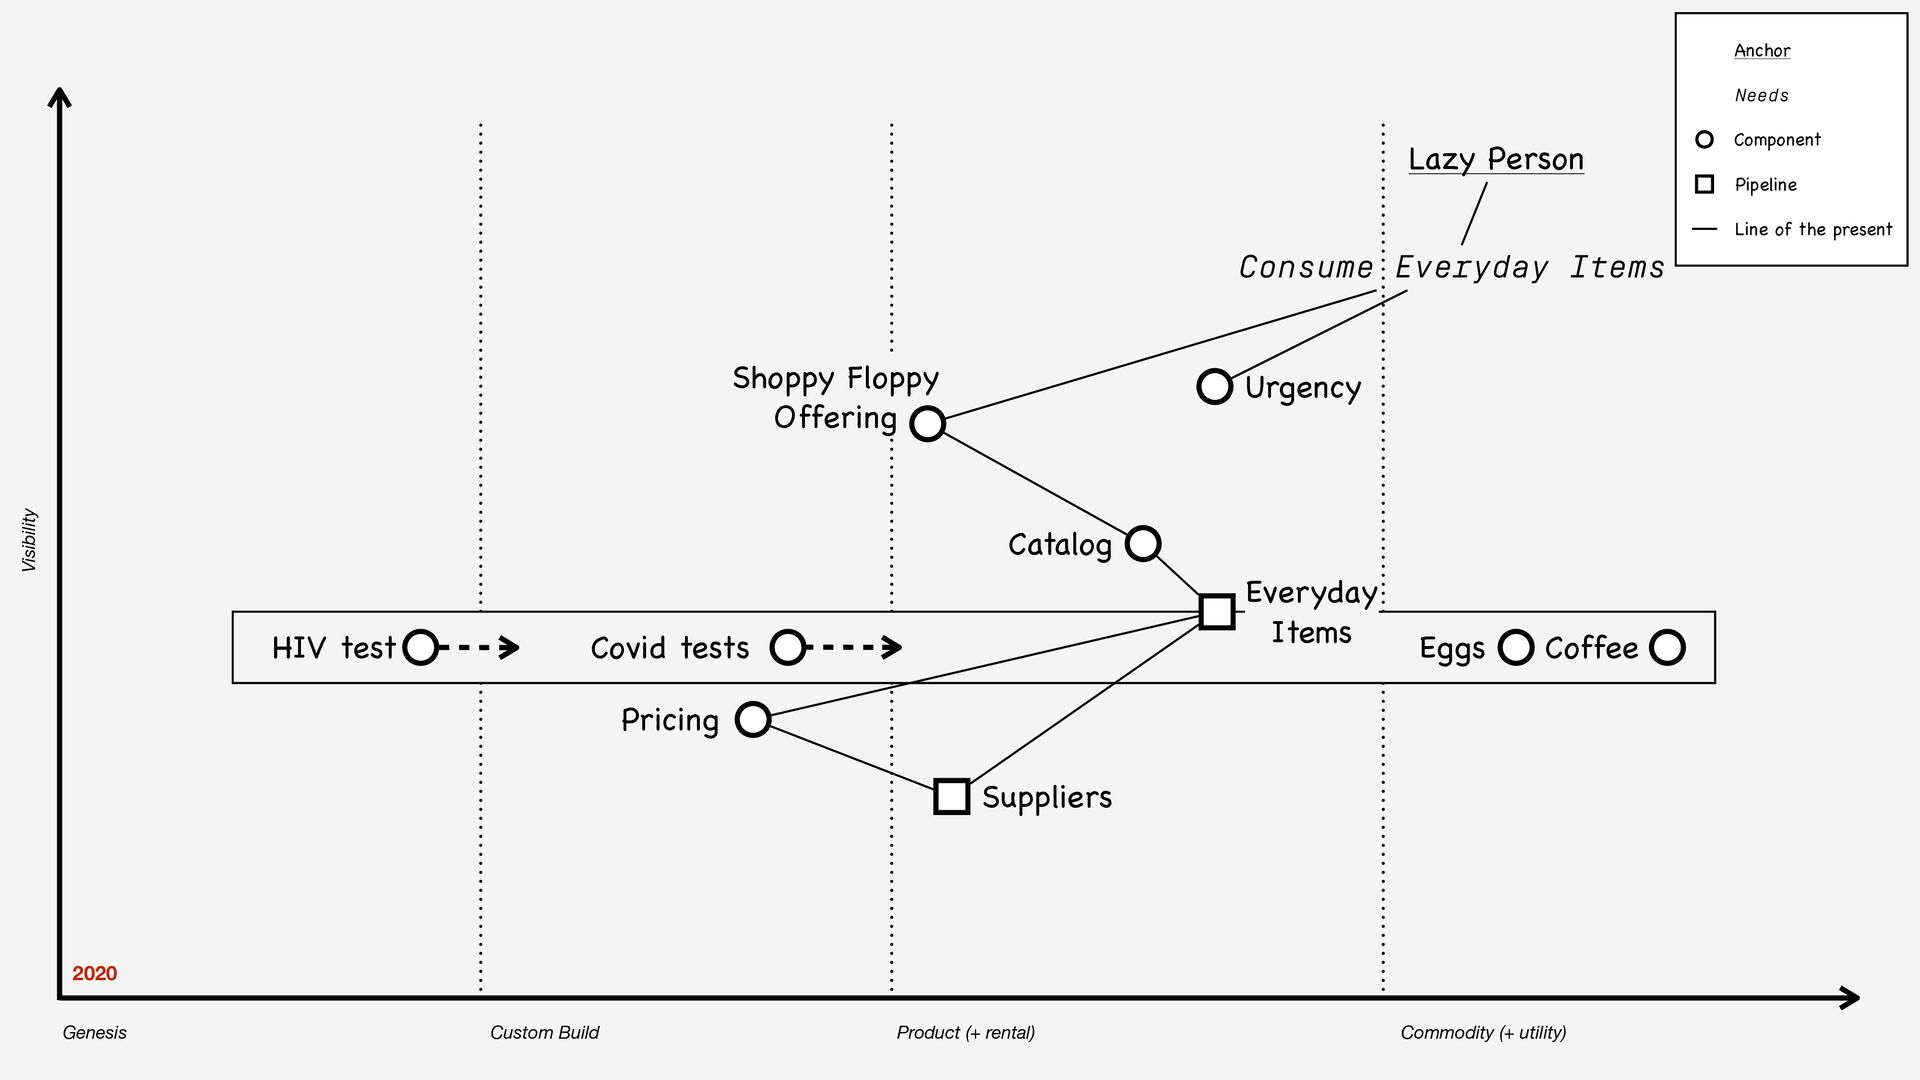
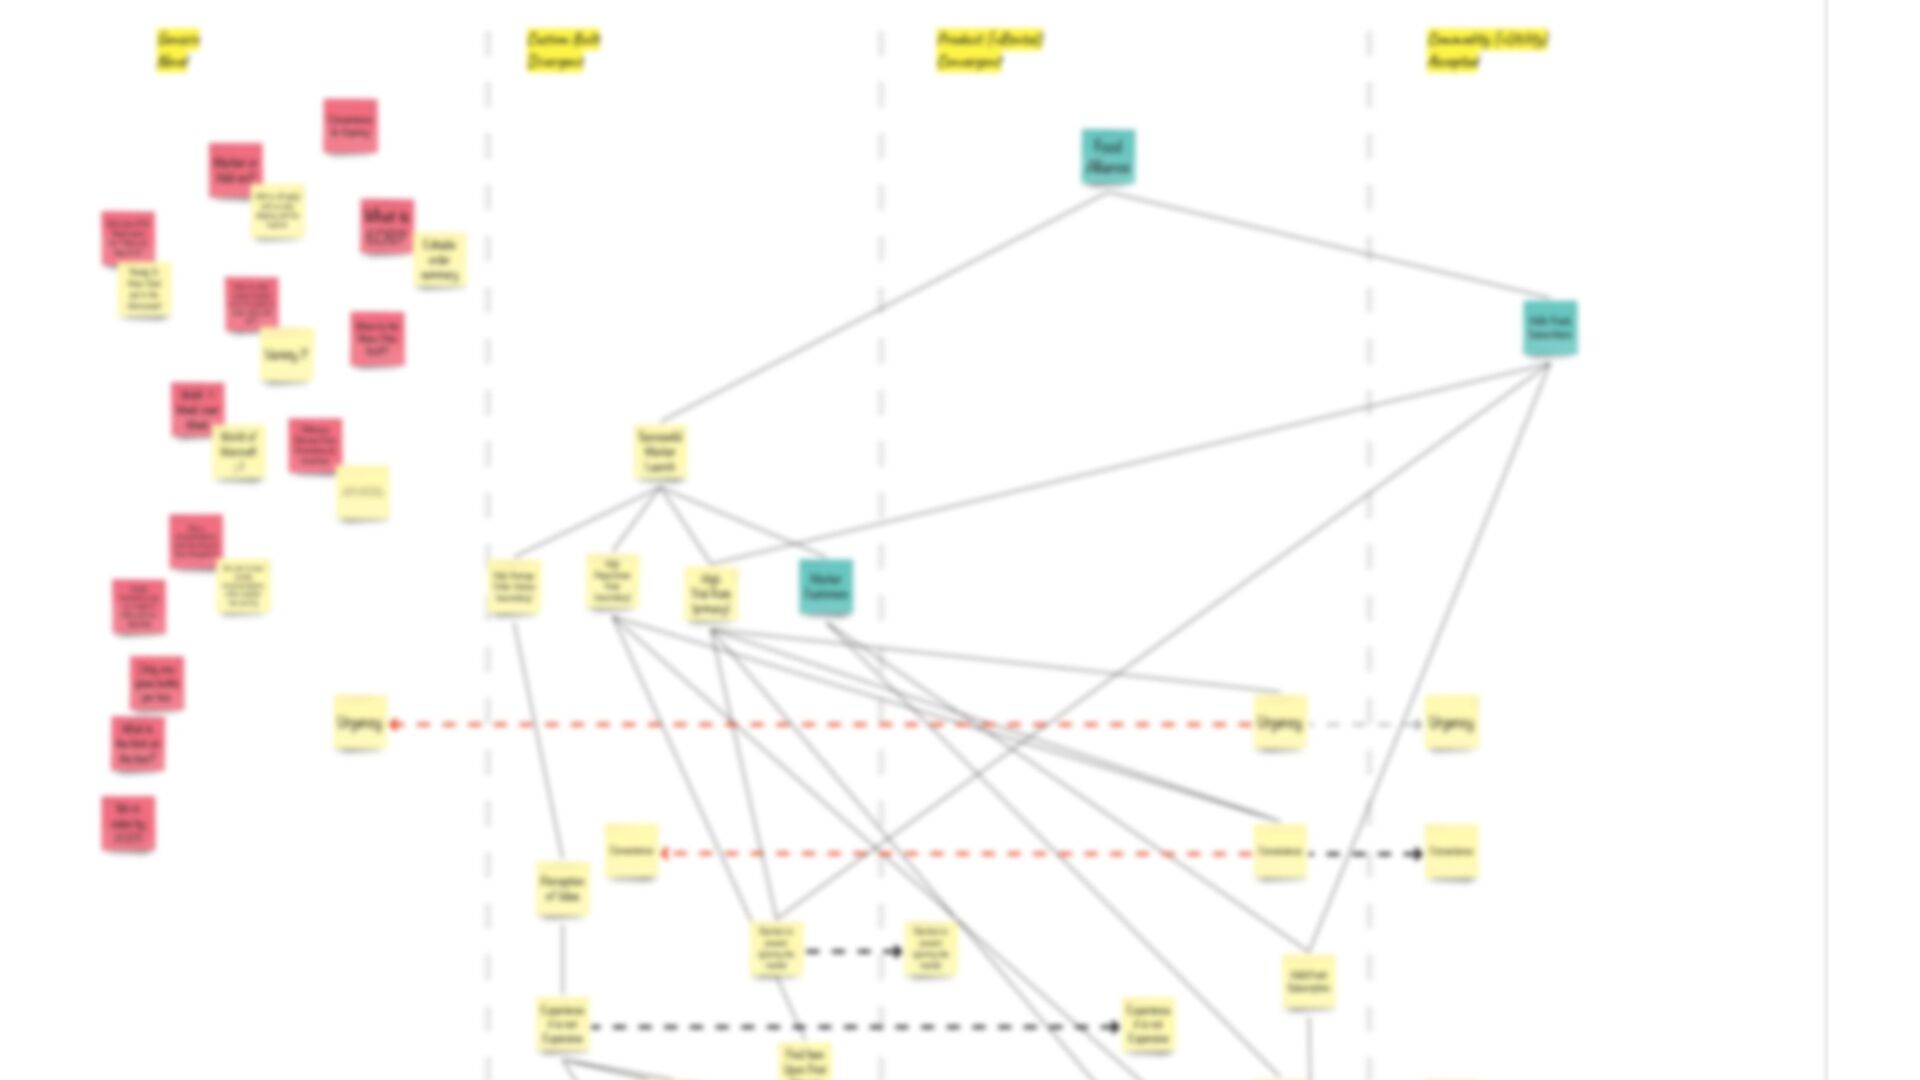
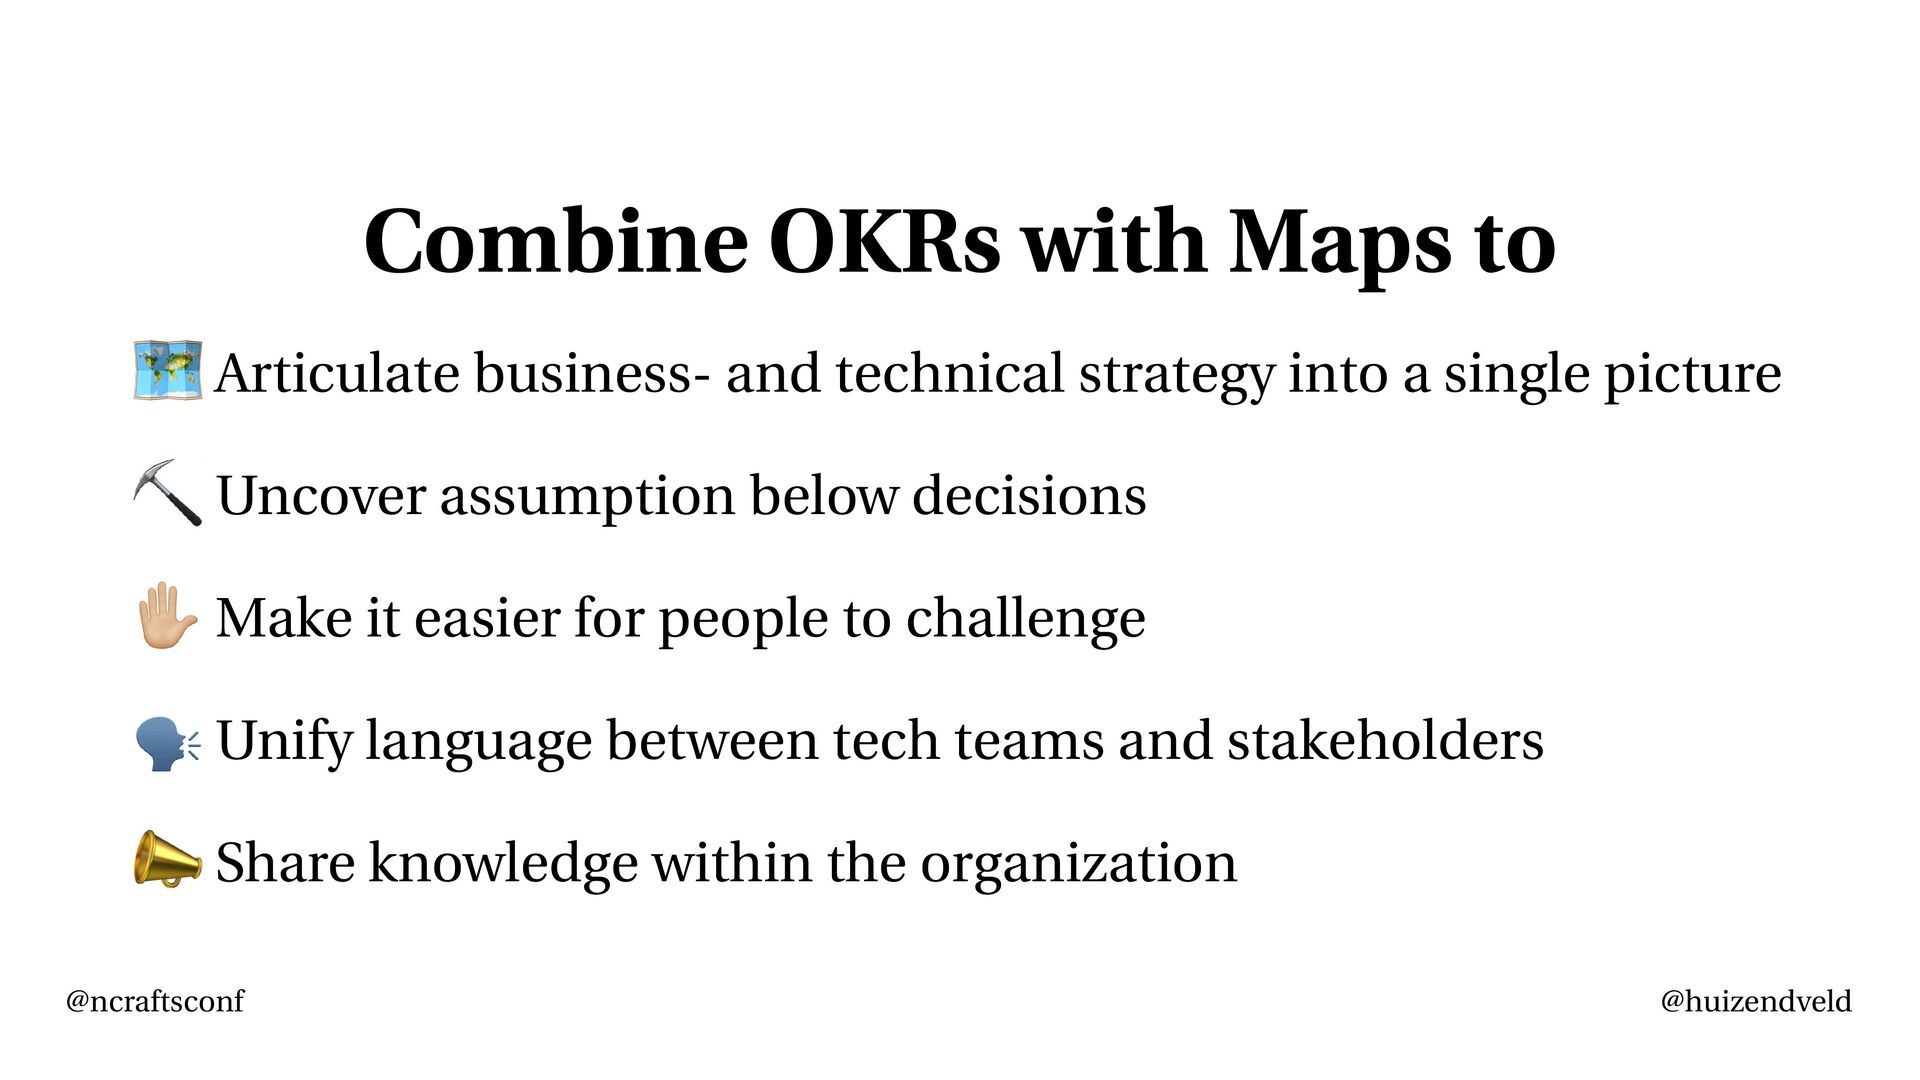
- a way to visualize and clarify to the relationships between OKRs, hypothesis and the underlying technical constraints within the technical real-estate;
- having a common language to talk about problems in context, removing ambiguity and confusion in the process;
- and finally a way to collaboratively dive into the nitty gritty detail of the current landscape and the proposed solution;

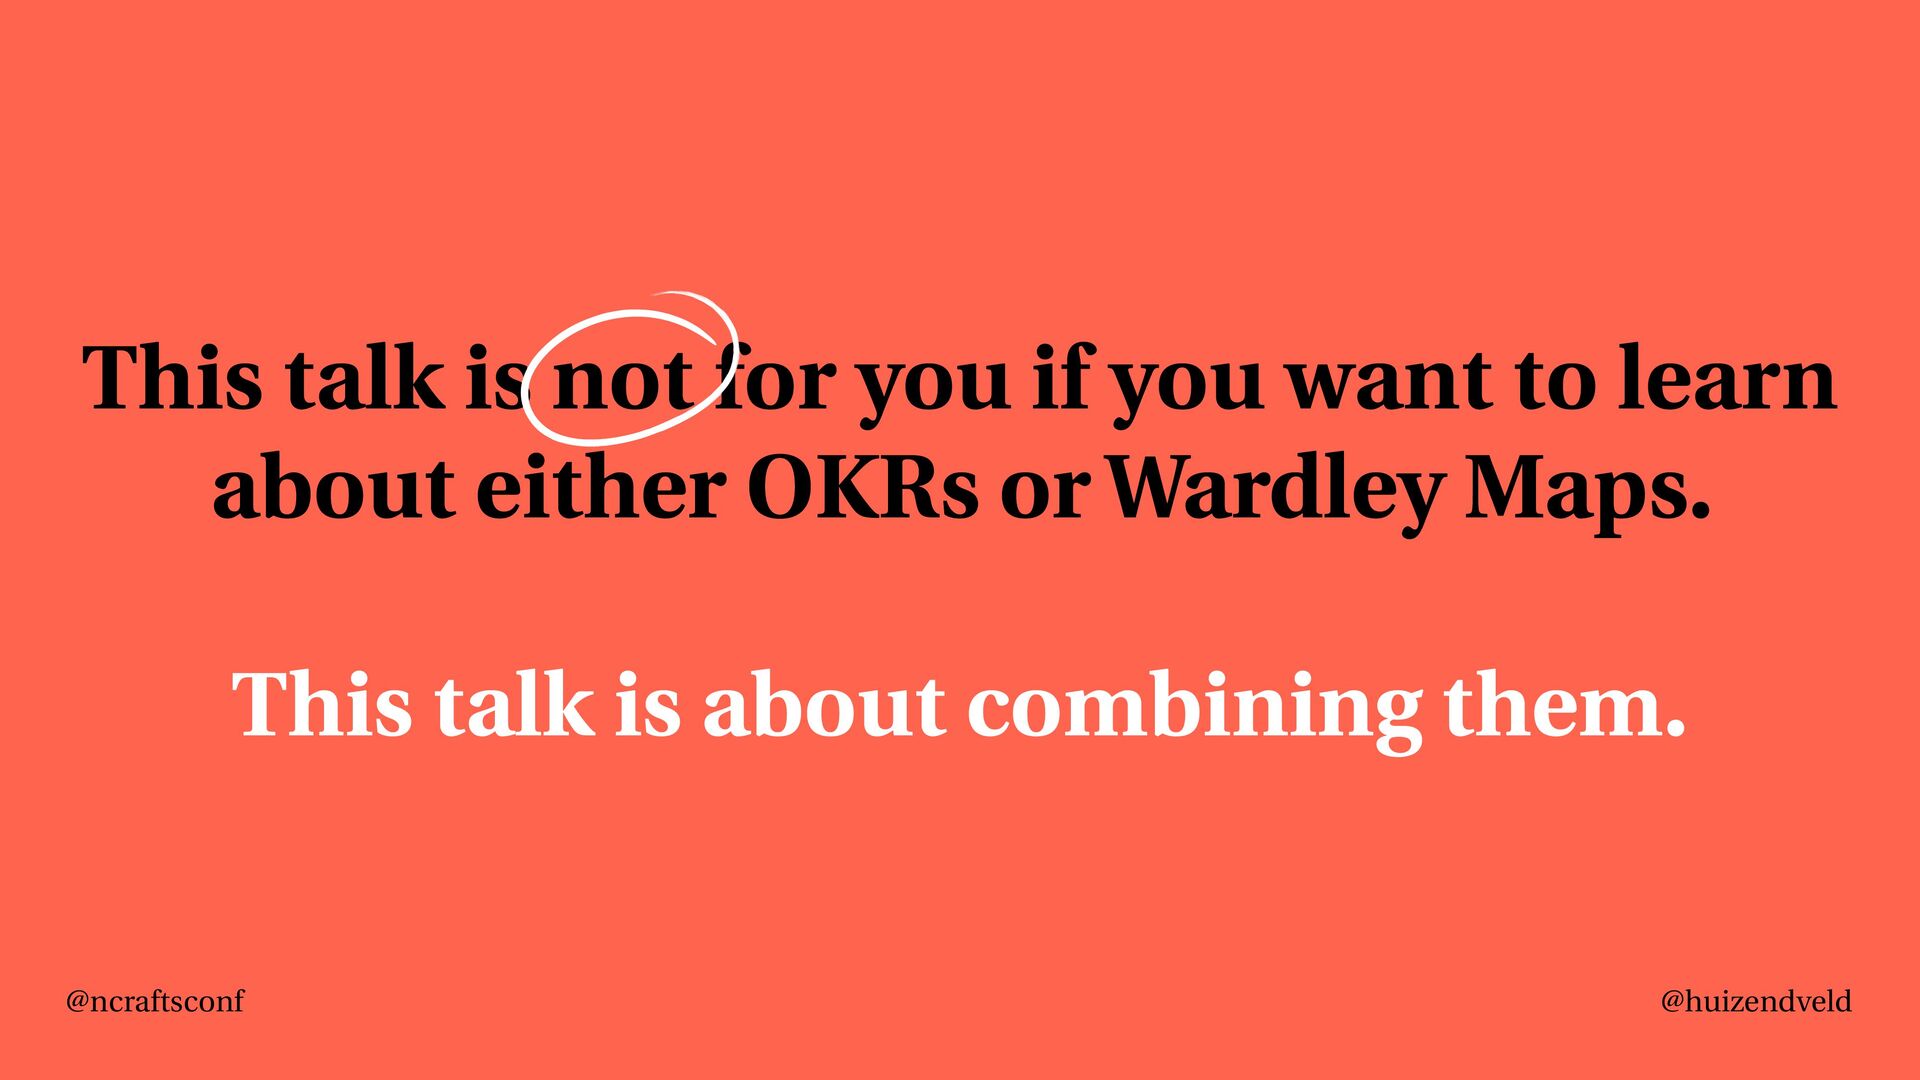
In this session Marijn Huizendveld will bridge the gap between business goals, the competitive landscape, and the systems in the organization by using OKRs and Wardley Maps.

Expect:

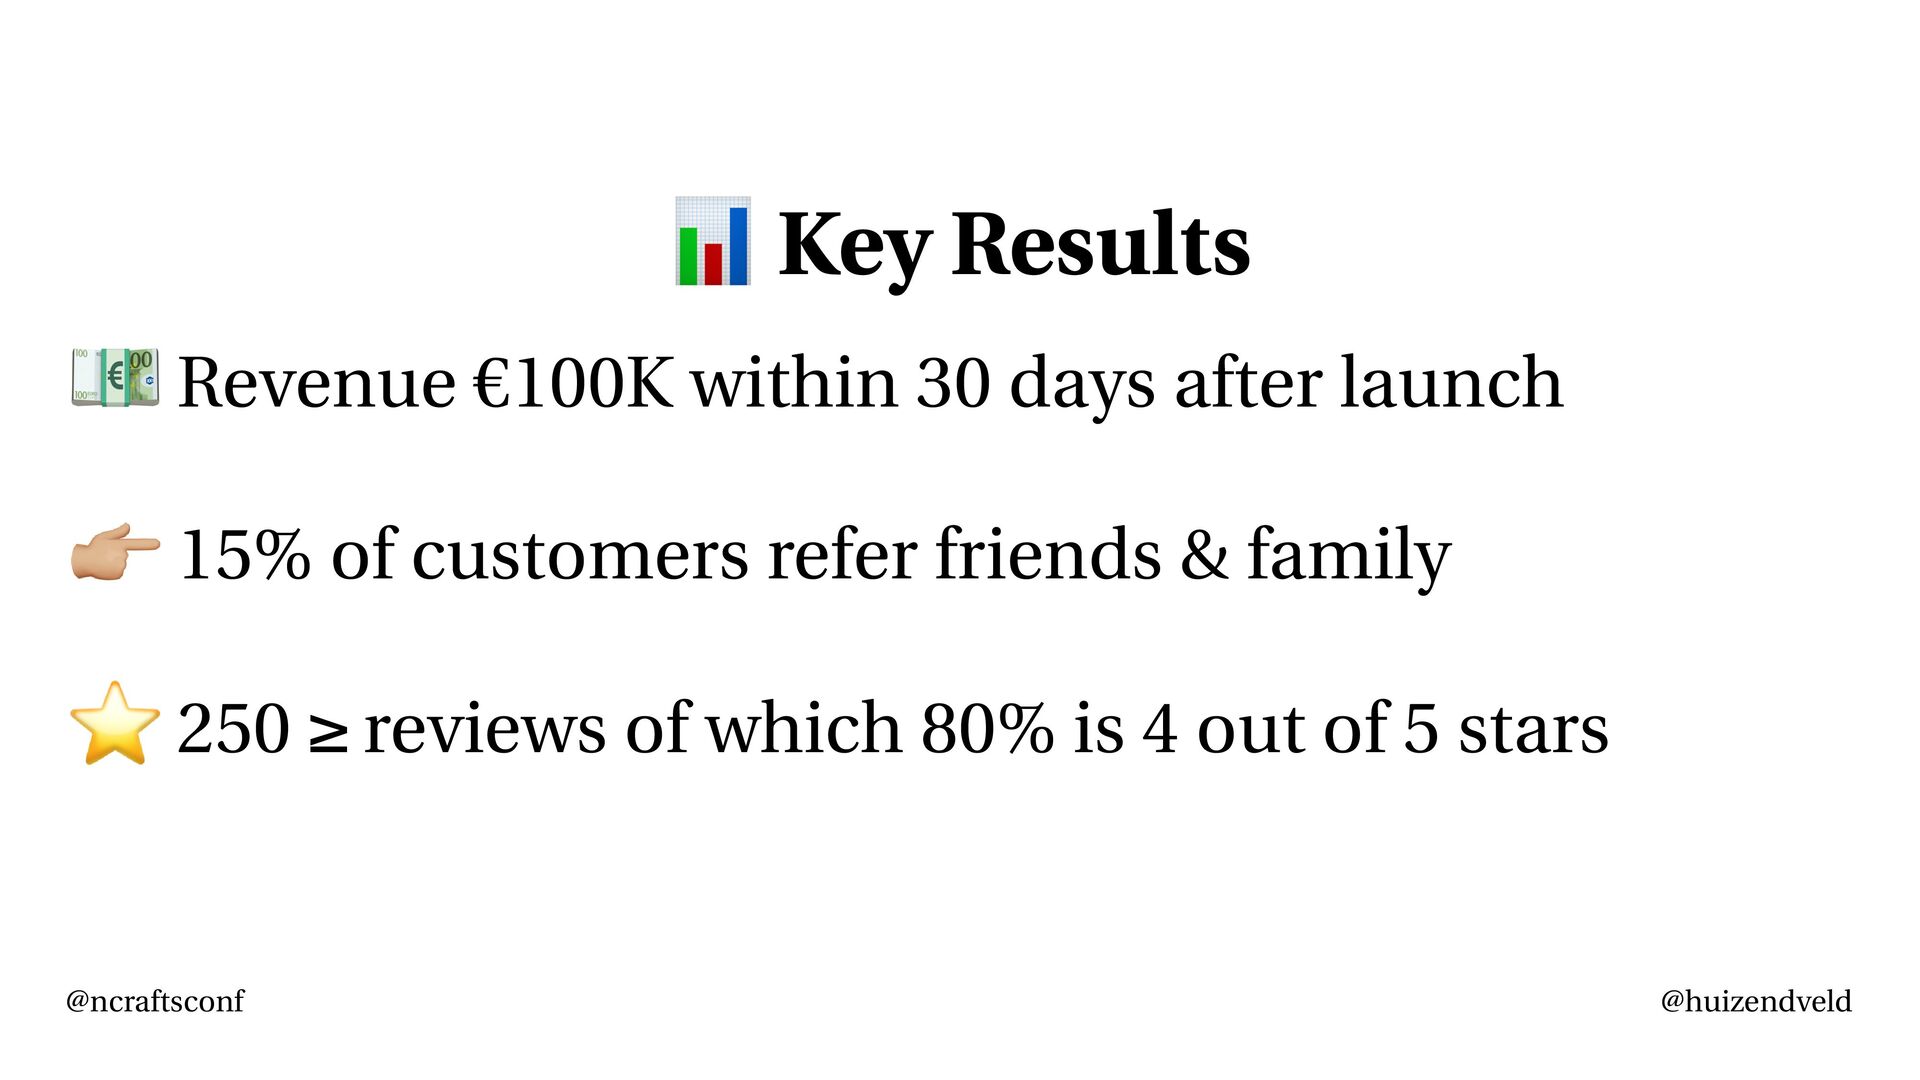
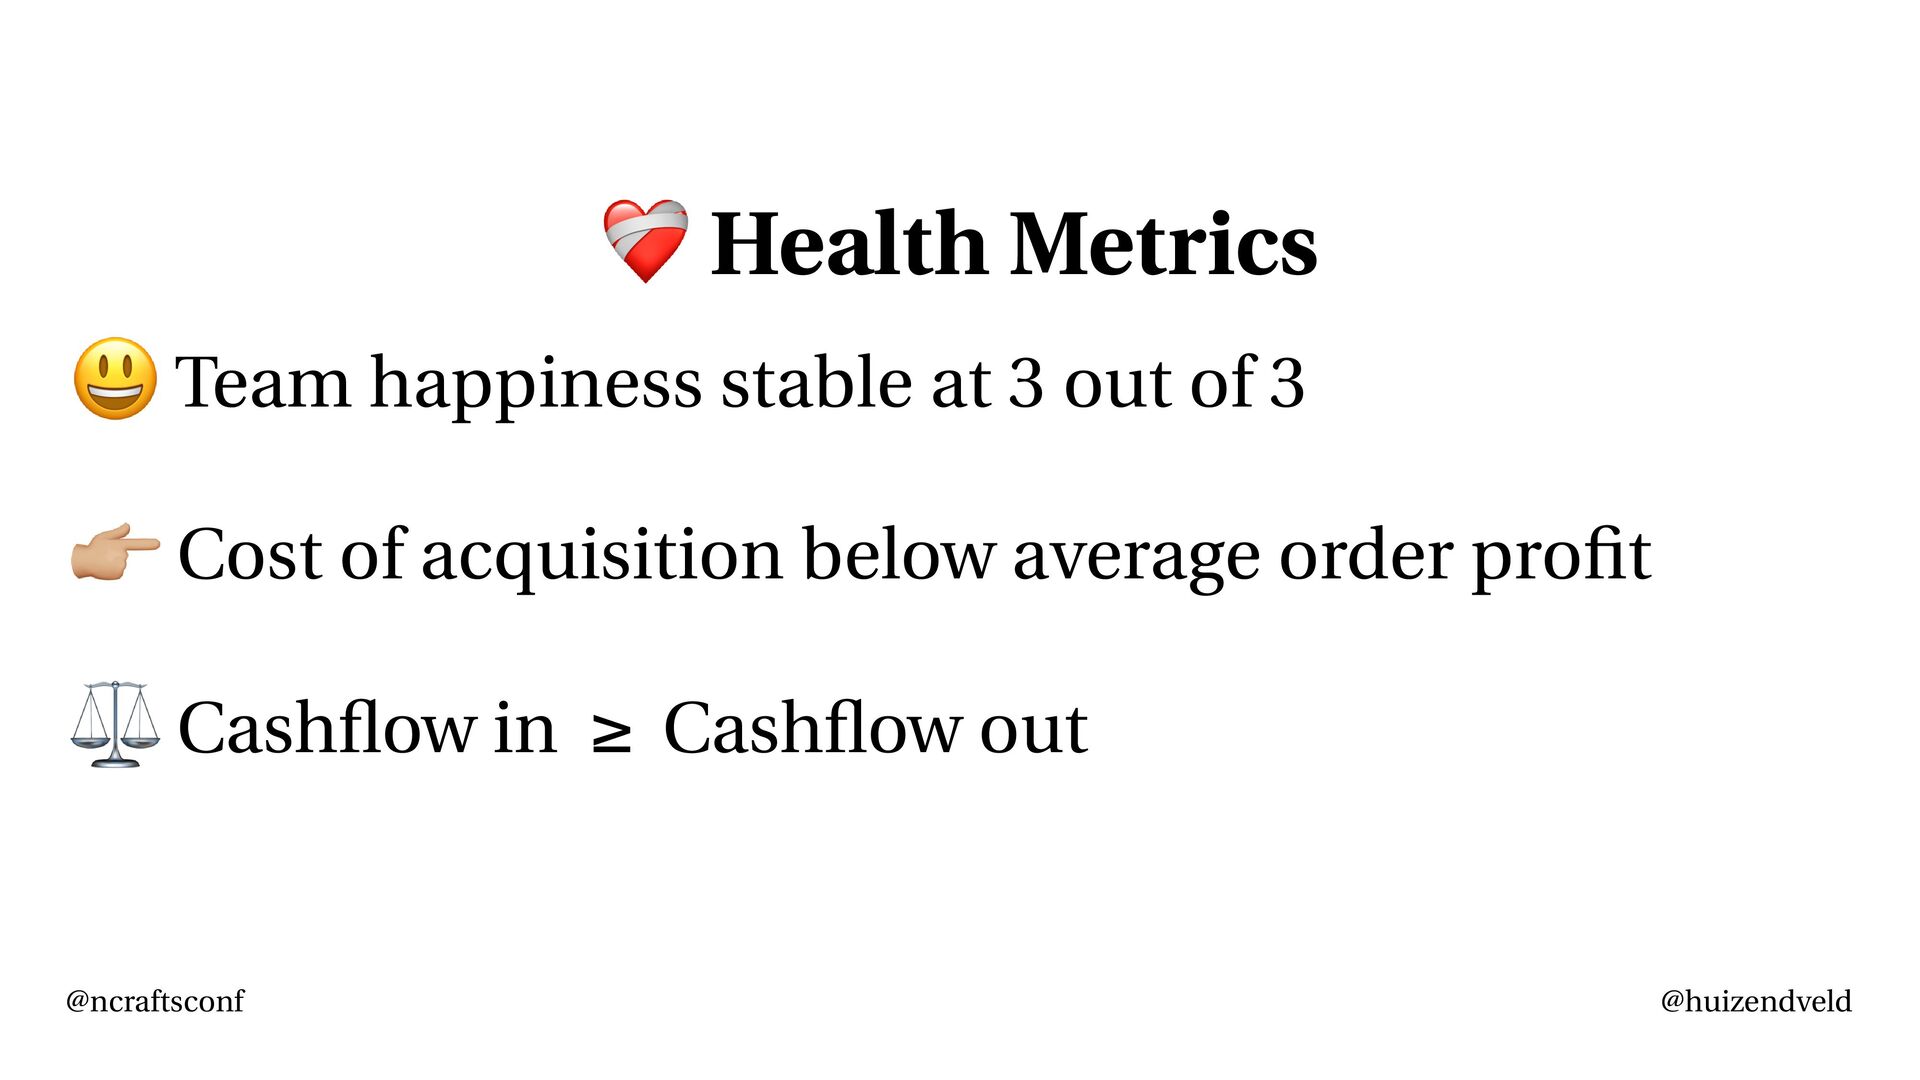
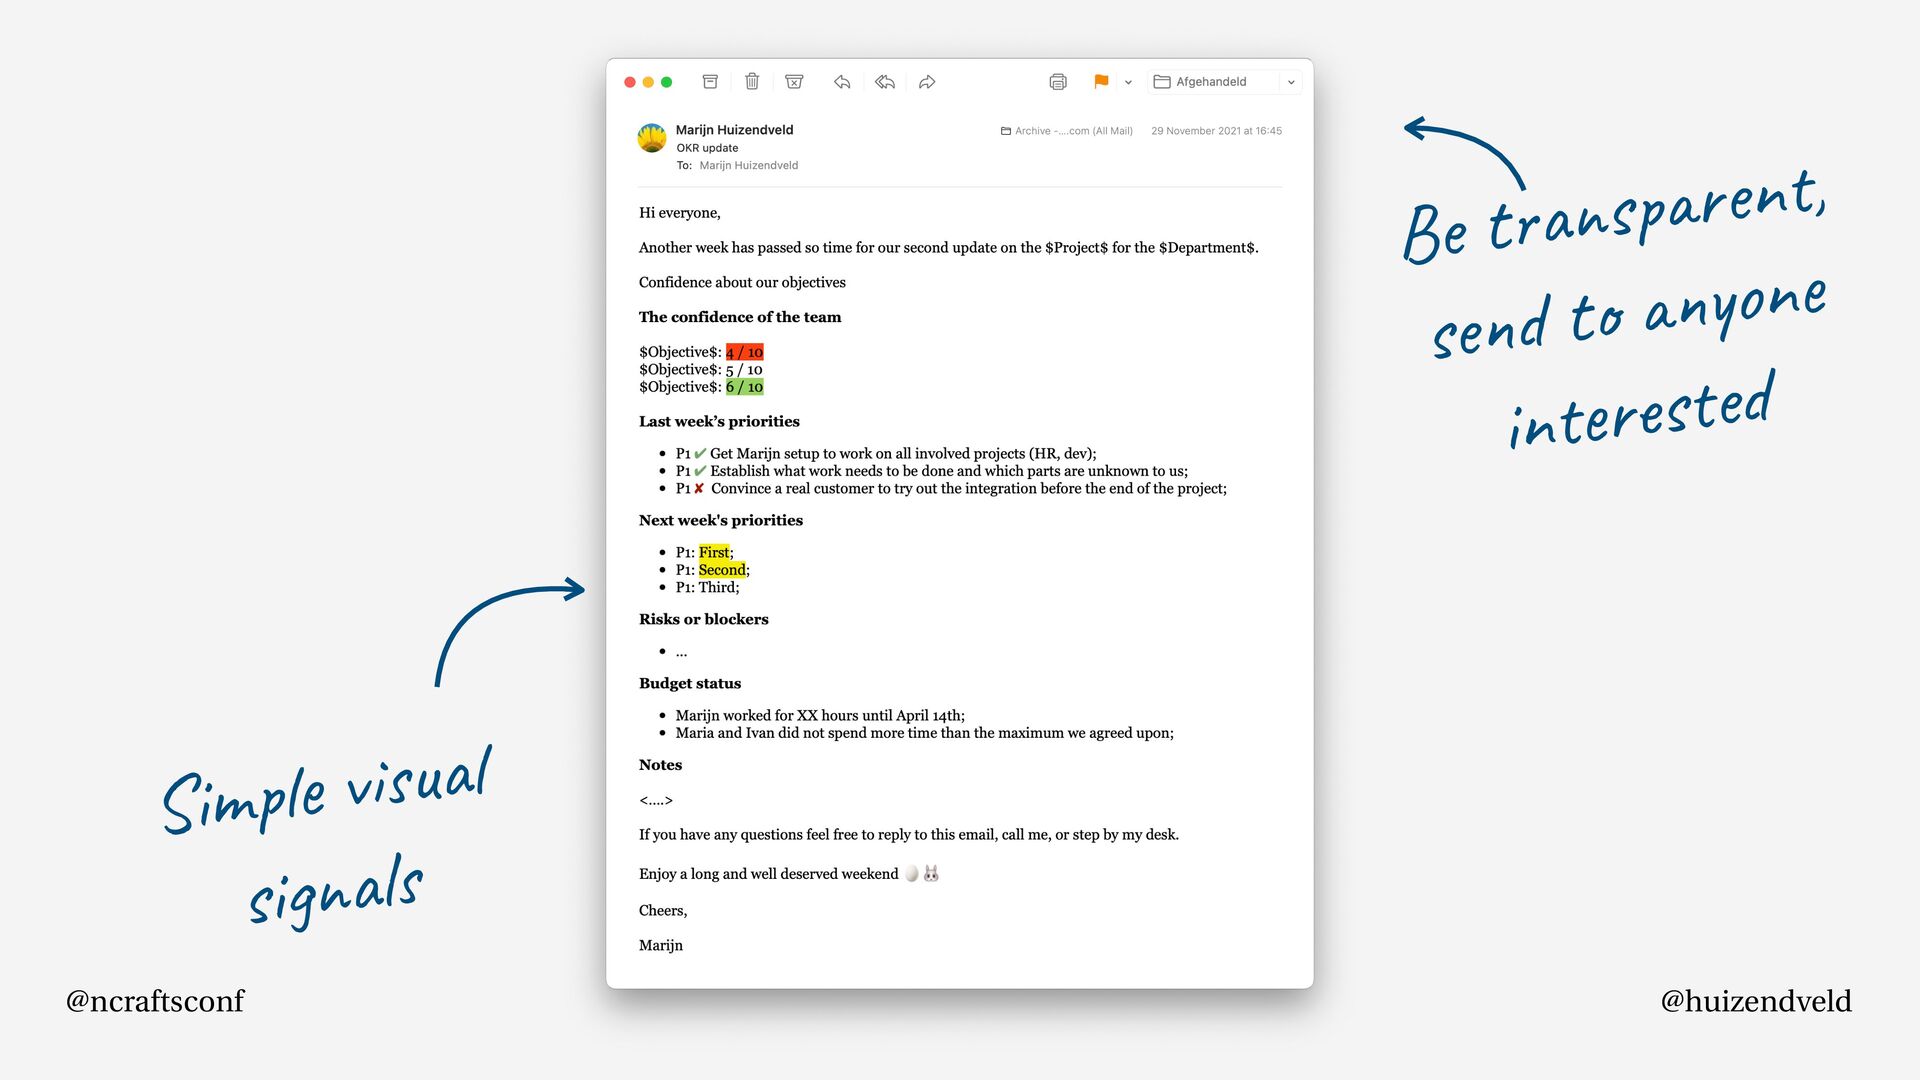
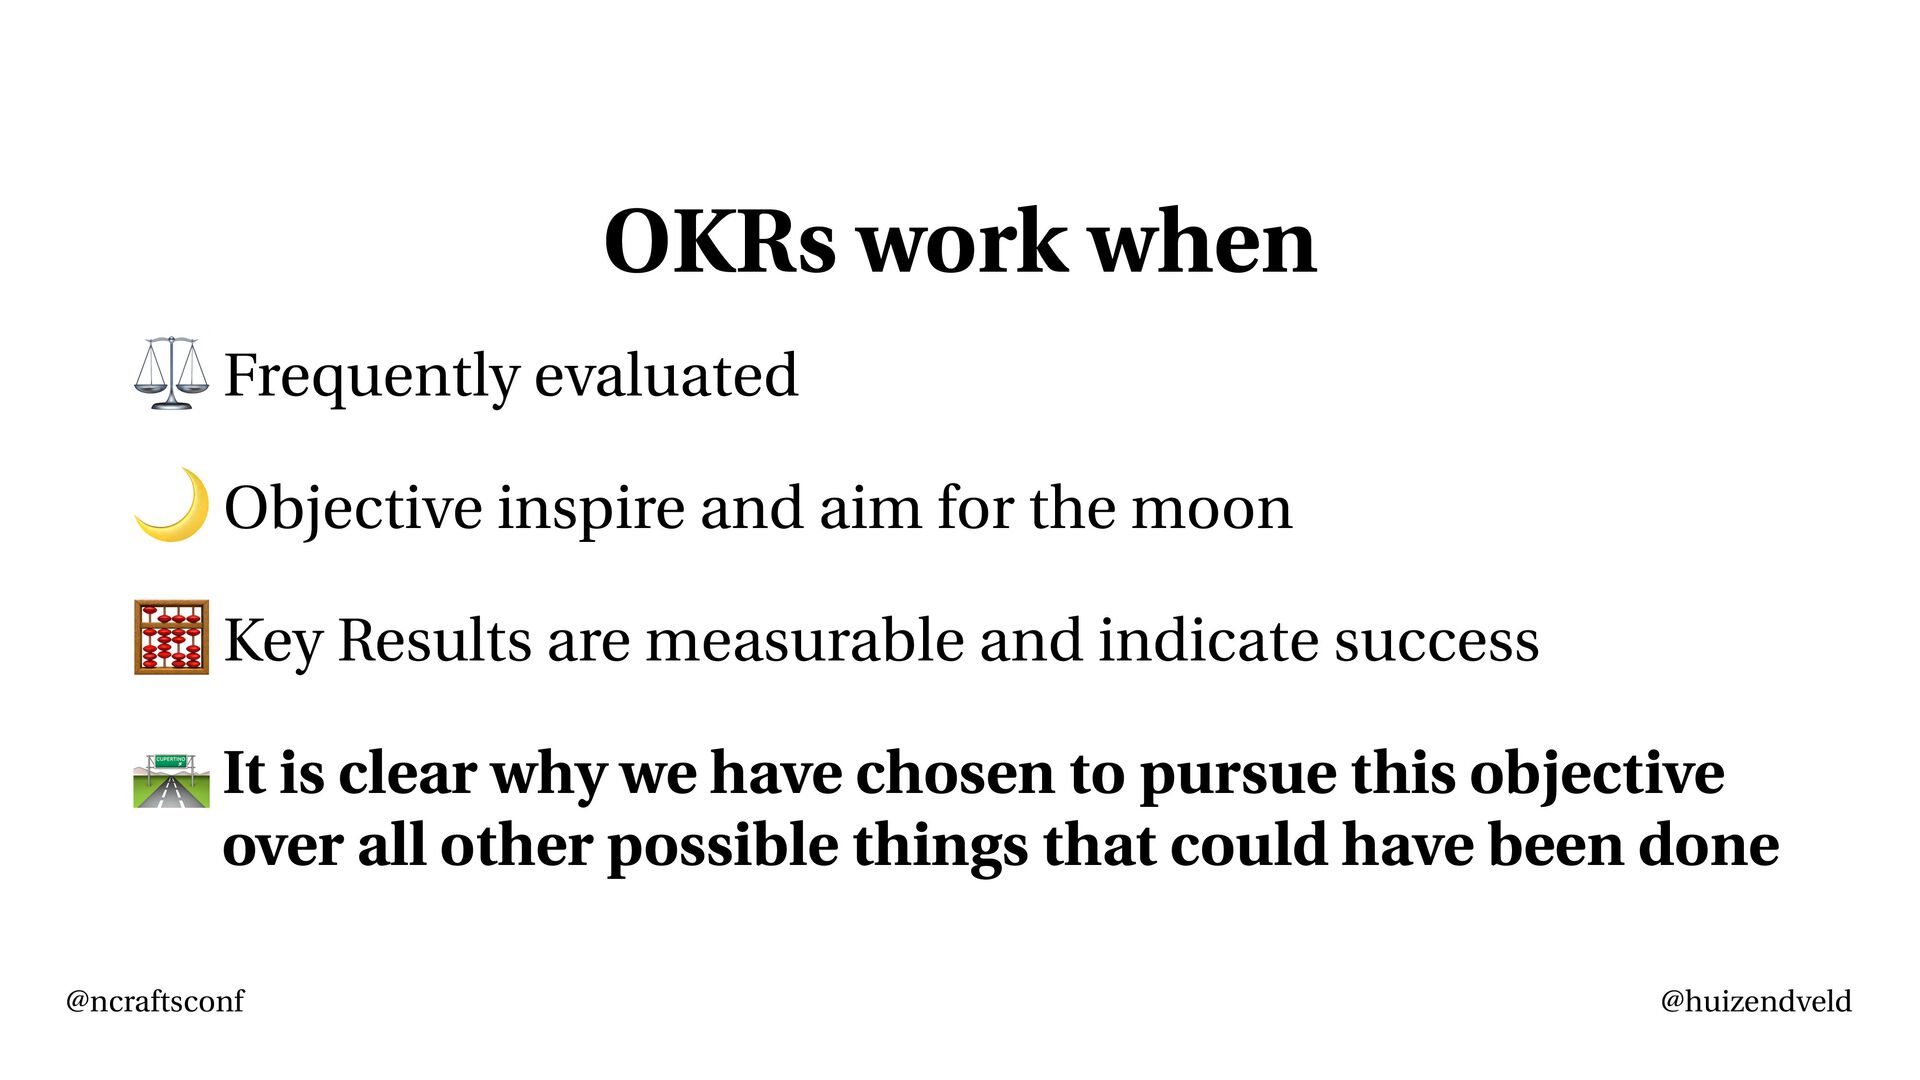
- To learn what constitutes a good Objective, Key Result, and Health Metric;
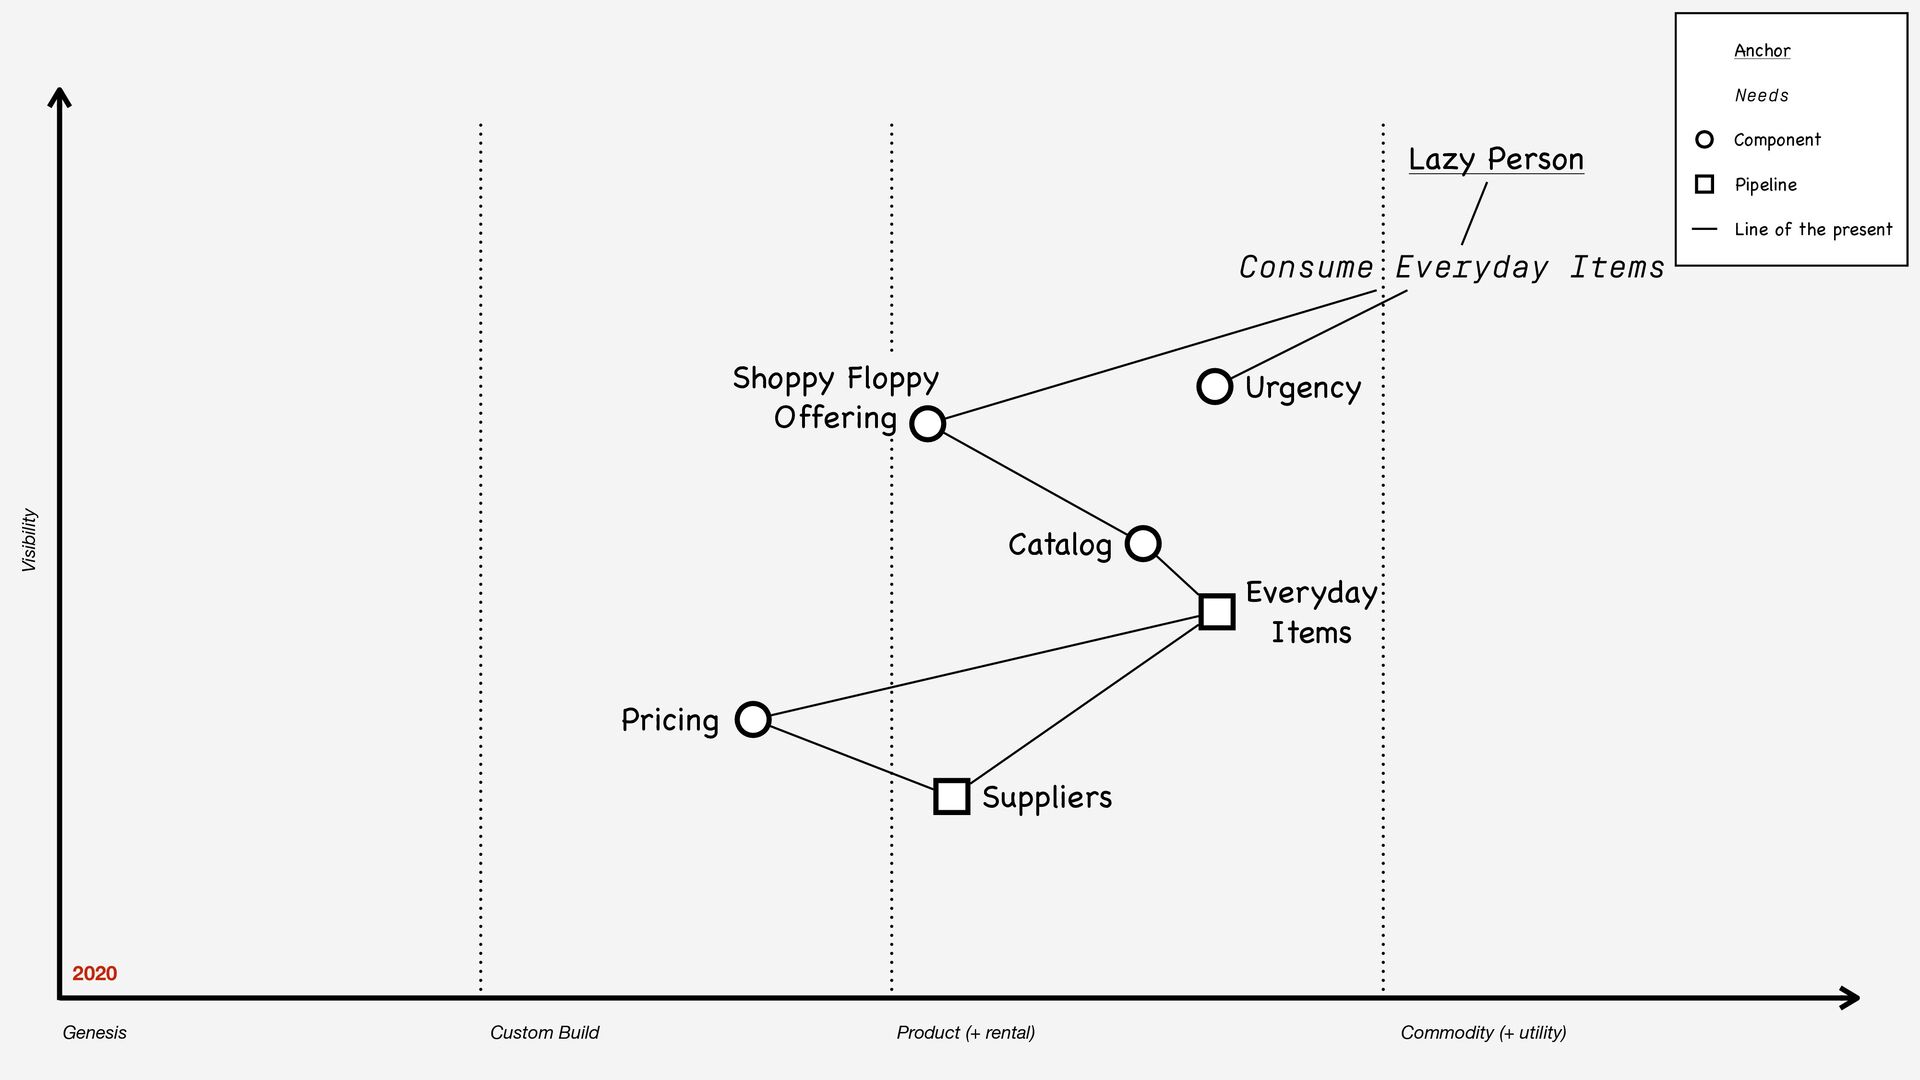
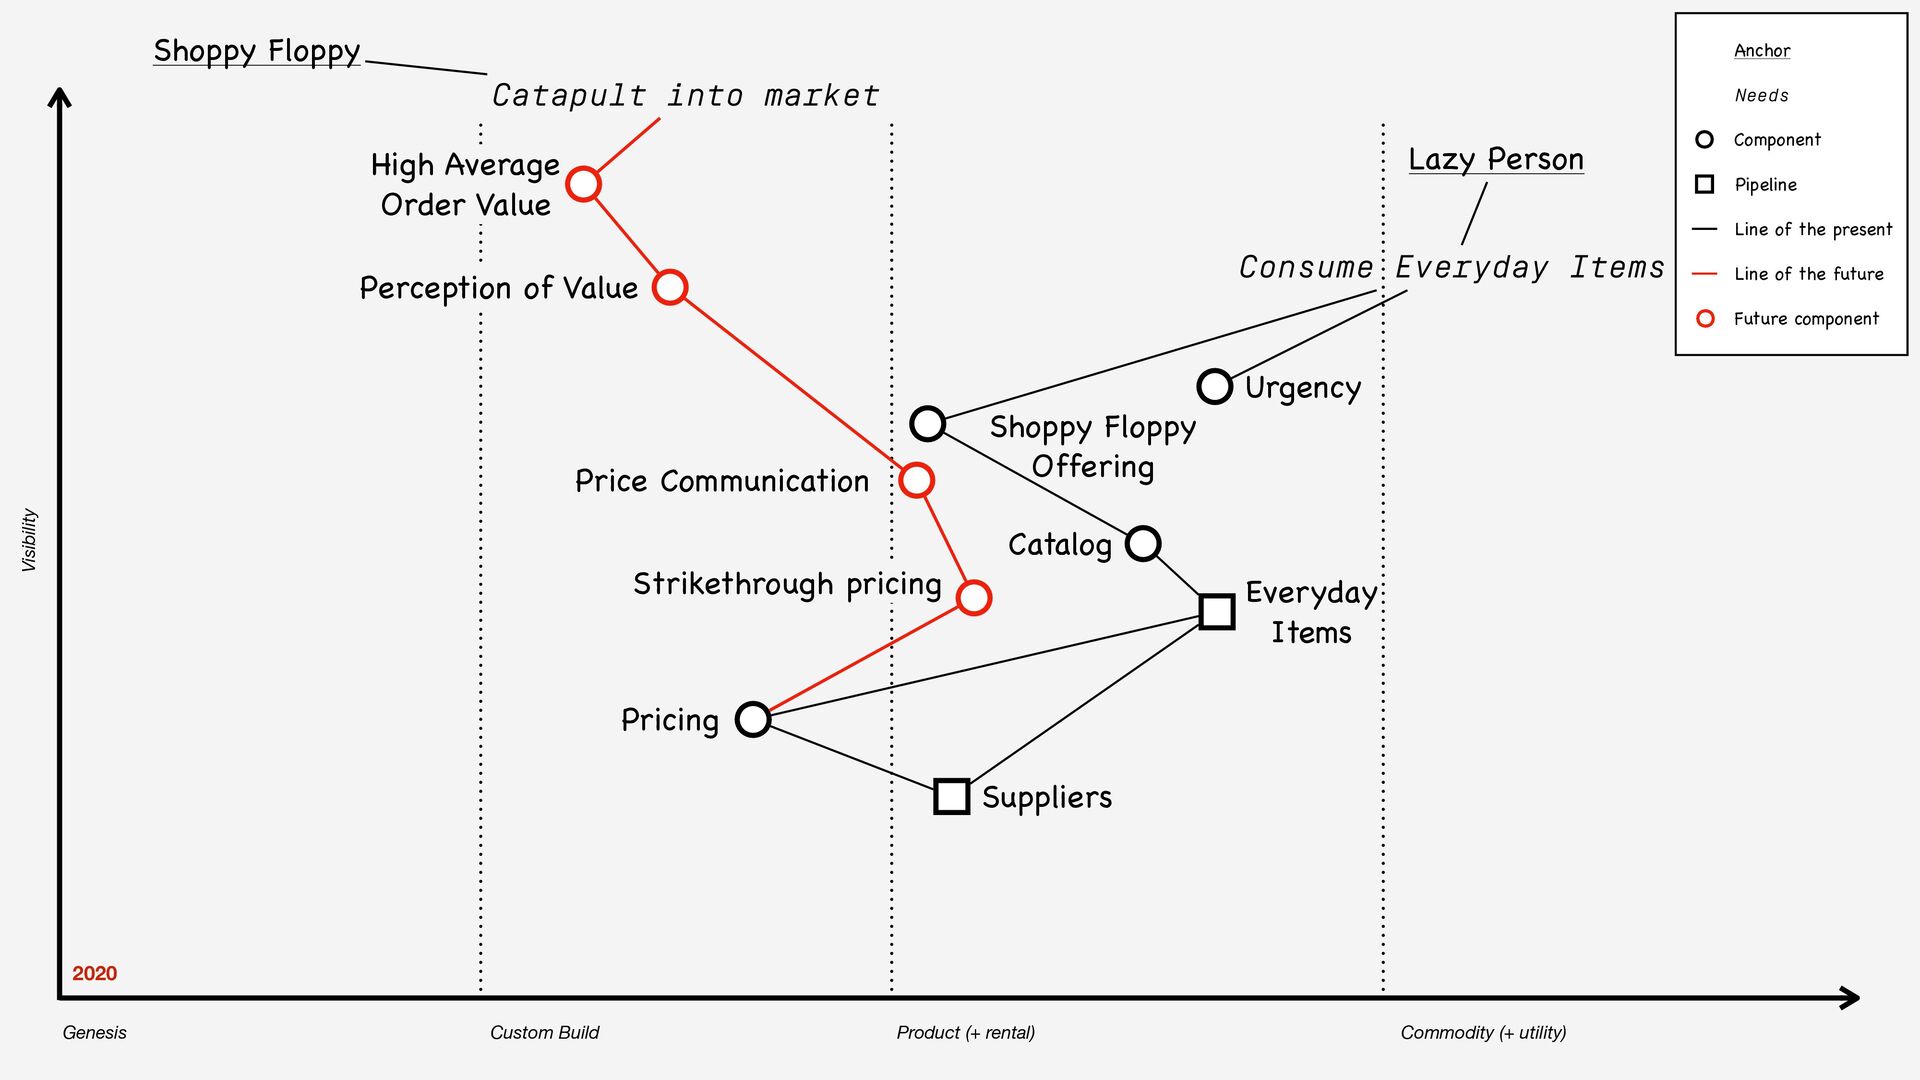
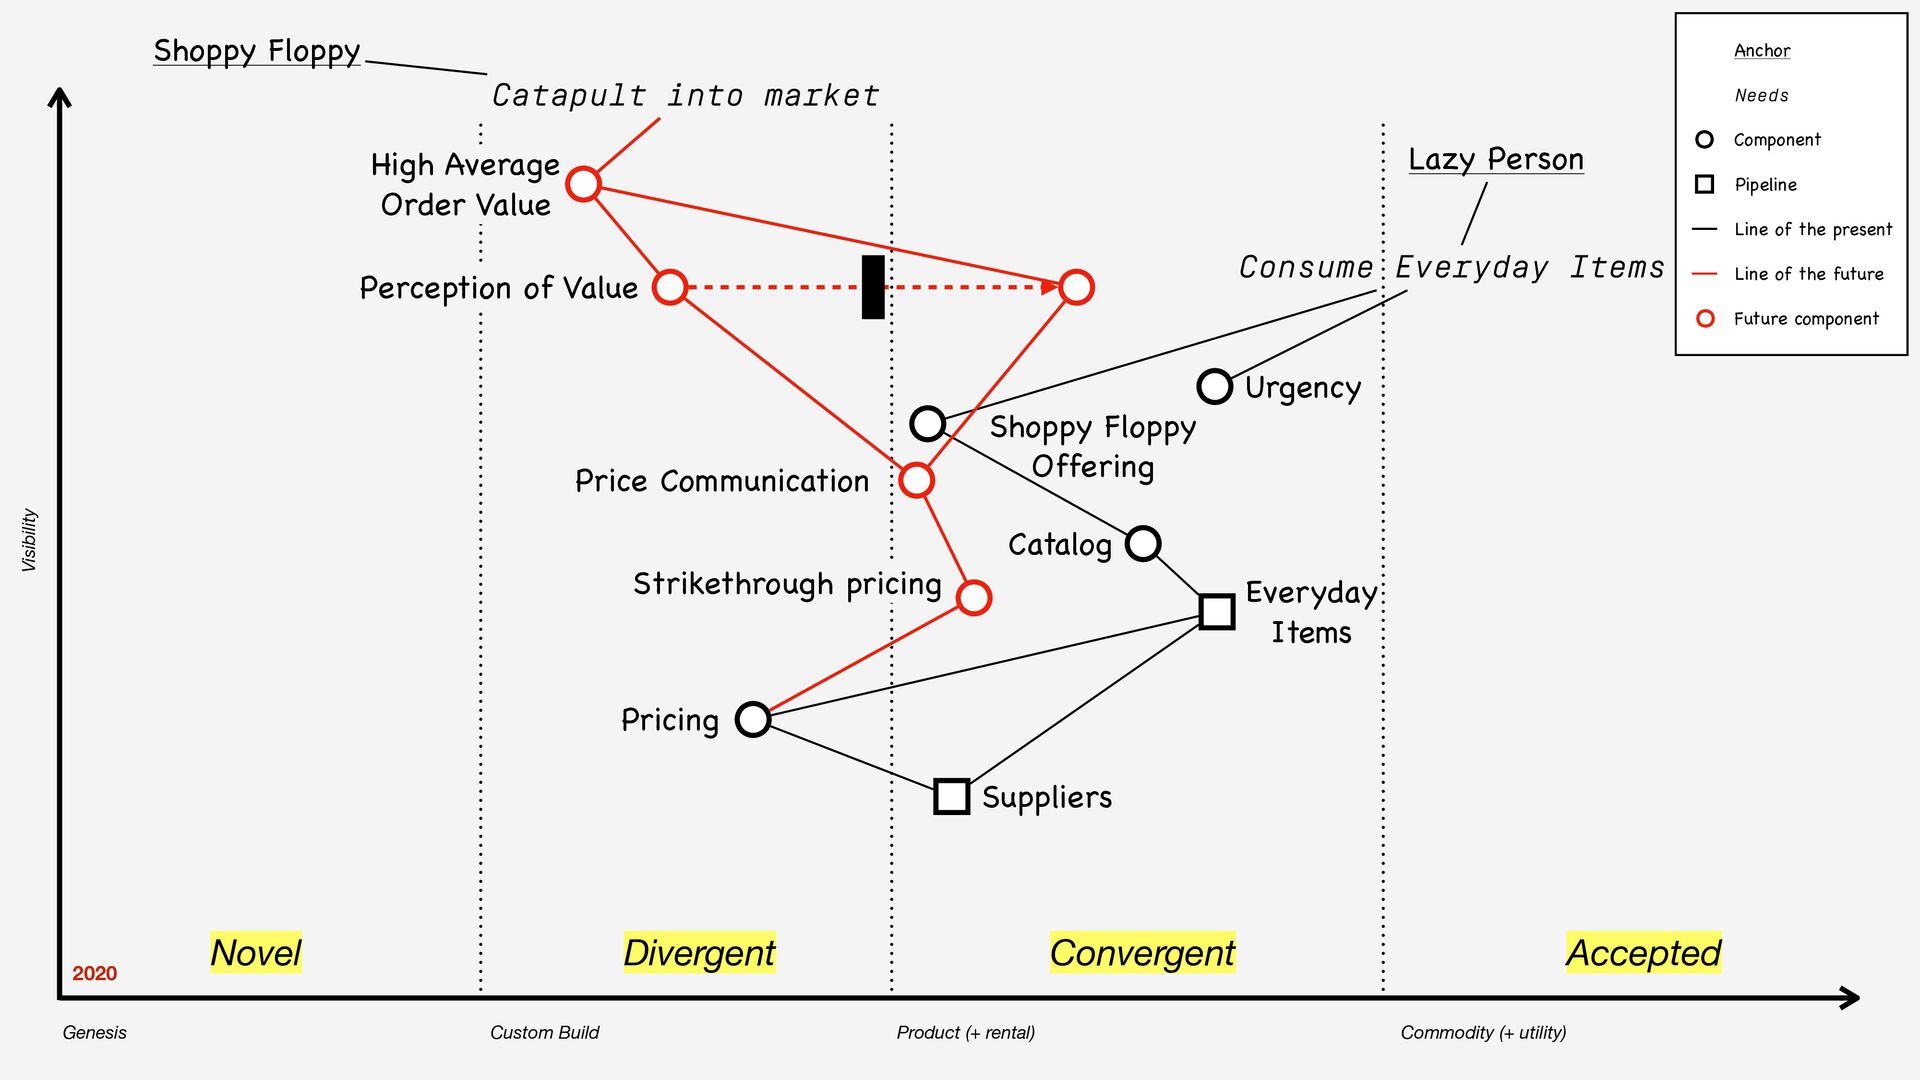
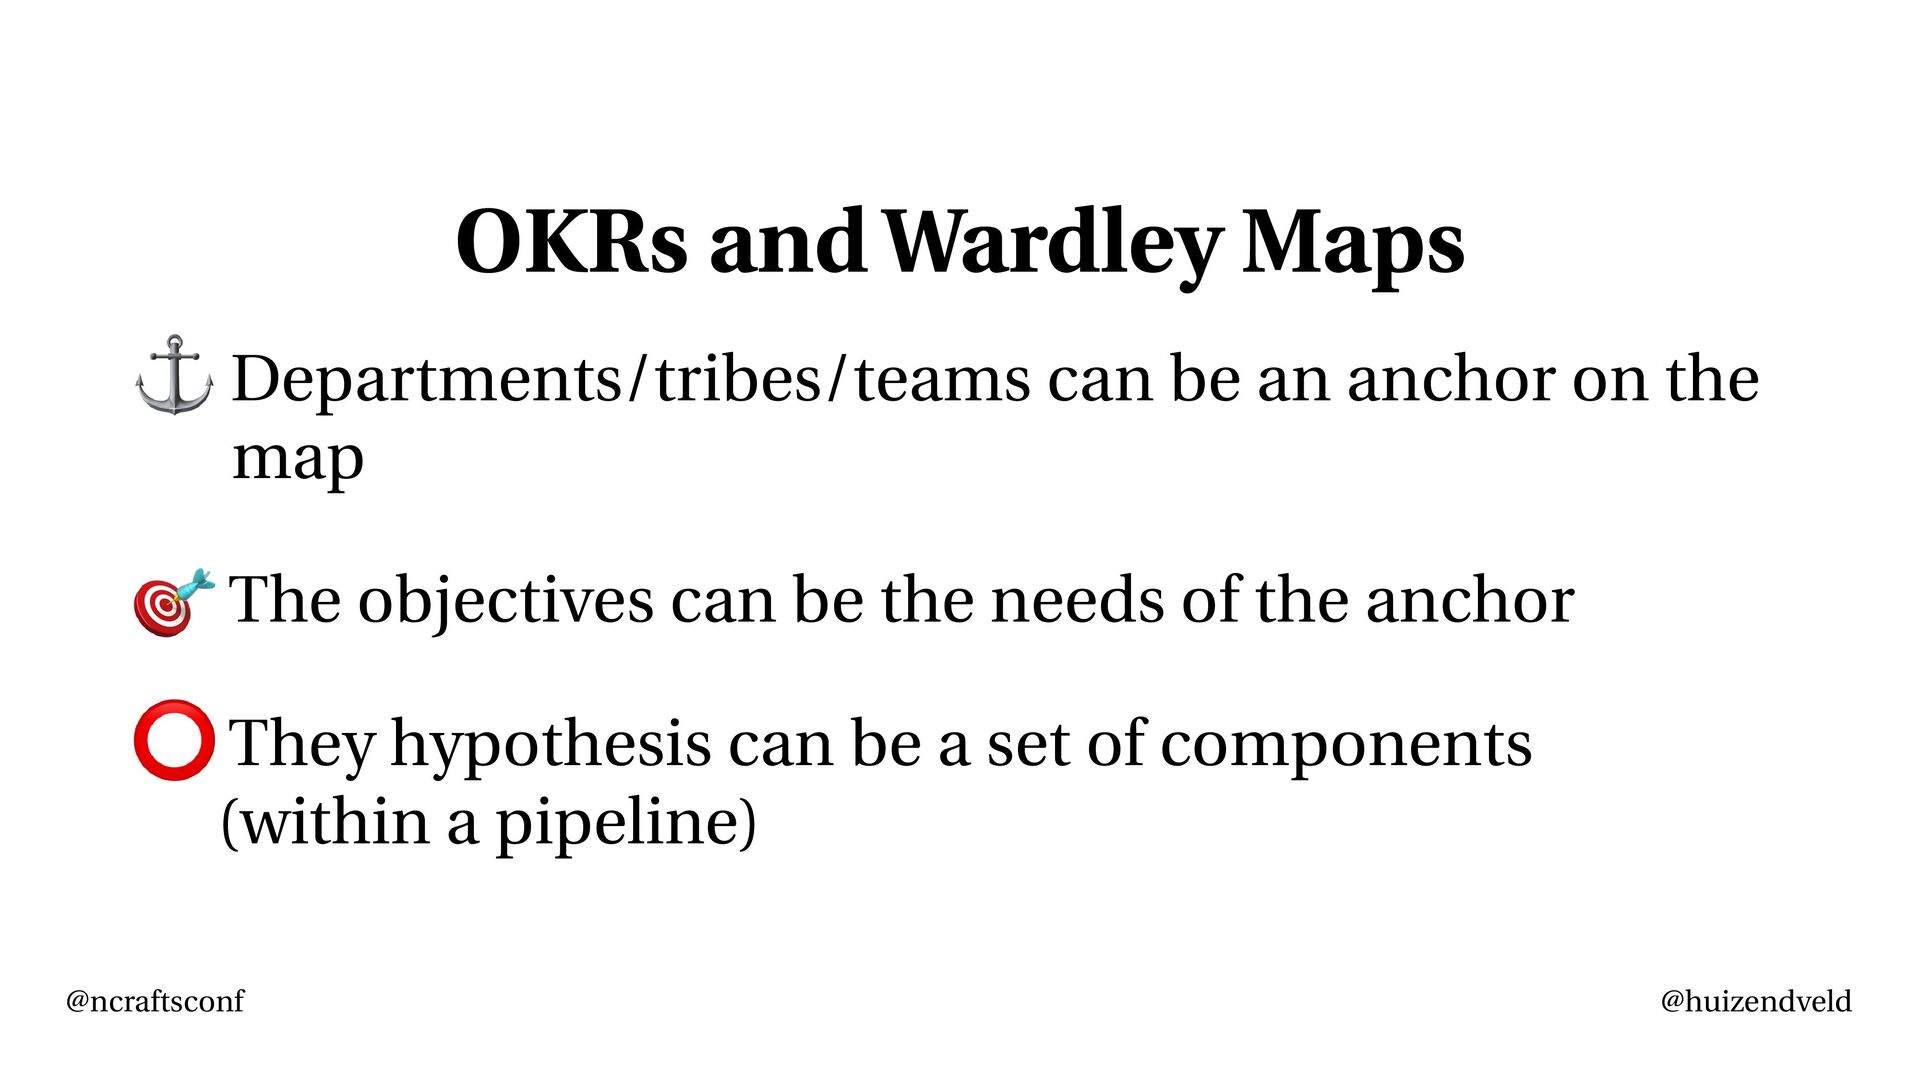
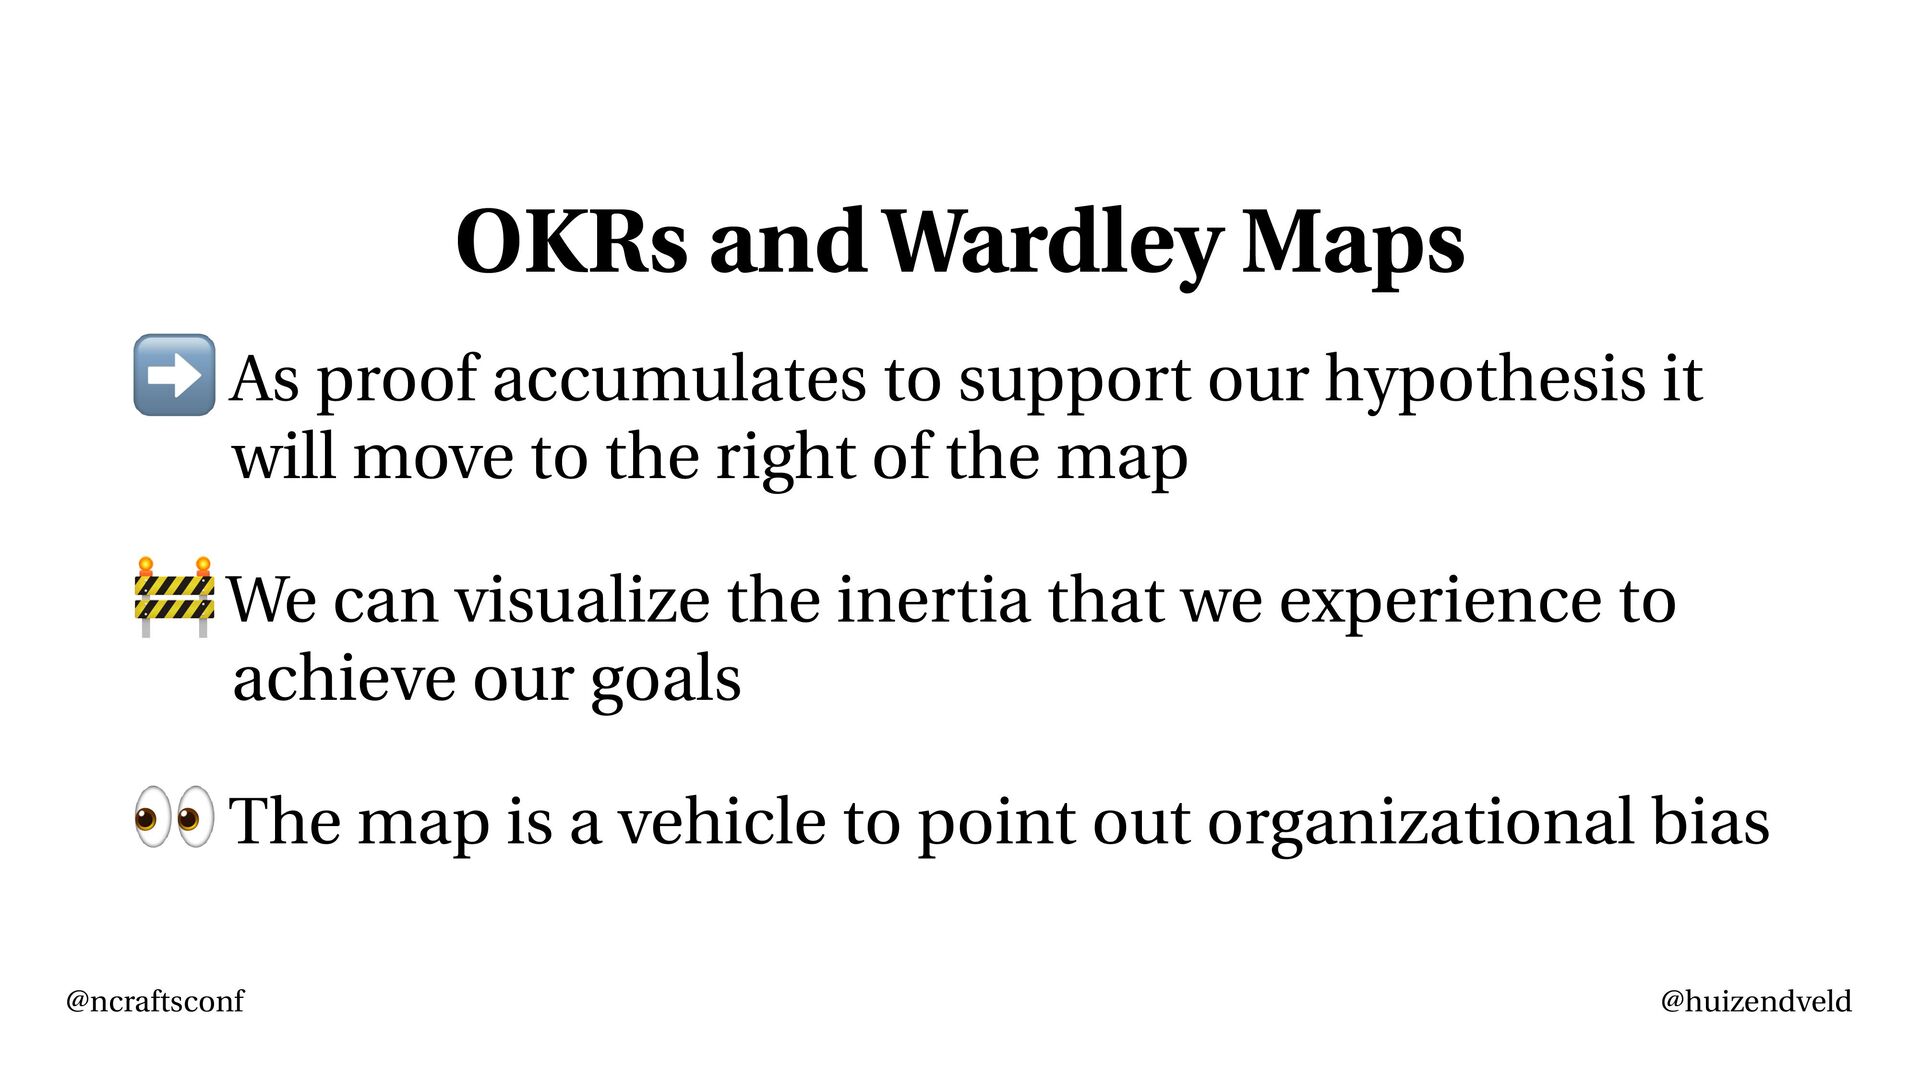
- To see how OKRs can be visualized in a Wardley Map;
- To capture heuristics that are helpful when mapping OKRs with a team;

Marijn Huizendveld

May 26, 2023
Tweet

More Decks by Marijn Huizendveld

Other Decks in Business

Transcript

  1. @huizendveld @ncraftsconf This talk is not for you if you

    want to learn about either OKRs or Wardley Maps. 
 This talk is about combining them.
  2. @huizendveld @ncraftsconf “Strategy is all about observing the landscape, understanding

    how it is changing, and using what resources you have to maximize your chances of success.” – Simon Wardley
  3. @huizendveld @ncraftsconf 🎯 Objective A big goal the team is

    so thrilled about 
 it makes them jump out of bed each morning
  4. @huizendveld @ncraftsconf ❤🩹 Health Metrics The metrics that tell us

    that we are sacri fi cing important assets in the process of achieving the objective
  5. @huizendveld @ncraftsconf You can mess up trying to achieve your

    goals many times, 
 But you can mess up your health only once.
  6. @huizendveld @ncraftsconf Finish the Phoenix Project Ob j e c

    t ives ar e ab out o ut c o m e, no t o ut pu t
  7. @huizendveld @ncraftsconf 📊 Key Results 💶 Revenue €100K within 30

    days after launch 👉 15% of customers refer friends & family ⭐ 250 ≥ reviews of which 80% is 4 out of 5 stars
  8. “ Yo u w i ll de cide yo ur

    ow n gr ad es ” “Ah, I se e … yo u h av e p asse d a ll y o ur e x a m s ”
  9. @huizendveld @ncraftsconf ❤🩹 Health Metrics 😃 Team happiness stable at

    3 out of 3 👉 Cost of acquisition below average order pro fi t ⚖ Cash fl ow in ≥ Cash fl ow out
  10. @huizendveld @ncraftsconf Sim pl e v is u al si

    gna l s Be t ran s par en t , se nd t o an y on e in t er e s t e d
  11. @huizendveld @ncraftsconf Tell me, you have to go somewhere: 


 What are the fi rst apps you open on your smartphone?
  12. Visibility Close to user Far away from user Component Anchor

    Lazy Person Consume Everyday Items Urgency Shoppy Floppy 
 Offering Catalog Everyday Items Line of the present Pricing Suppliers Needs
  13. Visibility Close to user Far away from user Component Anchor

    Lazy Person Consume Everyday Items Urgency Shoppy Floppy 
 Offering Catalog Everyday Items Line of the present Pricing Suppliers Needs
  14. Visibility Close to user Far away from user Component Pipeline

    Anchor Lazy Person Consume Everyday Items Urgency Shoppy Floppy 
 Offering Catalog Everyday Items Line of the present Pricing Suppliers Needs
  15. Visibility Genesis Custom Build Product (+ rental) Commodity (+ utility)

    2020 Component Pipeline Anchor Lazy Person Consume Everyday Items Urgency Shoppy Floppy 
 Offering Catalog Everyday Items Line of the present Pricing Suppliers Needs
  16. Visibility Genesis Custom Build Product (+ rental) Commodity (+ utility)

    2020 Component Pipeline Anchor Lazy Person Consume Everyday Items Urgency Shoppy Floppy 
 Offering Catalog Everyday Items Line of the present Pricing Suppliers Needs HIV test Coffee Eggs Covid tests
  17. @huizendveld @ncraftsconf How to make a map ✓Identify the user

    (the anchor of the map) ✓List the relevant needs of that user below ✓Ask “what component is needed?” in order to satisfy that user need ✓Put components on the axis of evolution ✓Everything evolves: genesis > custom build > product > commodity
  18. @huizendveld @ncraftsconf Wardley Mapping our ecosystem ✓By mapping we make

    assumptions explicit ✓Maps make it easier to challenge the strategy ✓Maps allow us to ask: “Why here over there?” ✓Di ff erent areas of the map need di ff erent skills and attitudes ✓Trace the value chain to understand risk and impact on the end user
  19. Visibility Genesis Custom Build Product (+ rental) Commodity (+ utility)

    2020 Lazy Person Consume Everyday Items Urgency Shoppy Floppy 
 Offering Catalog Everyday Items Pricing Suppliers Shoppy Floppy Catapult into market High Average 
 Order Value Perception of Value Price Communication Strikethrough pricing Component Pipeline Anchor Line of the present Needs Line of the future Future component
  20. Visibility Genesis Custom Build Product (+ rental) Commodity (+ utility)

    2020 Lazy Person Consume Everyday Items Urgency Shoppy Floppy 
 Offering Catalog Everyday Items Pricing Suppliers Shoppy Floppy Catapult into market High Average 
 Order Value Perception of Value Price Communication Strikethrough pricing Component Pipeline Anchor Line of the present Needs Line of the future Future component
  21. Visibility Genesis Custom Build Product (+ rental) Commodity (+ utility)

    2020 Component Pipeline Anchor Lazy Person Consume Everyday Items Urgency Shoppy Floppy 
 Offering Catalog Everyday Items Line of the present Pricing Suppliers Needs Shoppy Floppy Catapult into market High Average 
 Order Value Perception of Value Price Communication Strikethrough pricing Line of the future Future component Novel Divergent Convergent Accepted
  22. @huizendveld @ncraftsconf OKRs and Wardley Maps ⚓ Departments/tribes/teams can be

    an anchor on the 
 map 🎯 The objectives can be the needs of the anchor ⭕ They hypothesis can be a set of components 
 (within a pipeline)
  23. @huizendveld @ncraftsconf OKRs and Wardley Maps ➡ As proof accumulates

    to support our hypothesis it 
 will move to the right of the map 🚧 We can visualize the inertia that we experience to 
 achieve our goals 👀 The map is a vehicle to point out organizational bias
  24. @huizendveld @ncraftsconf OKRs work when ⚖ Frequently evaluated 🌙 Objective

    inspire and aim for the moon 🧮 Key Results are measurable and indicate success 🛣 It is clear why we have chosen to pursue this objective 
 over all other possible things that could have been done
  25. @huizendveld @ncraftsconf Combine OKRs with Maps to 🗺 Articulate business-

    and technical strategy into a single picture ⛏ Uncover assumption below decisions ✋ Make it easier for people to challenge 🗣 Unify language between tech teams and stakeholders 📣 Share knowledge within the organization
  26. Eager to learn more? [email protected] @huizendveld Anthony Fokkerweg 3 -

    1059 CM Amsterdam - The Netherlands Reach out for links to additional reference material and any questions you may have.