Upgrade to Pro — share decks privately, control downloads, hide ads and more …

Graphite & Friends

Sponsored · Your Podcast. Everywhere. Effortlessly. Share. Educate. Inspire. Entertain. You do you. We'll handle the rest. →

Graphite & Friends

A talk about Graphite, it’s quirks, some tips for using, xmanaging and scaling it and some systems which integrate with it.

Mark Crossfield

April 29, 2014

Transcript

161 slides
  1. Structure ☑ Why I’m here & what I’ll cover ☐

    Context ☐ Monitoring ☐ Graphite ☐ Tips ☐ Managing / Scaling ☐ Feeding ☐ Front Ends
  2. http://blog.tagman.com/2012/03/just-one-second-delay-in-page-load-can-cause-7-loss-in-customer-conversions/ One Second Delay In Page-Load Can Cause 
 7%

    Loss In Customer Conversions “ ” 47% of consumers expect a page to load in 2 seconds or less “
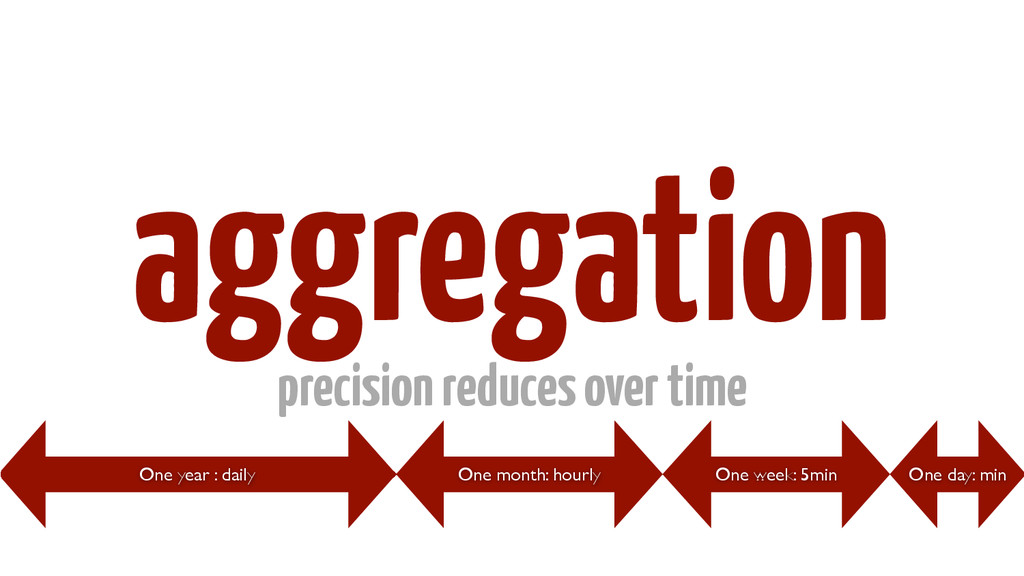
  3. aggregation precision reduces over time One year : daily One

    month: hourly One week: 5min One day: min
  4. carbon limits writing new metrics avoids swamping disk with write

    IO http://obfuscurity.com/2012/04/Unhelpful-Graphite-Tip-9
  5. graphite bookmarklet useful to load charts from images if your

    Graphite version is behind the times http://obfuscurity.com/2012/04/Unhelpful-Graphite-Tip-2
  6. timeShift(series, duration) e.g. show yesterday’s metric against today’s timeShift(“apache.http.requests”, “-1day”)

    http://graphite.readthedocs.org/en/0.9.12/functions.html#graphite.render.functions.timeShift
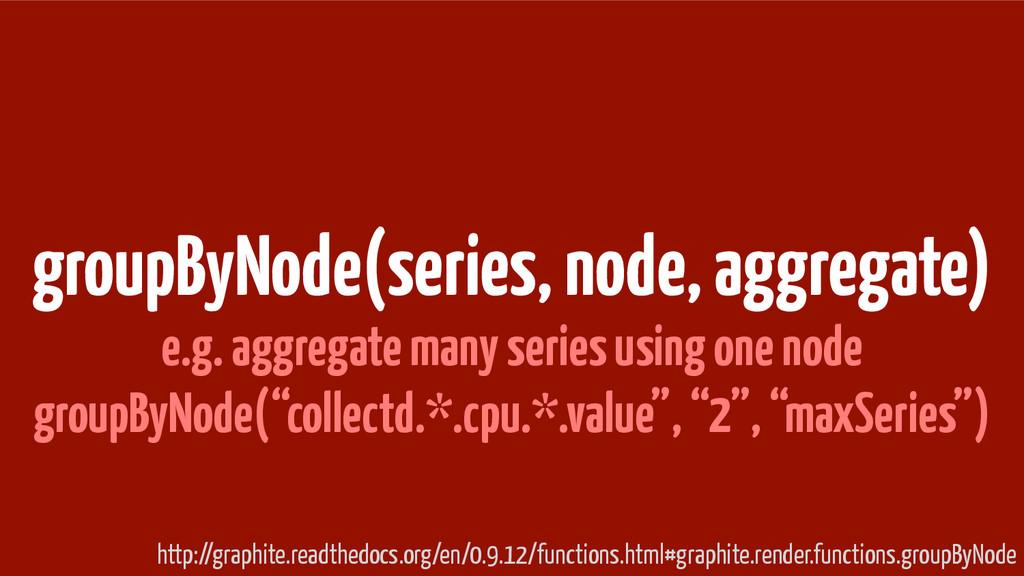
  7. groupByNode(series, node, aggregate) e.g. aggregate many series using one node

    groupByNode(“collectd.*.cpu.*.value”, “2”, “maxSeries”) http://graphite.readthedocs.org/en/0.9.12/functions.html#graphite.render.functions.groupByNode
  8. cumulative(seriesList) show how a rate (e.g. per sec) adds up

    over the day http://graphite.readthedocs.org/en/0.9.12/functions.html#graphite.render.functions.cumulative
  9. teatime is 4pm Graphite understands the UNIX At time specification

    e.g. noon yesterday, now-2weeks http://oss.oetiker.ch/rrdtool/doc/rrdfetch.en.html#IAT_STYLE_TIME_SPECIFICATION
  10. monitor carbon carbon records it’s own metrics per minute to

    graphite http://obfuscurity.com/2012/06/Watching-the-Carbon-Feed
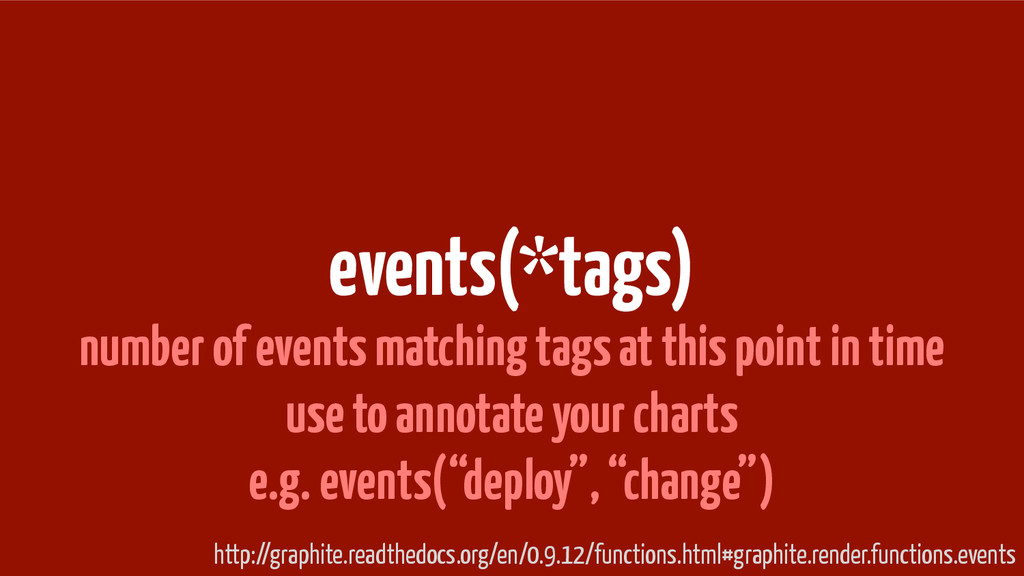
  11. events(*tags) number of events matching tags at this point in

    time use to annotate your charts e.g. events(“deploy”, “change”) http://graphite.readthedocs.org/en/0.9.12/functions.html#graphite.render.functions.events
  12. label your axes, before it is too late talk about

    units, frequencies, and include in the metric name

More Decks by Mark Crossfield

Other Decks in Technology