Upgrade to Pro — share decks privately, control downloads, hide ads and more …

AAPG Kaggle Internal Competition

AAPG Kaggle Internal Competition

Talk about my Kaggle winner model at the Predictive Modeling Forum. Boston, Massachusetts. October 1-2, 2014

Marcos Aguilera Keyser

March 17, 2017
Tweet

More Decks by Marcos Aguilera Keyser

Other Decks in Technology

Transcript

  1. 1 Kaggle 2014: Liberty Mutual Group - Fire Peril Loss

    Cost Team name: LM_Lucinda Team members: Marcos Aguilera Keyser Country Office: Liberty Spain 1st/21 LMG teams and 36th/634 teams overall position – top 6%
  2. 2 Agenda § Competition Summary § Data Description § Challenges

    § Objectives § Approach § Feature Engineering § Variable Selection § Algorithm § Model Validation § Model Selection § Conclusions
  3. 3 Competition Summary § Kaggle is a platform for predictive

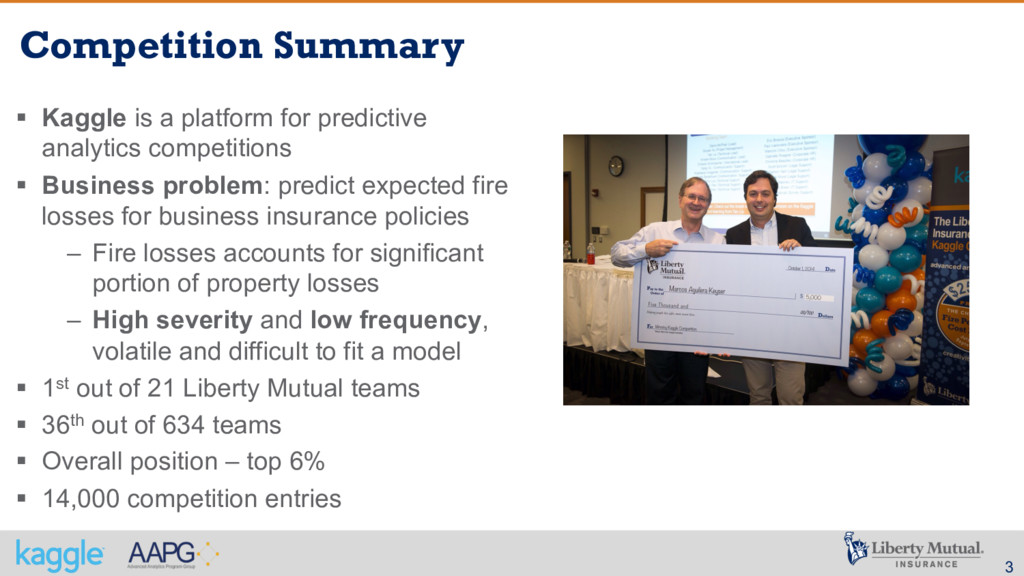
    analytics competitions § Business problem: predict expected fire losses for business insurance policies – Fire losses accounts for significant portion of property losses – High severity and low frequency, volatile and difficult to fit a model § 1st out of 21 Liberty Mutual teams § 36th out of 634 teams § Overall position – top 6% § 14,000 competition entries
  4. 4 Agenda § Competition Summary § Data Description § Challenges

    § Objectives § Approach § Feature Engineering § Variable Selection § Algorithm § Model Validation § Model Selection § Conclusions
  5. 5 Data Description § Data points: 1 million § Features:

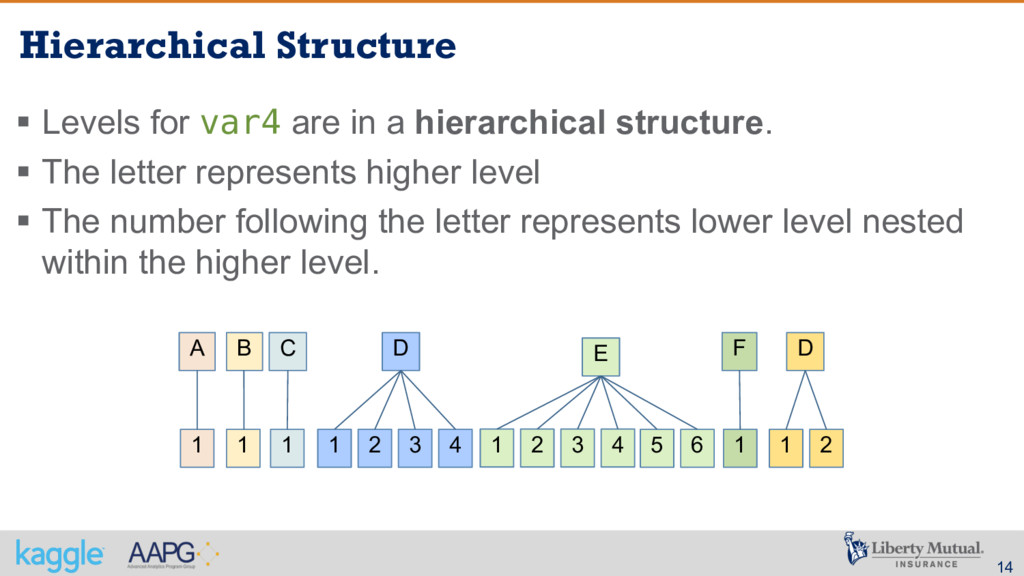
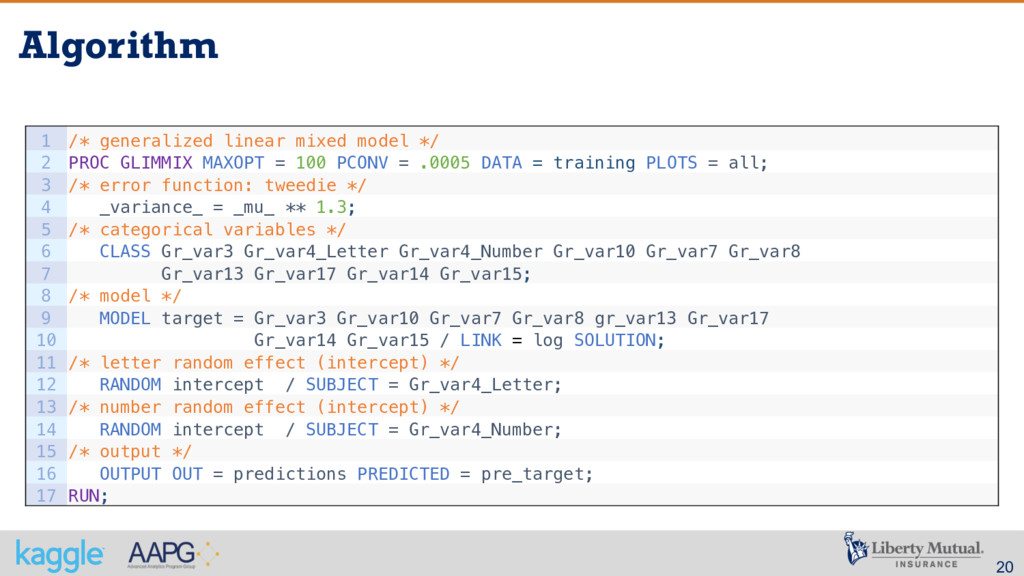
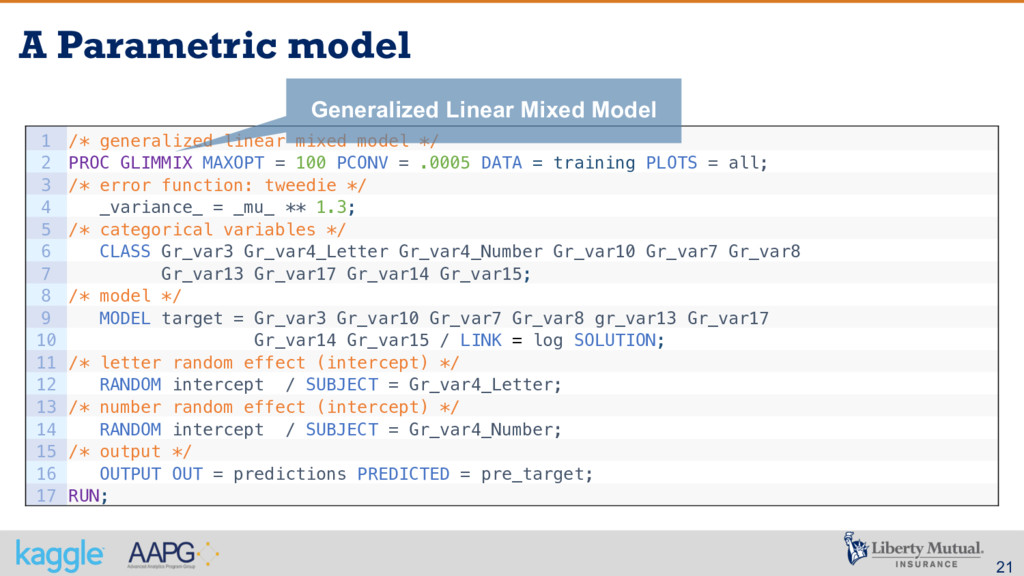
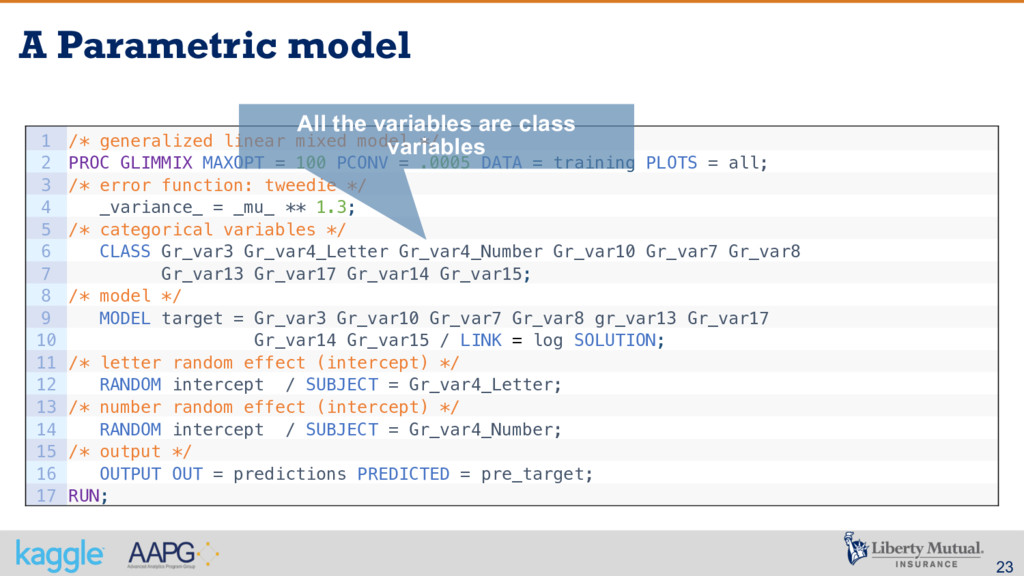
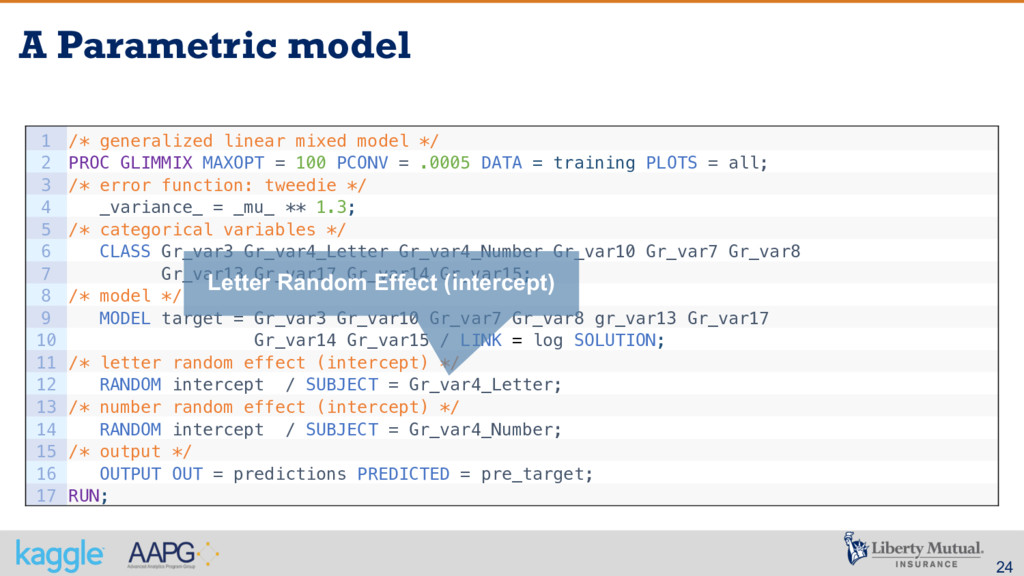
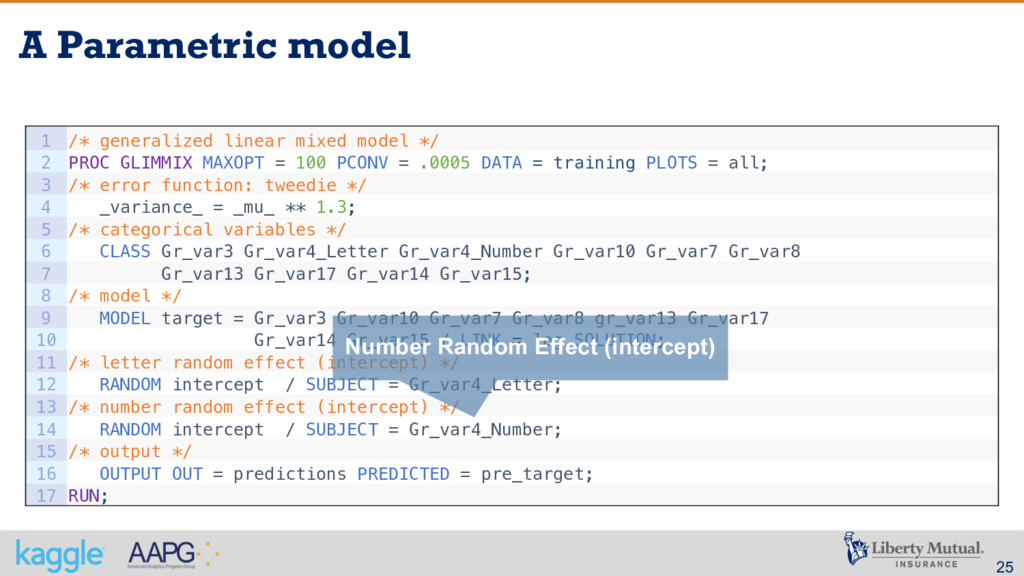
    300 – target: a transformed ratio of loss to total insured value – var1 – var17: A set of normalized variables representing policy characteristics – crimeVar1 – crimeVar9: A set of normalized Crime Rate variables – geodemVar1 – geodemVar37: A set of normalized geodemographic variables – weatherVar1 – weatherVar236: A set of normalized weather station variables – Levels for var4 are in a hierarchical structure. The letter represents higher level and the number following the letter represents lower level nested within the higher level.
  6. 6 Agenda § Competition Summary § Data Description § Challenges

    § Objectives § Approach § Feature Engineering § Variable Selection § Algorithm § Model Validation § Model Selection § Conclusions
  7. 7 Challenges § Low frequency: 0.263% losses (1188 training) §

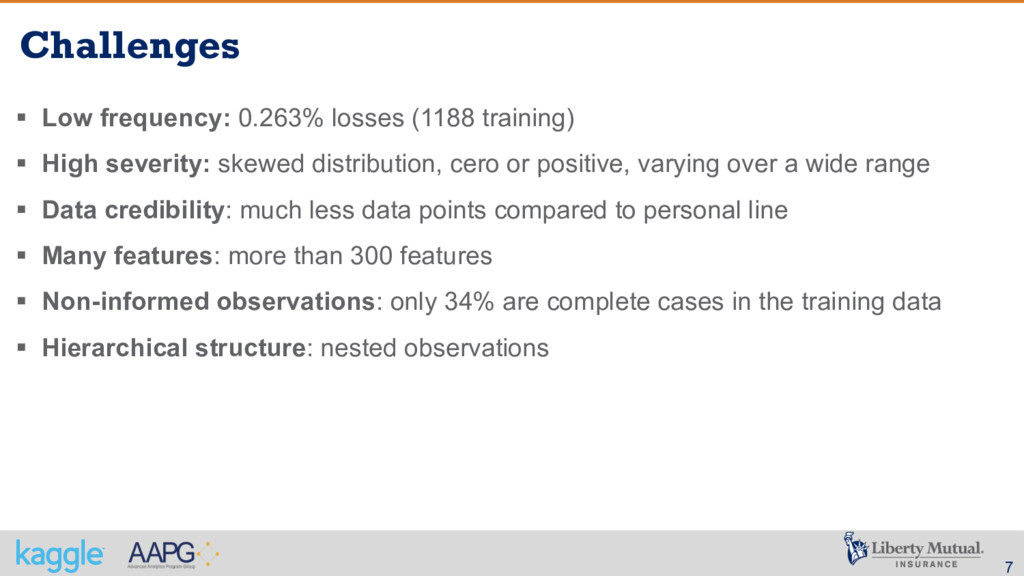
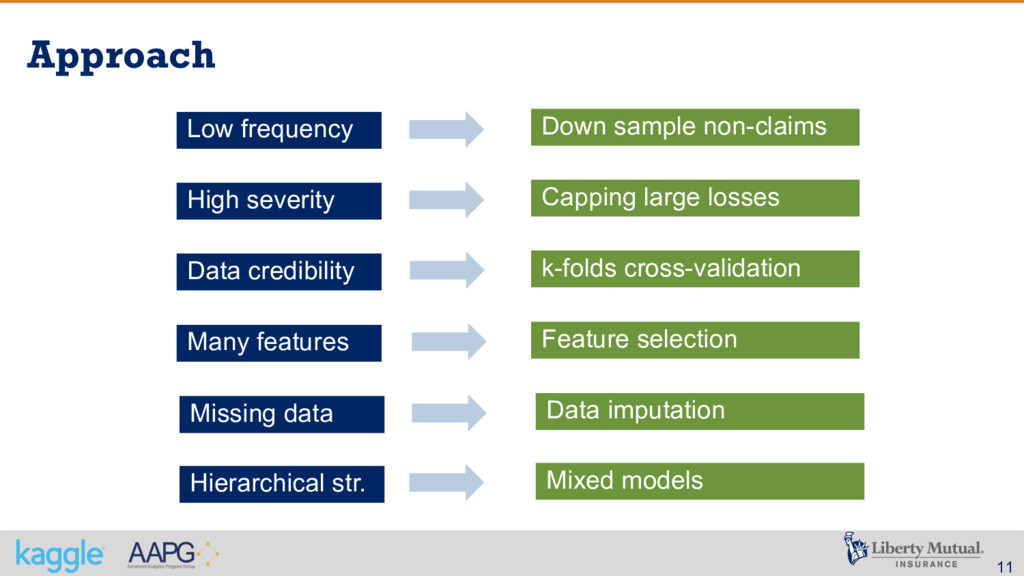
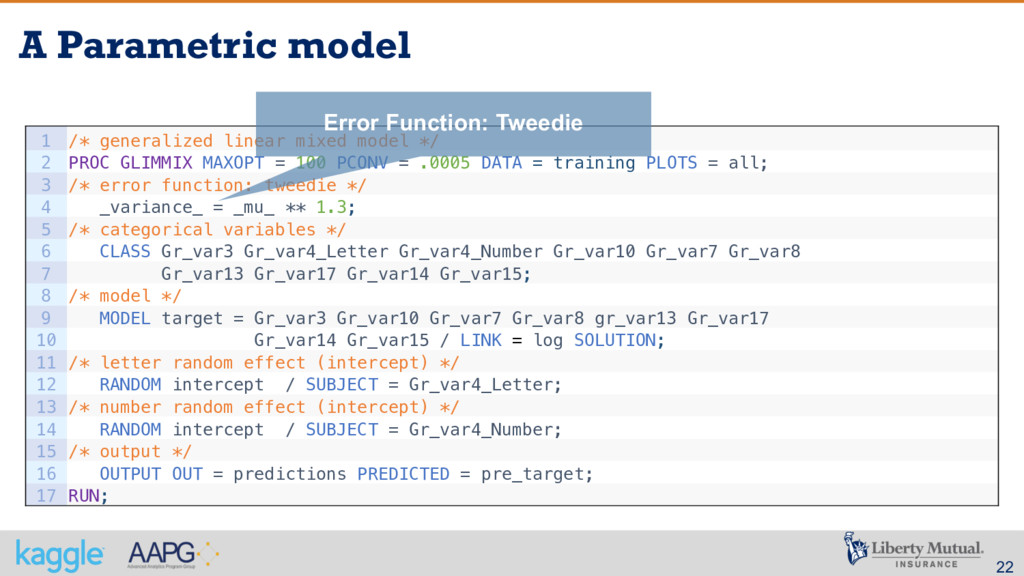
    High severity: skewed distribution, cero or positive, varying over a wide range § Data credibility: much less data points compared to personal line § Many features: more than 300 features § Non-informed observations: only 34% are complete cases in the training data § Hierarchical structure: nested observations
  8. 8 Agenda § Competition Summary § Data Description § Challenges

    § Objectives § Approach § Feature Engineering § Variable Selection § Algorithm § Model Validation § Model Selection § Conclusions
  9. 9 Objectives § Prediction accuracy is the main objective of

    the competition § Avoid over-fitting is the most critical issue to overcome during the competition
  10. 10 Agenda § Competition Summary § Data Description § Challenges

    § Objectives § Approach § Feature Engineering § Variable Selection § Algorithm § Model Validation § Model Selection § Conclusions
  11. 11 Approach Down sample non-claims Capping large losses k-folds cross-validation

    Feature selection Data imputation Mixed models Low frequency High severity Data credibility Many features Missing data Hierarchical str.
  12. 12 Agenda § Competition Summary § Data Description § Challenges

    § Objectives § Approach § Feature Engineering § Variable Selection § Algorithm § Model Validation § Model Selection § Conclusions
  13. 13 Feature Engineering Data Engineering Technique Implication Imputation Dec. trees

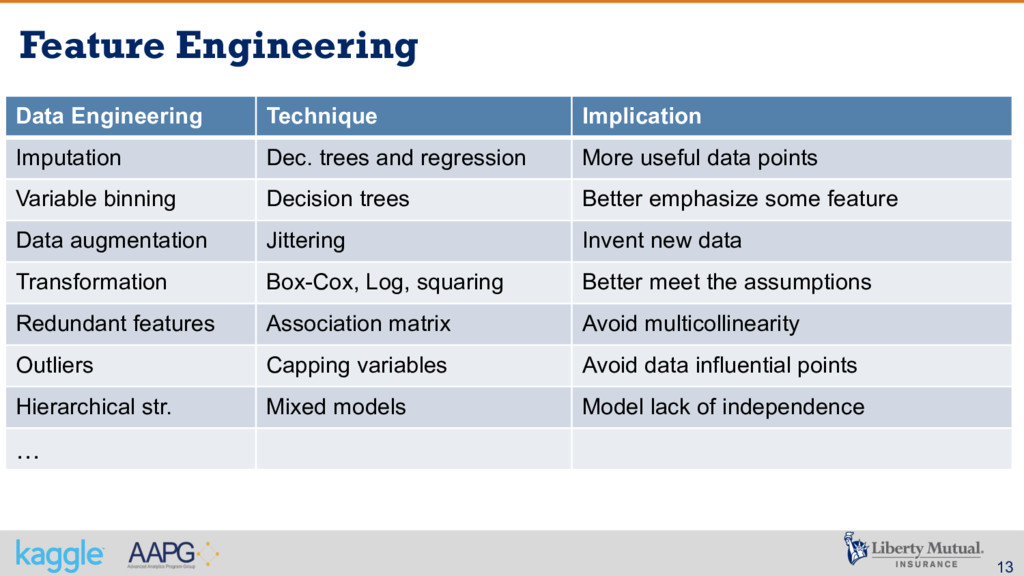
    and regression More useful data points Variable binning Decision trees Better emphasize some feature Data augmentation Jittering Invent new data Transformation Box-Cox, Log, squaring Better meet the assumptions Redundant features Association matrix Avoid multicollinearity Outliers Capping variables Avoid data influential points Hierarchical str. Mixed models Model lack of independence …
  14. 14 Hierarchical Structure § Levels for var4 are in a

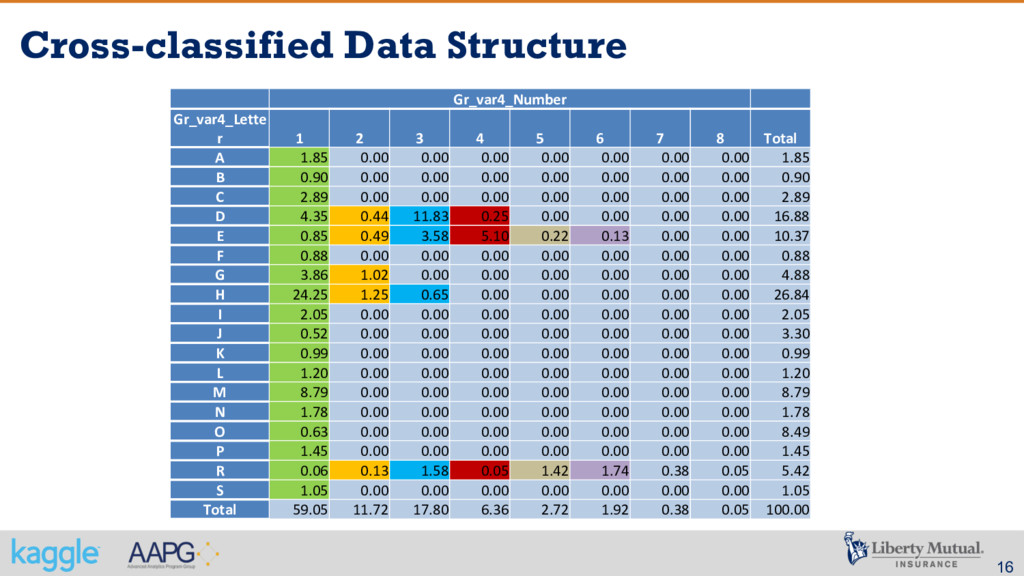
    hierarchical structure. § The letter represents higher level § The number following the letter represents lower level nested within the higher level. 1 1 1 1 2 3 4 A B C D 1 2 3 4 E 5 6 1 F 1 2 D
  15. 15 Cross-classified Data Structure § Levels for var4 are in

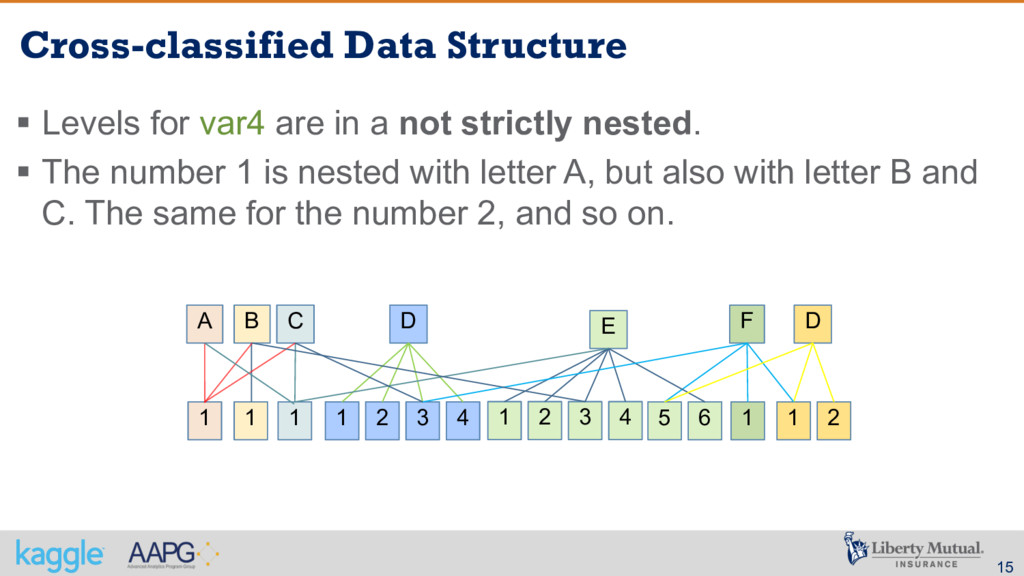
    a not strictly nested. § The number 1 is nested with letter A, but also with letter B and C. The same for the number 2, and so on. 1 1 1 1 2 3 4 A B C D 1 2 3 4 E 5 6 1 F 1 2 D
  16. 16 Cross-classified Data Structure Gr_var4_Number Gr_var4_Lette r 1 2 3

    4 5 6 7 8 Total A 1.85 0.00 0.00 0.00 0.00 0.00 0.00 0.00 1.85 B 0.90 0.00 0.00 0.00 0.00 0.00 0.00 0.00 0.90 C 2.89 0.00 0.00 0.00 0.00 0.00 0.00 0.00 2.89 D 4.35 0.44 11.83 0.25 0.00 0.00 0.00 0.00 16.88 E 0.85 0.49 3.58 5.10 0.22 0.13 0.00 0.00 10.37 F 0.88 0.00 0.00 0.00 0.00 0.00 0.00 0.00 0.88 G 3.86 1.02 0.00 0.00 0.00 0.00 0.00 0.00 4.88 H 24.25 1.25 0.65 0.00 0.00 0.00 0.00 0.00 26.84 I 2.05 0.00 0.00 0.00 0.00 0.00 0.00 0.00 2.05 J 0.52 0.00 0.00 0.00 0.00 0.00 0.00 0.00 3.30 K 0.99 0.00 0.00 0.00 0.00 0.00 0.00 0.00 0.99 L 1.20 0.00 0.00 0.00 0.00 0.00 0.00 0.00 1.20 M 8.79 0.00 0.00 0.00 0.00 0.00 0.00 0.00 8.79 N 1.78 0.00 0.00 0.00 0.00 0.00 0.00 0.00 1.78 O 0.63 0.00 0.00 0.00 0.00 0.00 0.00 0.00 8.49 P 1.45 0.00 0.00 0.00 0.00 0.00 0.00 0.00 1.45 R 0.06 0.13 1.58 0.05 1.42 1.74 0.38 0.05 5.42 S 1.05 0.00 0.00 0.00 0.00 0.00 0.00 0.00 1.05 Total 59.05 11.72 17.80 6.36 2.72 1.92 0.38 0.05 100.00
  17. 17 Agenda § Competition Summary § Data Description § Challenges

    § Objectives § Approach § Feature Engineering § Variable Selection § Algorithm § Model Validation § Model Selection § Conclusions
  18. 18 Variable Selection § My own implementation of Stepwise Regression

    § Decision trees § All features selection methods boot the same specific subset of features
  19. 19 Agenda § Competition Summary § Data Description § Challenges

    § Objectives § Approach § Feature Engineering § Variable Selection § Algorithm § Model Validation § Model Selection § Conclusions
  20. 20 Algorithm 1 /* generalized linear mixed model */ 2

    PROC GLIMMIX MAXOPT = 100 PCONV = .0005 DATA = training PLOTS = all; 3 /* error function: tweedie */ 4 _variance_ = _mu_ ** 1.3; 5 /* categorical variables */ 6 CLASS Gr_var3 Gr_var4_Letter Gr_var4_Number Gr_var10 Gr_var7 Gr_var8 7 Gr_var13 Gr_var17 Gr_var14 Gr_var15; 8 /* model */ 9 MODEL target = Gr_var3 Gr_var10 Gr_var7 Gr_var8 gr_var13 Gr_var17 10 Gr_var14 Gr_var15 / LINK = log SOLUTION; 11 /* letter random effect (intercept) */ 12 RANDOM intercept / SUBJECT = Gr_var4_Letter; 13 /* number random effect (intercept) */ 14 RANDOM intercept / SUBJECT = Gr_var4_Number; 15 /* output */ 16 OUTPUT OUT = predictions PREDICTED = pre_target; 17 RUN;
  21. 21 A Parametric model 1 /* generalized linear mixed model

    */ 2 PROC GLIMMIX MAXOPT = 100 PCONV = .0005 DATA = training PLOTS = all; 3 /* error function: tweedie */ 4 _variance_ = _mu_ ** 1.3; 5 /* categorical variables */ 6 CLASS Gr_var3 Gr_var4_Letter Gr_var4_Number Gr_var10 Gr_var7 Gr_var8 7 Gr_var13 Gr_var17 Gr_var14 Gr_var15; 8 /* model */ 9 MODEL target = Gr_var3 Gr_var10 Gr_var7 Gr_var8 gr_var13 Gr_var17 10 Gr_var14 Gr_var15 / LINK = log SOLUTION; 11 /* letter random effect (intercept) */ 12 RANDOM intercept / SUBJECT = Gr_var4_Letter; 13 /* number random effect (intercept) */ 14 RANDOM intercept / SUBJECT = Gr_var4_Number; 15 /* output */ 16 OUTPUT OUT = predictions PREDICTED = pre_target; 17 RUN; Generalized Linear Mixed Model
  22. 22 A Parametric model 1 /* generalized linear mixed model

    */ 2 PROC GLIMMIX MAXOPT = 100 PCONV = .0005 DATA = training PLOTS = all; 3 /* error function: tweedie */ 4 _variance_ = _mu_ ** 1.3; 5 /* categorical variables */ 6 CLASS Gr_var3 Gr_var4_Letter Gr_var4_Number Gr_var10 Gr_var7 Gr_var8 7 Gr_var13 Gr_var17 Gr_var14 Gr_var15; 8 /* model */ 9 MODEL target = Gr_var3 Gr_var10 Gr_var7 Gr_var8 gr_var13 Gr_var17 10 Gr_var14 Gr_var15 / LINK = log SOLUTION; 11 /* letter random effect (intercept) */ 12 RANDOM intercept / SUBJECT = Gr_var4_Letter; 13 /* number random effect (intercept) */ 14 RANDOM intercept / SUBJECT = Gr_var4_Number; 15 /* output */ 16 OUTPUT OUT = predictions PREDICTED = pre_target; 17 RUN; Error Function: Tweedie
  23. 23 A Parametric model 1 /* generalized linear mixed model

    */ 2 PROC GLIMMIX MAXOPT = 100 PCONV = .0005 DATA = training PLOTS = all; 3 /* error function: tweedie */ 4 _variance_ = _mu_ ** 1.3; 5 /* categorical variables */ 6 CLASS Gr_var3 Gr_var4_Letter Gr_var4_Number Gr_var10 Gr_var7 Gr_var8 7 Gr_var13 Gr_var17 Gr_var14 Gr_var15; 8 /* model */ 9 MODEL target = Gr_var3 Gr_var10 Gr_var7 Gr_var8 gr_var13 Gr_var17 10 Gr_var14 Gr_var15 / LINK = log SOLUTION; 11 /* letter random effect (intercept) */ 12 RANDOM intercept / SUBJECT = Gr_var4_Letter; 13 /* number random effect (intercept) */ 14 RANDOM intercept / SUBJECT = Gr_var4_Number; 15 /* output */ 16 OUTPUT OUT = predictions PREDICTED = pre_target; 17 RUN; All the variables are class variables
  24. 24 A Parametric model 1 /* generalized linear mixed model

    */ 2 PROC GLIMMIX MAXOPT = 100 PCONV = .0005 DATA = training PLOTS = all; 3 /* error function: tweedie */ 4 _variance_ = _mu_ ** 1.3; 5 /* categorical variables */ 6 CLASS Gr_var3 Gr_var4_Letter Gr_var4_Number Gr_var10 Gr_var7 Gr_var8 7 Gr_var13 Gr_var17 Gr_var14 Gr_var15; 8 /* model */ 9 MODEL target = Gr_var3 Gr_var10 Gr_var7 Gr_var8 gr_var13 Gr_var17 10 Gr_var14 Gr_var15 / LINK = log SOLUTION; 11 /* letter random effect (intercept) */ 12 RANDOM intercept / SUBJECT = Gr_var4_Letter; 13 /* number random effect (intercept) */ 14 RANDOM intercept / SUBJECT = Gr_var4_Number; 15 /* output */ 16 OUTPUT OUT = predictions PREDICTED = pre_target; 17 RUN; Letter Random Effect (intercept)
  25. 25 A Parametric model 1 /* generalized linear mixed model

    */ 2 PROC GLIMMIX MAXOPT = 100 PCONV = .0005 DATA = training PLOTS = all; 3 /* error function: tweedie */ 4 _variance_ = _mu_ ** 1.3; 5 /* categorical variables */ 6 CLASS Gr_var3 Gr_var4_Letter Gr_var4_Number Gr_var10 Gr_var7 Gr_var8 7 Gr_var13 Gr_var17 Gr_var14 Gr_var15; 8 /* model */ 9 MODEL target = Gr_var3 Gr_var10 Gr_var7 Gr_var8 gr_var13 Gr_var17 10 Gr_var14 Gr_var15 / LINK = log SOLUTION; 11 /* letter random effect (intercept) */ 12 RANDOM intercept / SUBJECT = Gr_var4_Letter; 13 /* number random effect (intercept) */ 14 RANDOM intercept / SUBJECT = Gr_var4_Number; 15 /* output */ 16 OUTPUT OUT = predictions PREDICTED = pre_target; 17 RUN; Number Random Effect (intercept)
  26. 27 Agenda § Competition Summary § Data Description § Challenges

    § Objectives § Approach § Feature Engineering § Variable Selection § Algorithm § Model Validation § Model Selection § Conclusions
  27. 30 Agenda § Competition Summary § Data Description § Challenges

    § Objectives § Approach § Feature Engineering § Variable Selection § Algorithm § Model Validation § Model Selection § Conclusions
  28. 31 Holdout Cross-Validation Method § Kaggle method: training + public

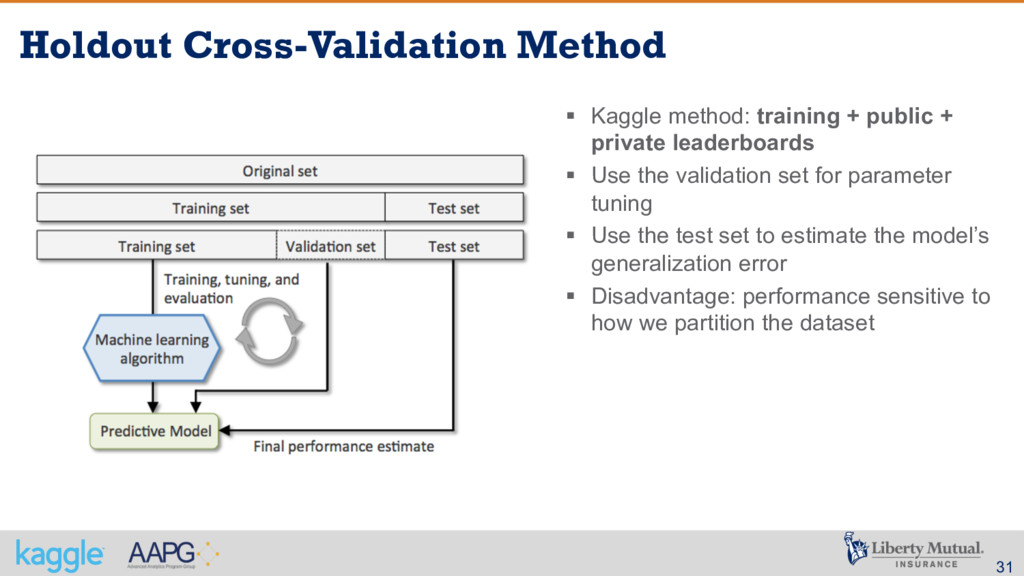
    + private leaderboards § Use the validation set for parameter tuning § Use the test set to estimate the model’s generalization error § Disadvantage: performance sensitive to how we partition the dataset
  29. 32 k-Folds Cross-Validation § Cross-validation in order to avoid over-

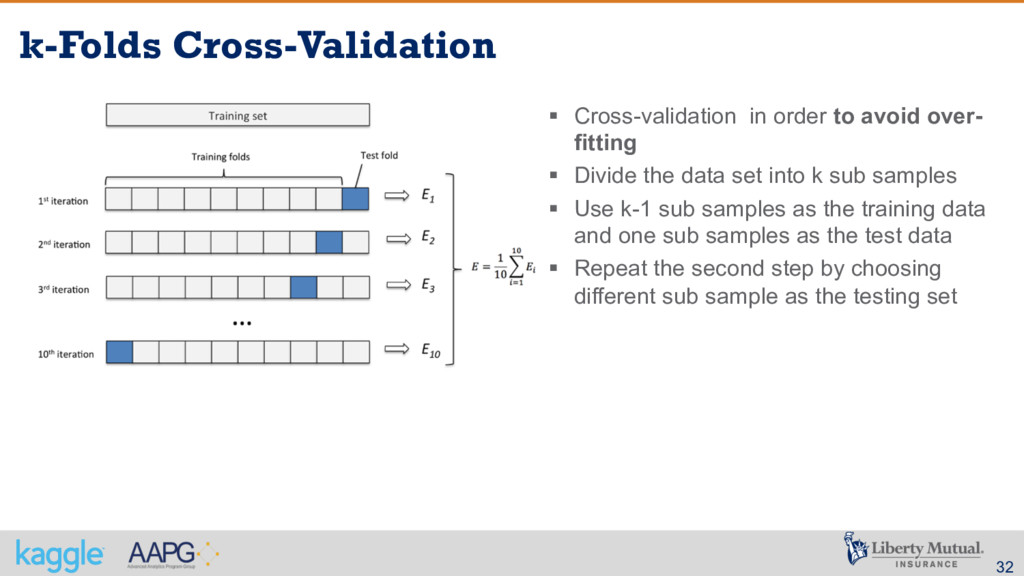
    fitting § Divide the data set into k sub samples § Use k-1 sub samples as the training data and one sub samples as the test data § Repeat the second step by choosing different sub sample as the testing set
  30. 33 Validation Plot § How well the model fits the

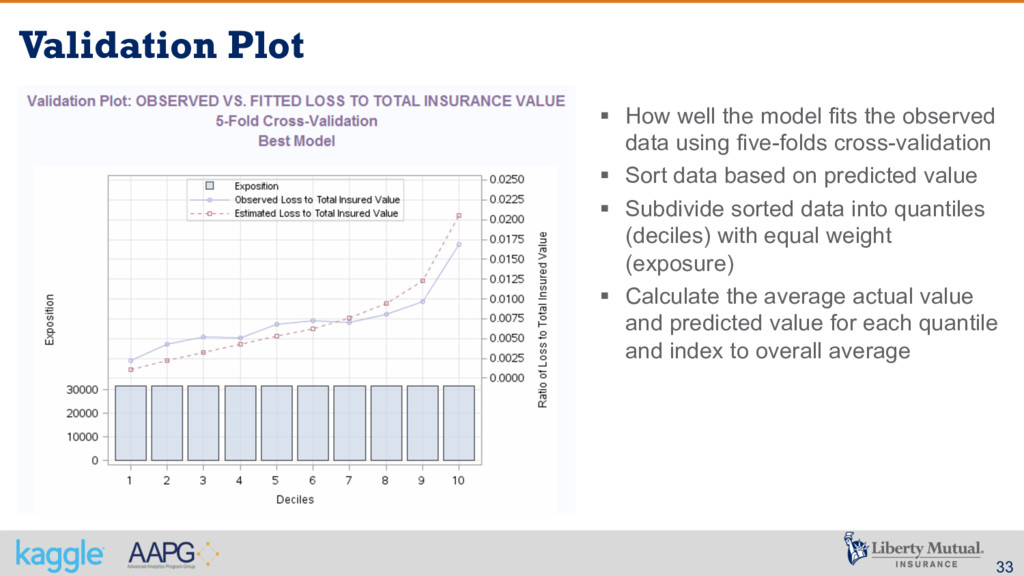
    observed data using five-folds cross-validation § Sort data based on predicted value § Subdivide sorted data into quantiles (deciles) with equal weight (exposure) § Calculate the average actual value and predicted value for each quantile and index to overall average
  31. 34 Lift Plot § Compares model’s predictive performance to a

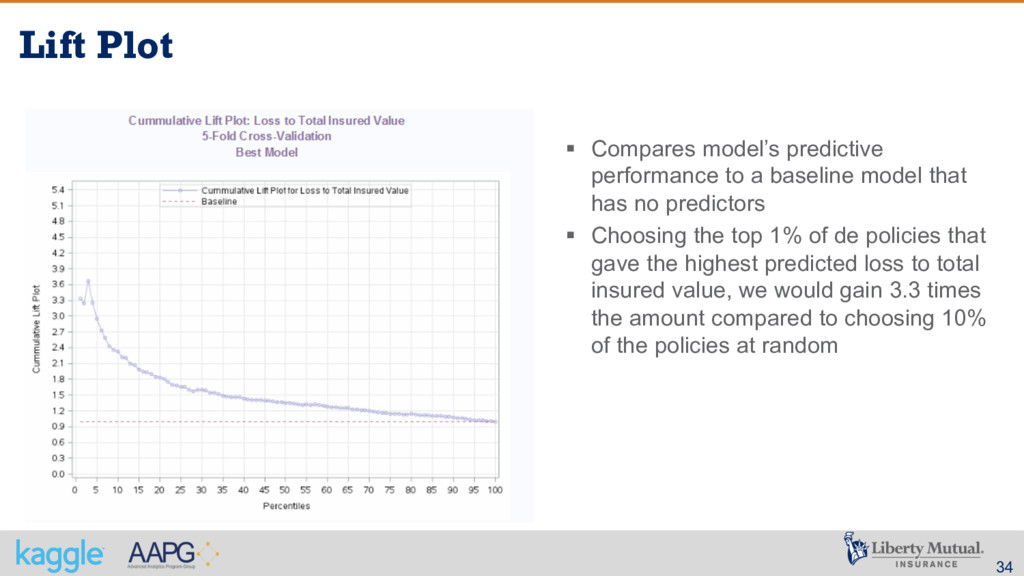
    baseline model that has no predictors § Choosing the top 1% of de policies that gave the highest predicted loss to total insured value, we would gain 3.3 times the amount compared to choosing 10% of the policies at random
  32. 35 Cumulative Gain Chart § Gini coefficient was the error

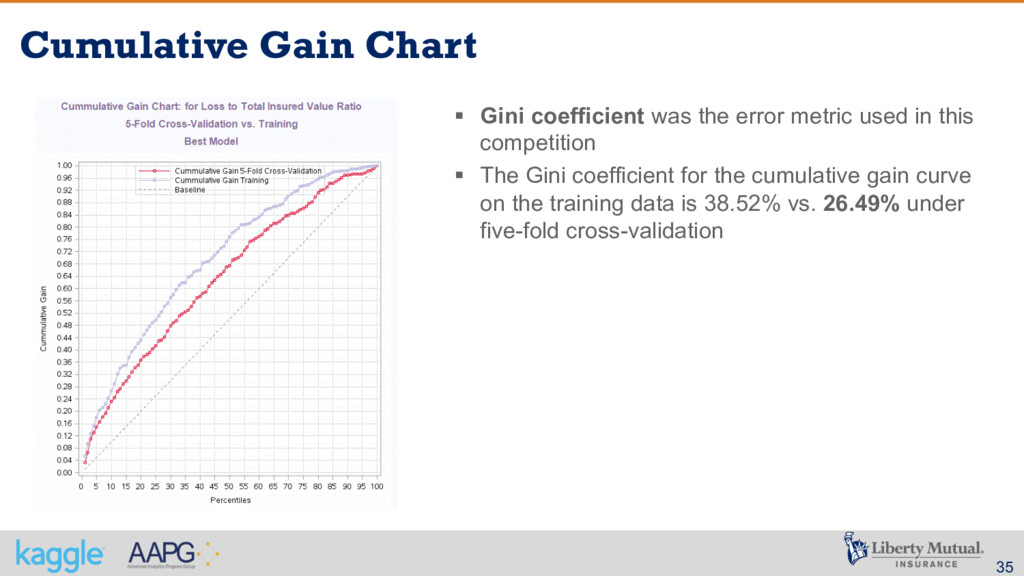
    metric used in this competition § The Gini coefficient for the cumulative gain curve on the training data is 38.52% vs. 26.49% under five-fold cross-validation
  33. 36 Double Lift Chart: GLMM vs. GLM § How critical

    is the inclusion of the of two random effects as intercepts § “New Model”: GLM without random effects § “Best Model”: GLMM with random effects
  34. 37 Agenda § Competition Summary § Data Description § Challenges

    § Objectives § Approach § Feature Engineering § Variable Selection § Algorithm § Model Validation § Model Selection § Conclusions
  35. 38 Conclusions § A parametric algorithm is not too far

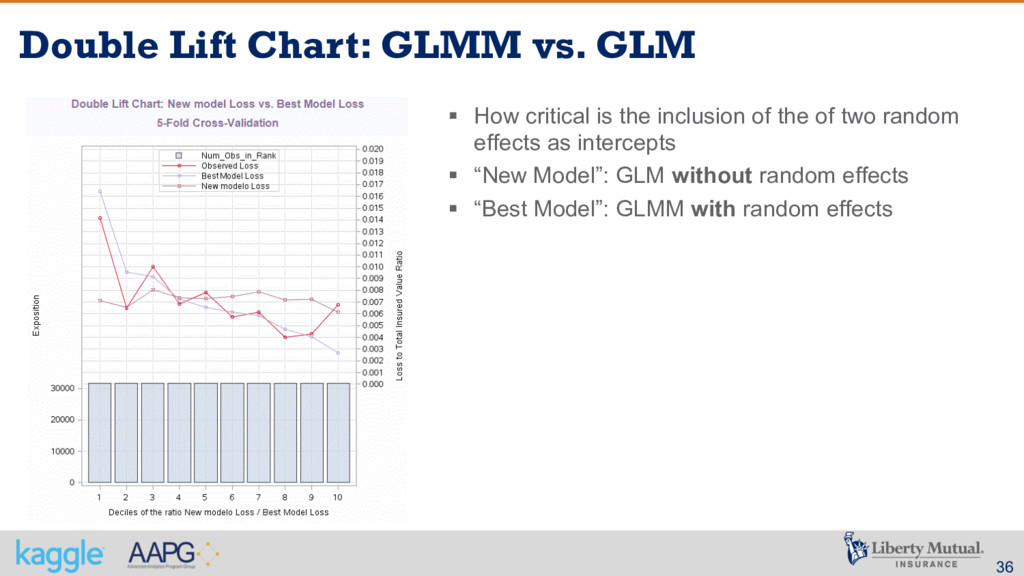
    from the best possible algorithm – the winner of the public contest § The use of GLMM in order to deal with spare data and lack of credibility definitely was critical § A careful reading of the problem description was very important