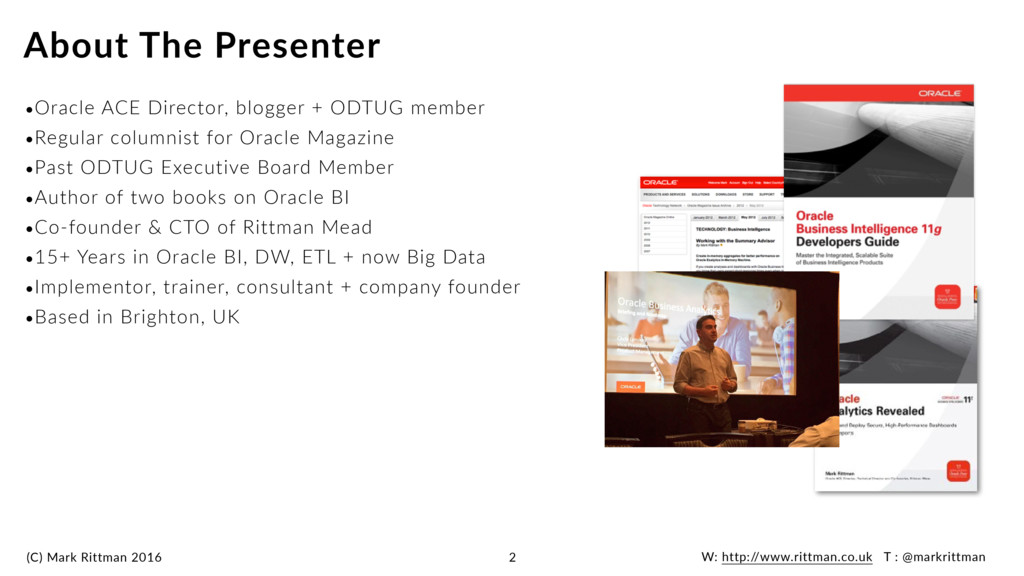
ACE Director, blogger + ODTUG member •Regular columnist for Oracle Magazine •Past ODTUG Executive Board Member •Author of two books on Oracle BI •Co-founder & CTO of Rittman Mead •15+ Years in Oracle BI, DW, ETL + now Big Data •Implementor, trainer, consultant + company founder •Based in Brighton, UK About The Presenter 2
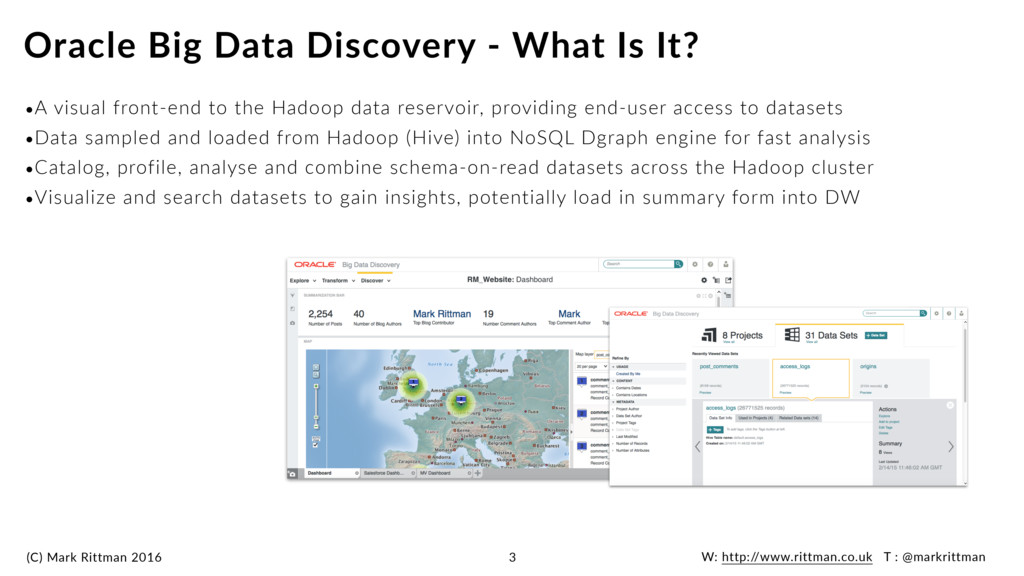
visual front-end to the Hadoop data reservoir, providing end-user access to datasets •Data sampled and loaded from Hadoop (Hive) into NoSQL Dgraph engine for fast analysis •Catalog, profile, analyse and combine schema-on-read datasets across the Hadoop cluster •Visualize and search datasets to gain insights, potentially load in summary form into DW Oracle Big Data Discovery - What Is It? 3
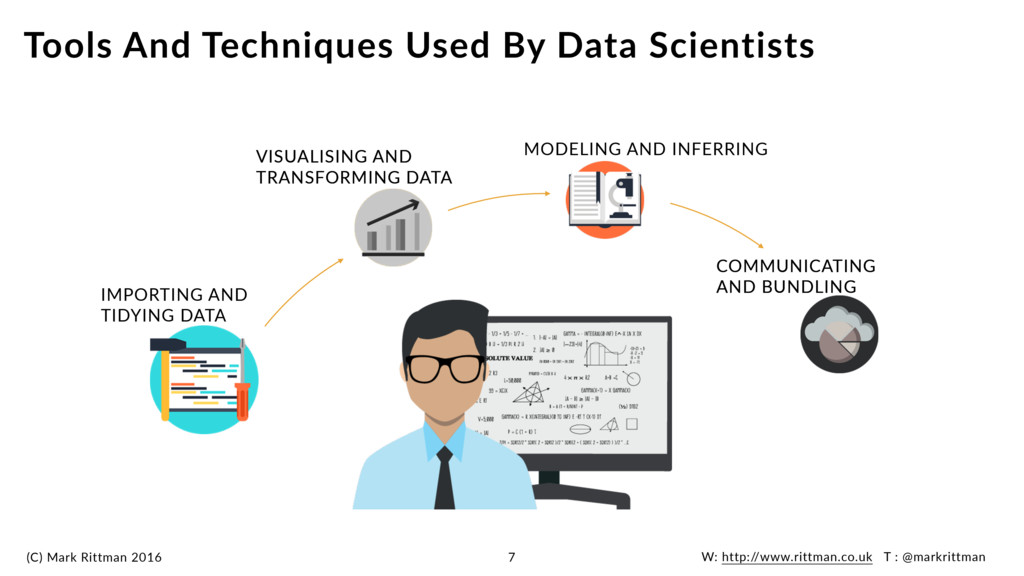
And Techniques Used By Data Scientists 7 IMPORTING AND TIDYING DATA VISUALISING AND TRANSFORMING DATA MODELING AND INFERRING COMMUNICATING AND BUNDLING VISUALISING AND TRANSFORMING DATA COMMUNICATING AND BUNDLING
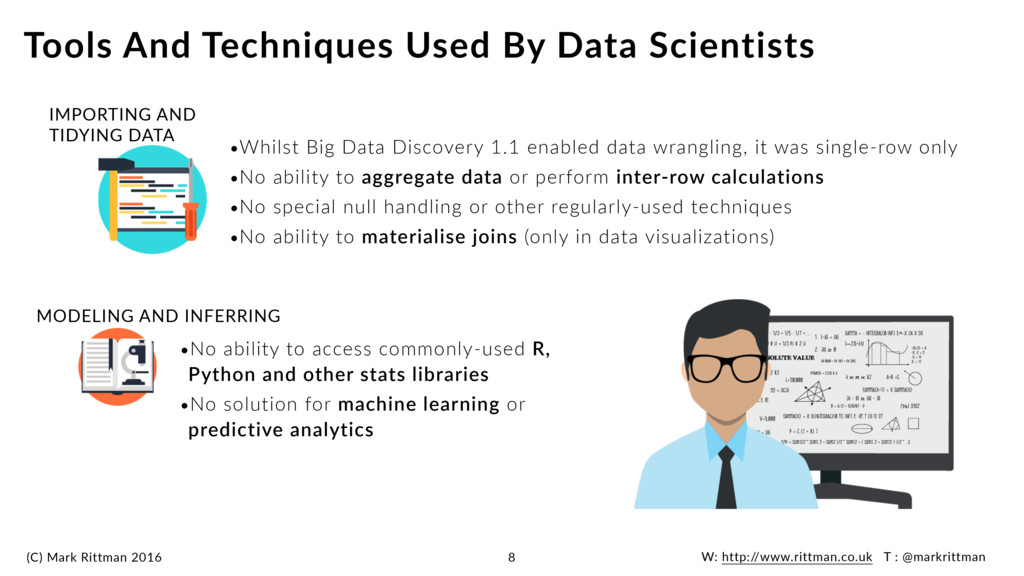
And Techniques Used By Data Scientists 8 IMPORTING AND TIDYING DATA MODELING AND INFERRING •Whilst Big Data Discovery 1.1 enabled data wrangling, it was single-row only •No ability to aggregate data or perform inter-row calculations •No special null handling or other regularly-used techniques •No ability to materialise joins (only in data visualizations) •No ability to access commonly-used R, Python and other stats libraries •No solution for machine learning or predictive analytics
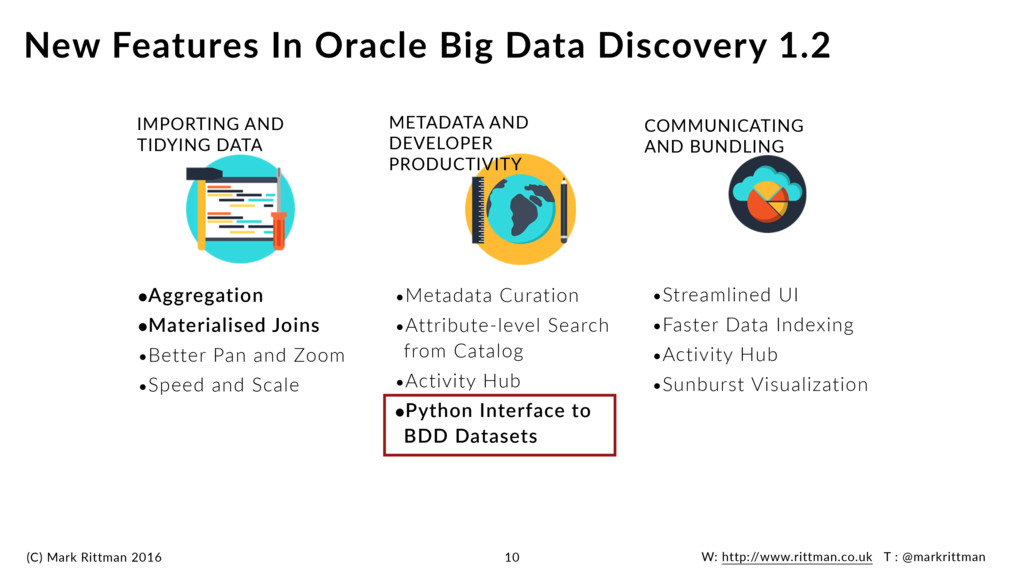
AND TIDYING DATA METADATA AND DEVELOPER PRODUCTIVITY COMMUNICATING AND BUNDLING •Metadata Curation •Attribute-level Search from Catalog •Activity Hub •Python Interface to BDD Datasets •Streamlined UI •Faster Data Indexing •Activity Hub •Sunburst Visualization •Aggregation •Materialised Joins •Better Pan and Zoom •Speed and Scale New Features In Oracle Big Data Discovery 1.2 10
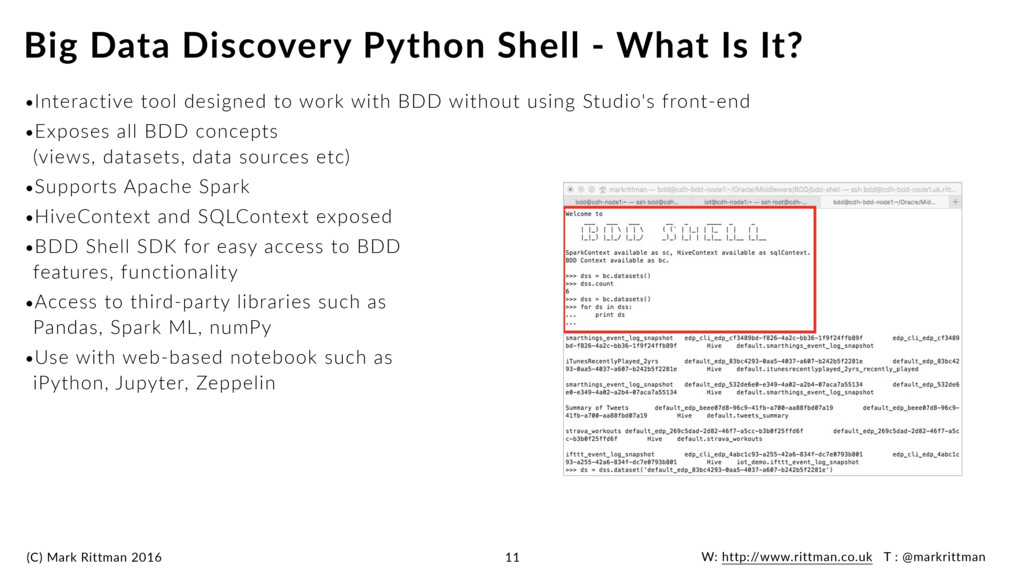
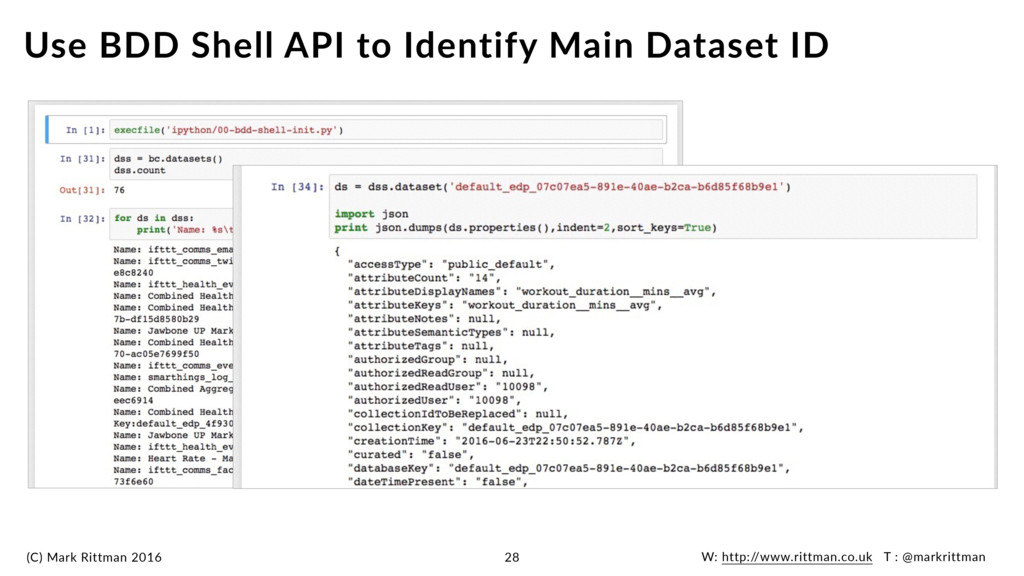
tool designed to work with BDD without using Studio's front-end •Exposes all BDD concepts (views, datasets, data sources etc) •Supports Apache Spark •HiveContext and SQLContext exposed •BDD Shell SDK for easy access to BDD features, functionality •Access to third-party libraries such as Pandas, Spark ML, numPy •Use with web-based notebook such as iPython, Jupyter, Zeppelin Big Data Discovery Python Shell - What Is It? 11
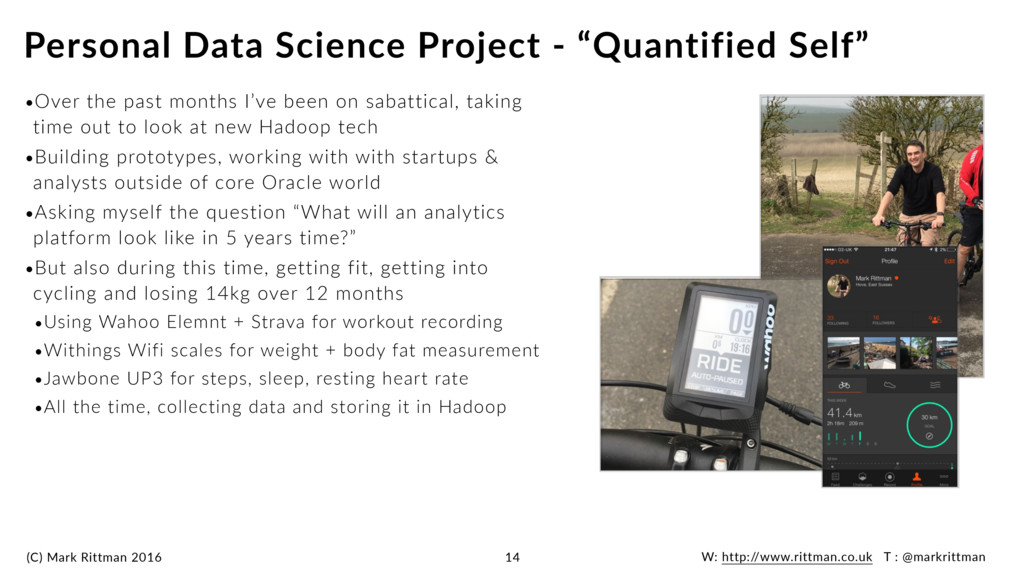
the past months I’ve been on sabattical, taking time out to look at new Hadoop tech •Building prototypes, working with with startups & analysts outside of core Oracle world •Asking myself the question “What will an analytics platform look like in 5 years time?” •But also during this time, getting fit, getting into cycling and losing 14kg over 12 months •Using Wahoo Elemnt + Strava for workout recording •Withings Wifi scales for weight + body fat measurement •Jawbone UP3 for steps, sleep, resting heart rate •All the time, collecting data and storing it in Hadoop Personal Data Science Project - “Quantified Self” 14
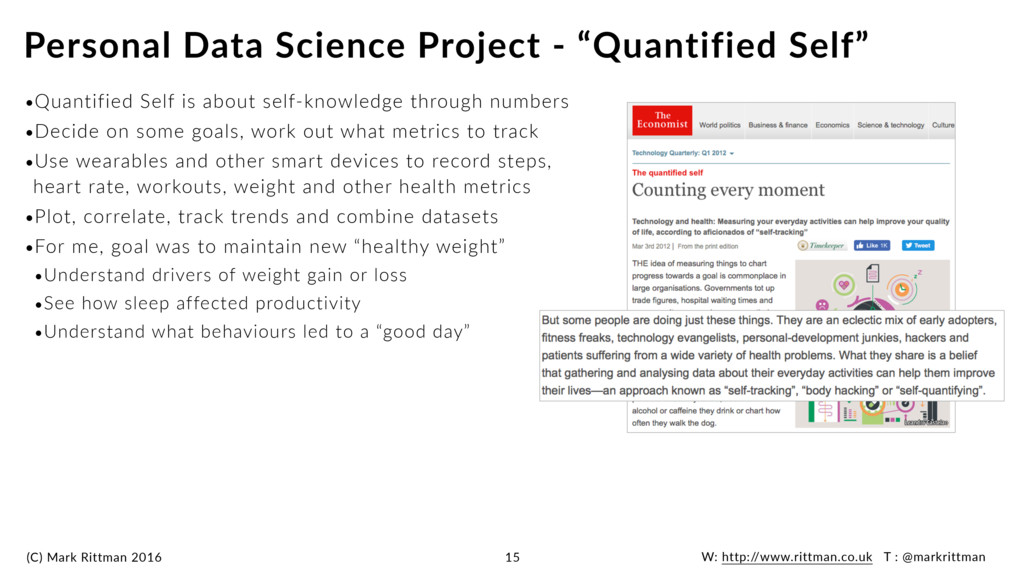
Self is about self-knowledge through numbers •Decide on some goals, work out what metrics to track •Use wearables and other smart devices to record steps, heart rate, workouts, weight and other health metrics •Plot, correlate, track trends and combine datasets •For me, goal was to maintain new “healthy weight” •Understand drivers of weight gain or loss •See how sleep affected productivity •Understand what behaviours led to a “good day” Personal Data Science Project - “Quantified Self” 15
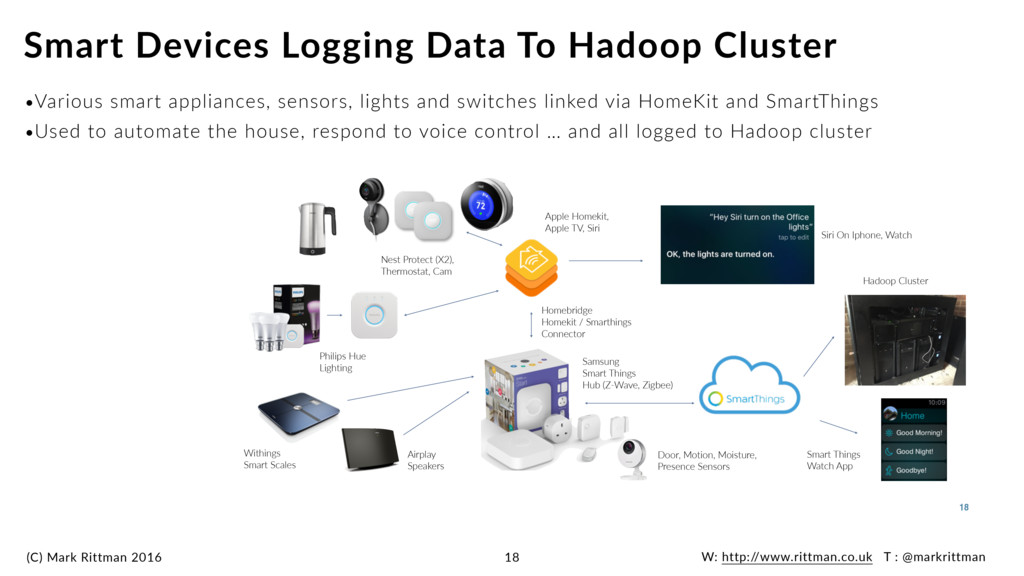
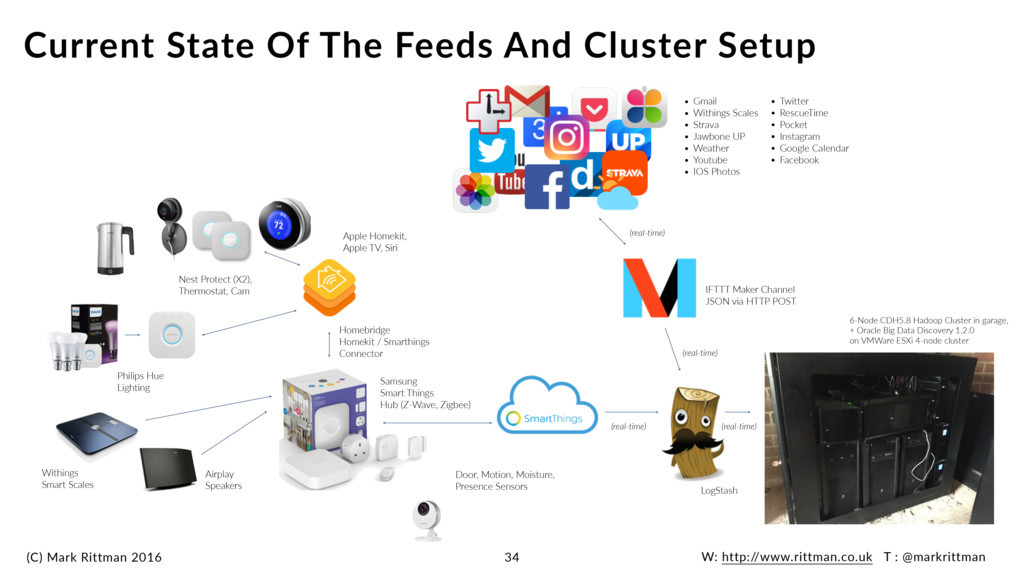
smart appliances, sensors, lights and switches linked via HomeKit and SmartThings •Used to automate the house, respond to voice control … and all logged to Hadoop cluster Smart Devices Logging Data To Hadoop Cluster 18 Siri On Iphone, Watch Hadoop Cluster Smart Things Watch App 18 Philips Hue Lighting Nest Protect (X2), Thermostat, Cam Withings Smart Scales Airplay Speakers Homebridge Homekit / Smarthings Connector Samsung Smart Things Hub (Z-Wave, Zigbee) Door, Motion, Moisture, Presence Sensors Apple Homekit, Apple TV, Siri
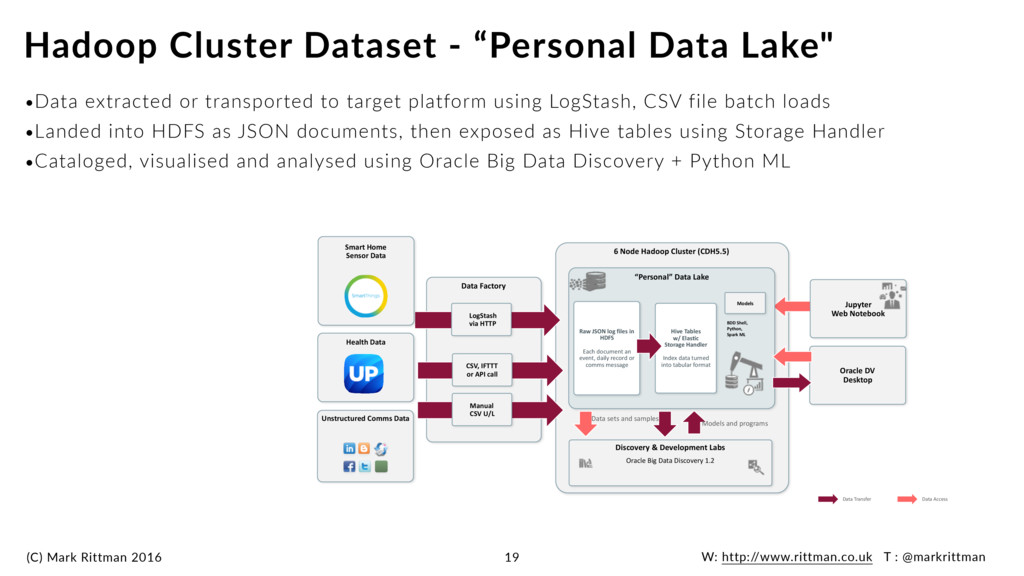
extracted or transported to target platform using LogStash, CSV file batch loads •Landed into HDFS as JSON documents, then exposed as Hive tables using Storage Handler •Cataloged, visualised and analysed using Oracle Big Data Discovery + Python ML Hadoop Cluster Dataset - “Personal Data Lake" 19 Data Transfer Data Access “Personal” Data Lake Jupyter Web Notebook 6 Node Hadoop Cluster (CDH5.5) Discovery & Development Labs Oracle Big Data Discovery 1.2 Data sets and samples Models and programs Oracle DV Desktop Models BDD Shell, Python, Spark ML Data Factory LogStash via HTTP Manual CSV U/L Data streams CSV, IFTTT or API call Raw JSON log files in HDFS Each document an event, daily record or comms message Hive Tables w/ Elastic Storage Handler Index data turned into tabular format Health Data Unstructured Comms Data Smart Home Sensor Data
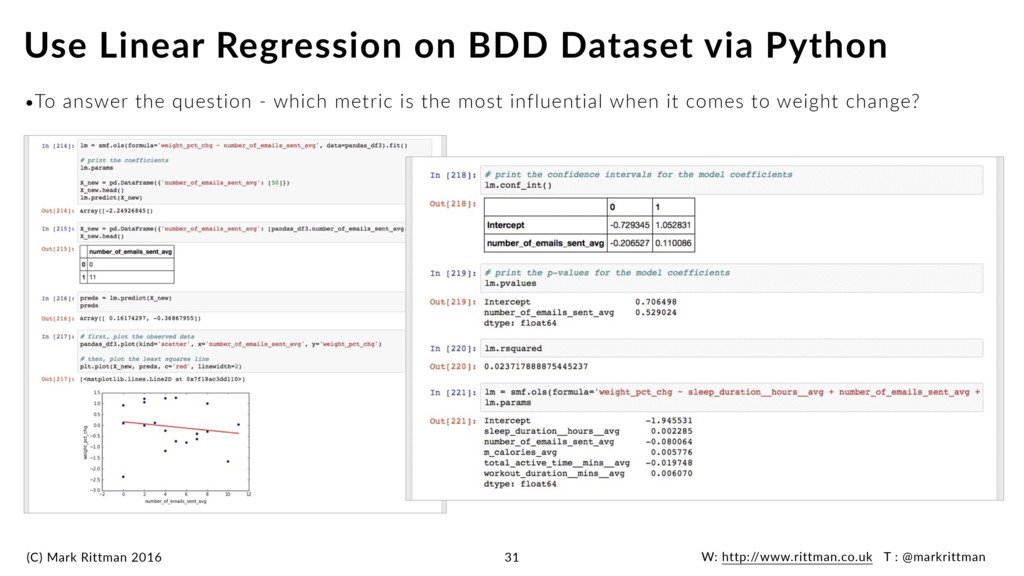
well as visualising the combined dataset, we could also use “machine learning” •Find correlations, predict outcomes based on regression analysis, classify and cluster data •Run algorithms on the full dataset to answer questions like: •“What are the biggest determinants of weight gain or loss for me?” •“On a good day, what are the typical combination of behaviours I exhibit”? •“If I raised my cadence RPM average, how much further could I cycle per day?” •“Is working late or missing lunch self-defeating in terms of overall weekly output?” And Use Machine Learning For Insights… 20 MODELING AND INFERRING
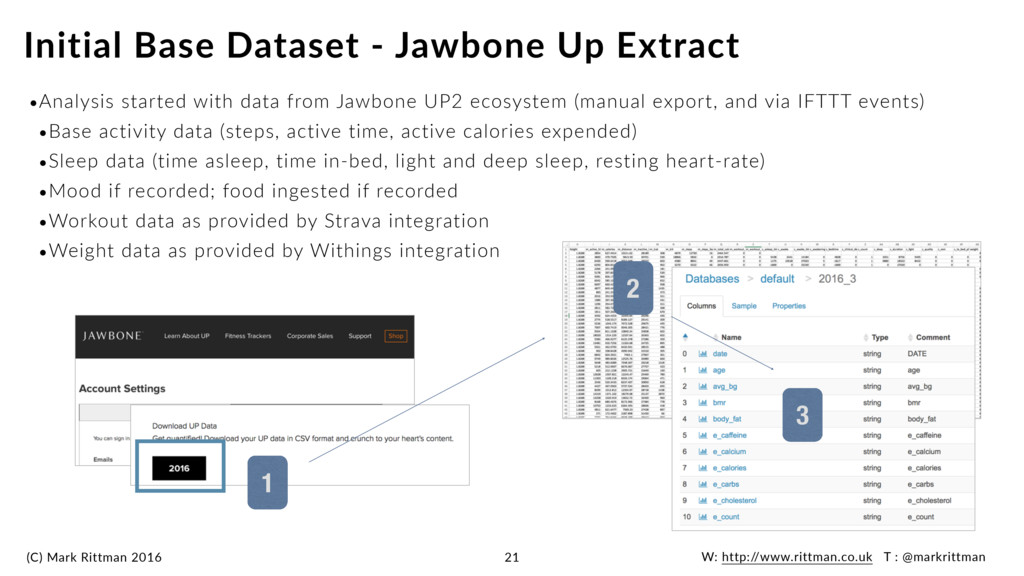
started with data from Jawbone UP2 ecosystem (manual export, and via IFTTT events) •Base activity data (steps, active time, active calories expended) •Sleep data (time asleep, time in-bed, light and deep sleep, resting heart-rate) •Mood if recorded; food ingested if recorded •Workout data as provided by Strava integration •Weight data as provided by Withings integration Initial Base Dataset - Jawbone Up Extract 21 1 2 3
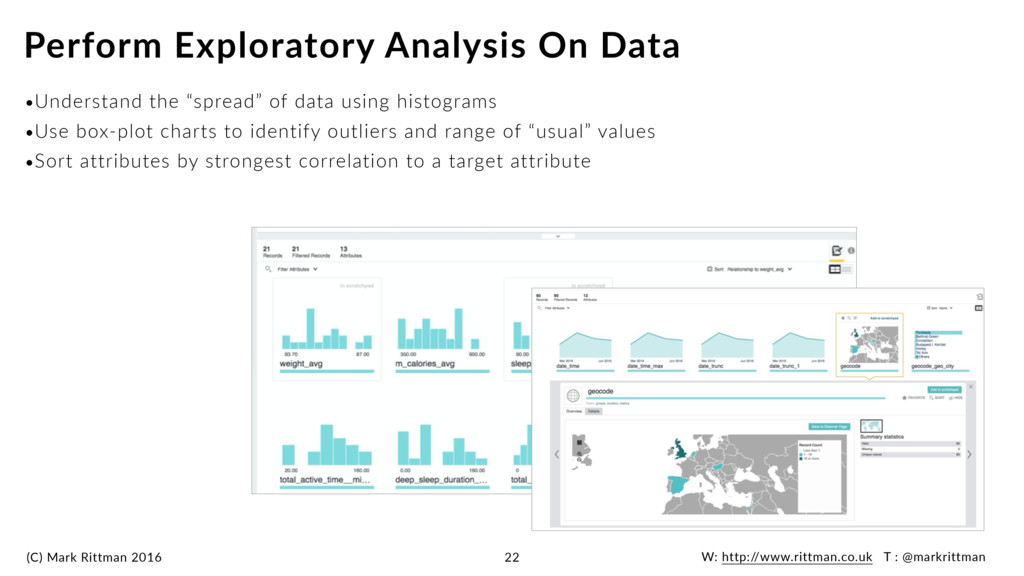
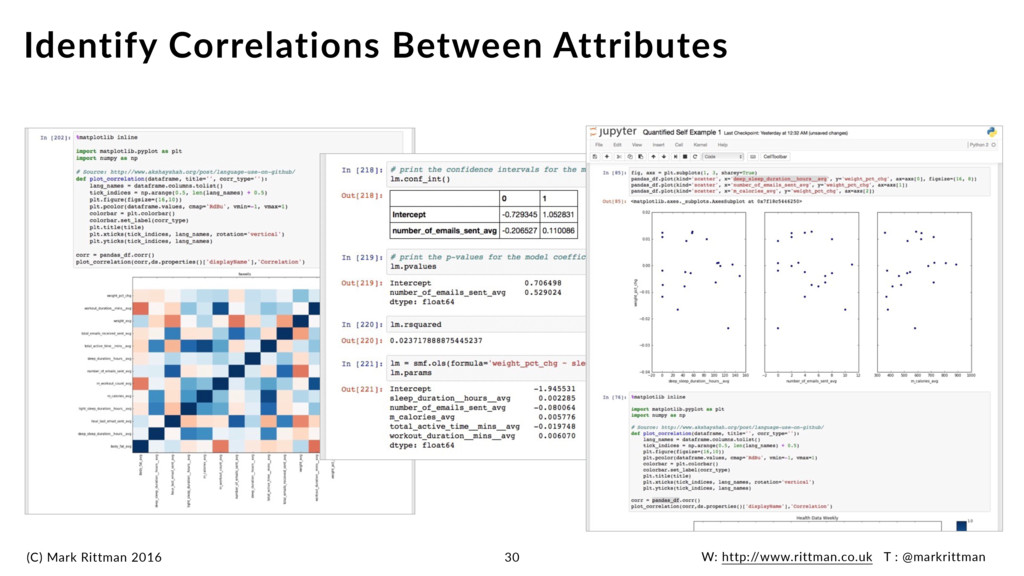
the “spread” of data using histograms •Use box-plot charts to identify outliers and range of “usual” values •Sort attributes by strongest correlation to a target attribute Perform Exploratory Analysis On Data 22
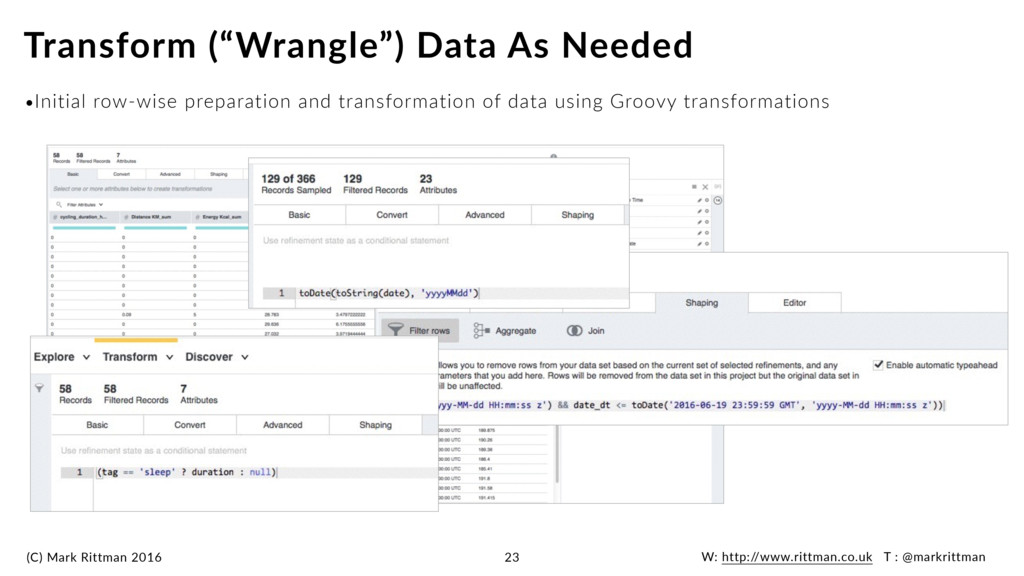
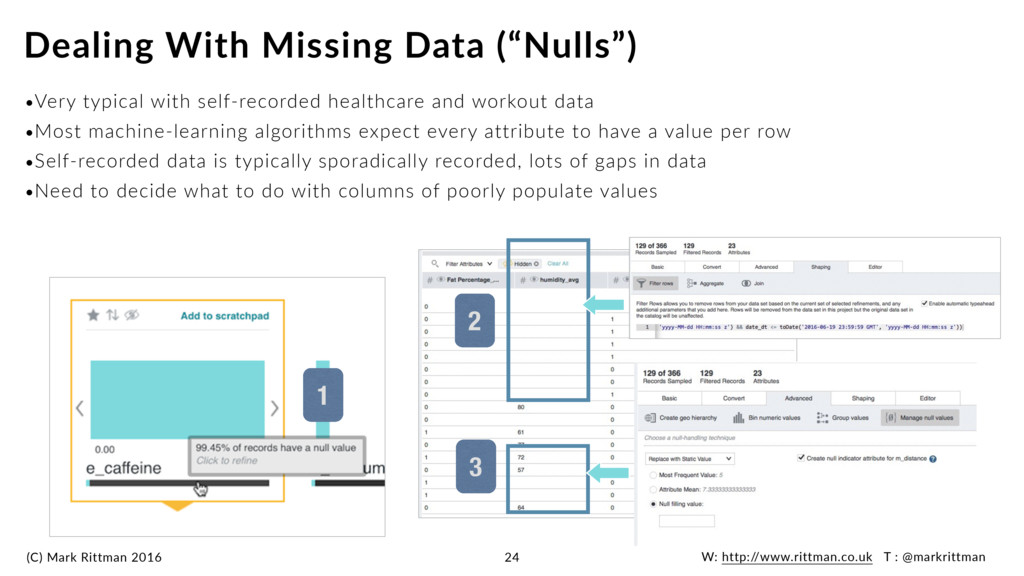
typical with self-recorded healthcare and workout data •Most machine-learning algorithms expect every attribute to have a value per row •Self-recorded data is typically sporadically recorded, lots of gaps in data •Need to decide what to do with columns of poorly populate values Dealing With Missing Data (“Nulls”) 24 1 2 3
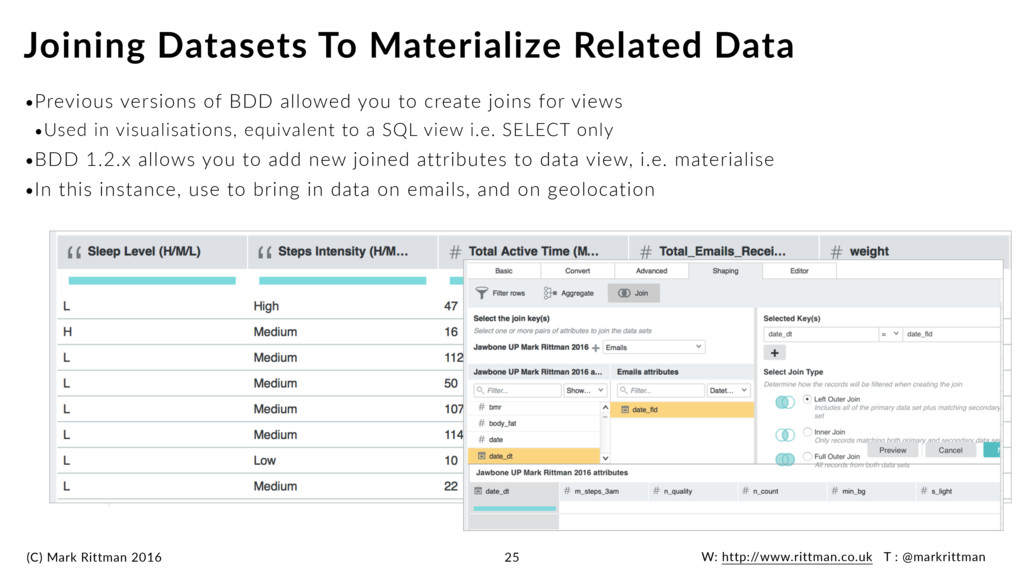
versions of BDD allowed you to create joins for views •Used in visualisations, equivalent to a SQL view i.e. SELECT only •BDD 1.2.x allows you to add new joined attributes to data view, i.e. materialise •In this instance, use to bring in data on emails, and on geolocation Joining Datasets To Materialize Related Data 25
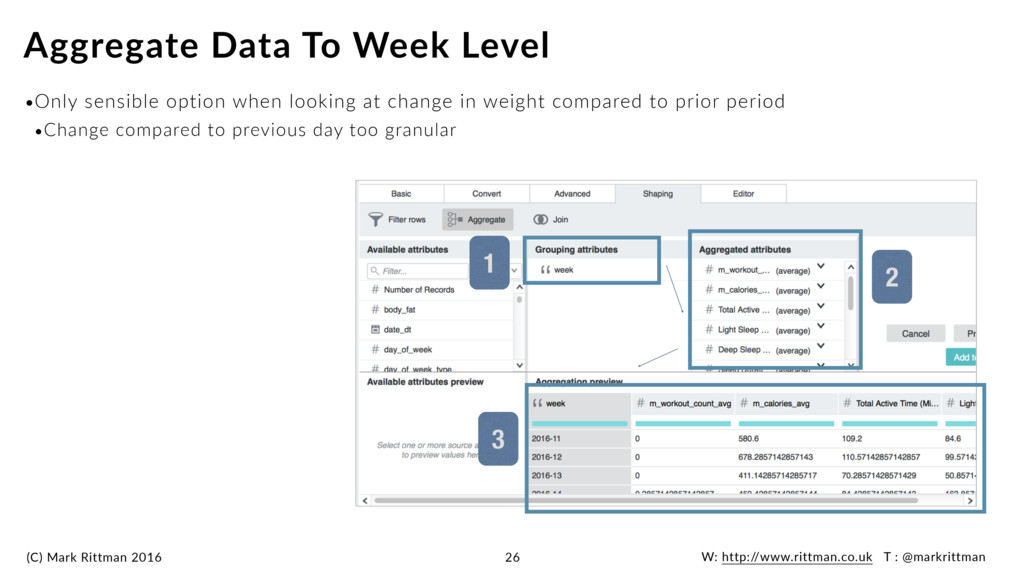
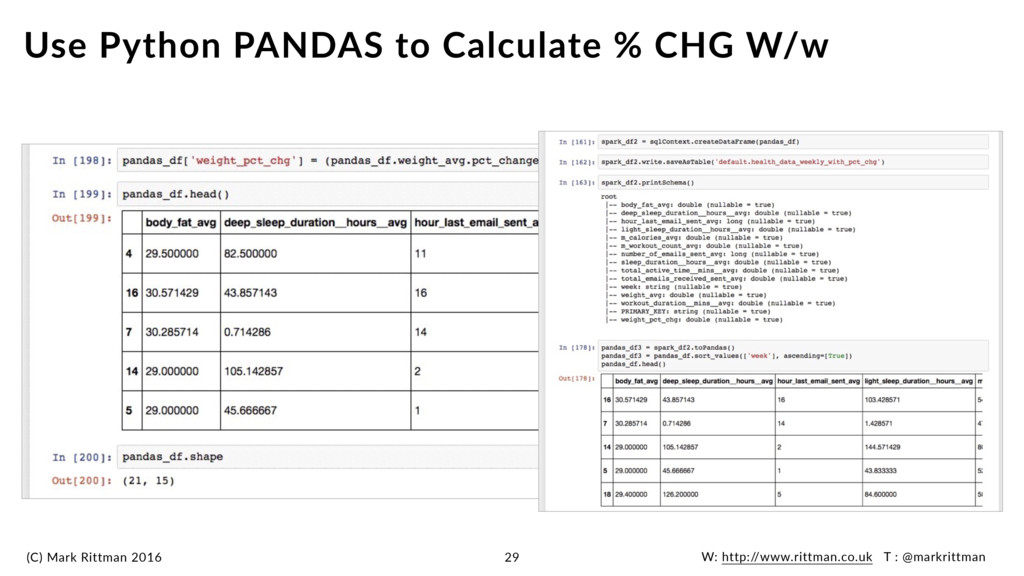
sensible option when looking at change in weight compared to prior period •Change compared to previous day too granular Aggregate Data To Week Level 26 1 2 3
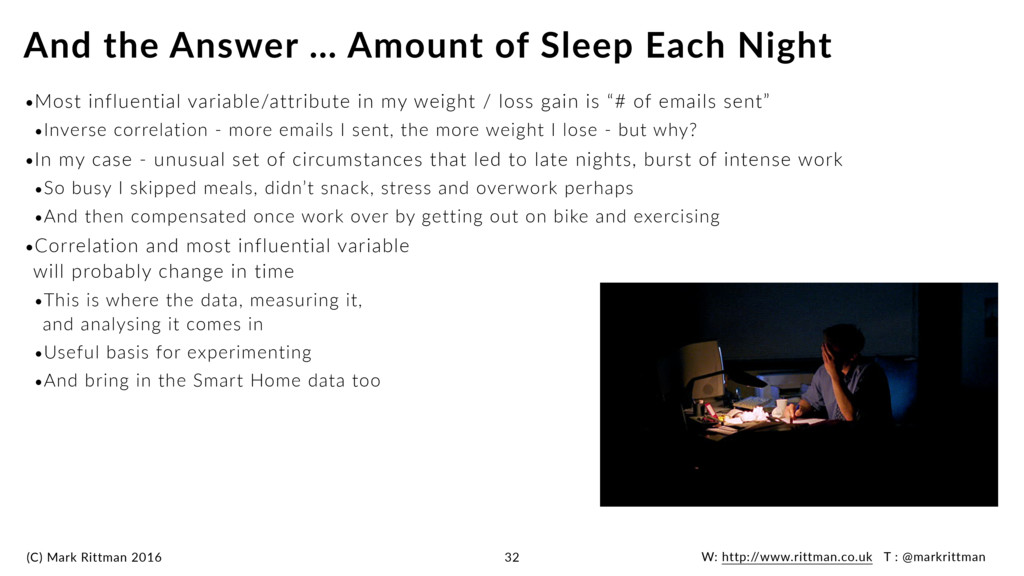
the Answer … Amount of Sleep Each Night 32 •Most influential variable/attribute in my weight / loss gain is “# of emails sent” •Inverse correlation - more emails I sent, the more weight I lose - but why? •In my case - unusual set of circumstances that led to late nights, burst of intense work •So busy I skipped meals, didn’t snack, stress and overwork perhaps •And then compensated once work over by getting out on bike and exercising •Correlation and most influential variable will probably change in time •This is where the data, measuring it, and analysing it comes in •Useful basis for experimenting •And bring in the Smart Home data too
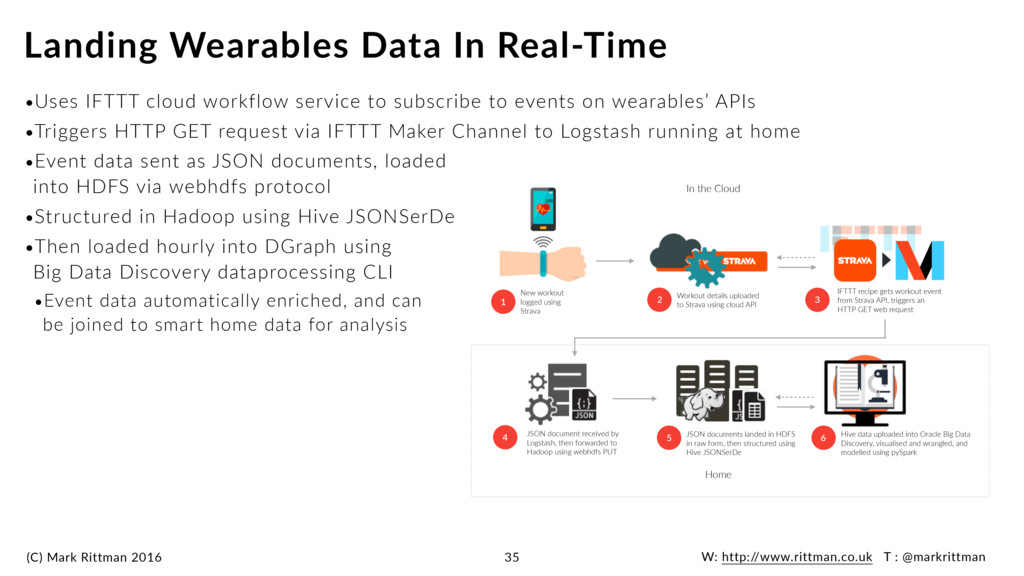
IFTTT cloud workflow service to subscribe to events on wearables’ APIs •Triggers HTTP GET request via IFTTT Maker Channel to Logstash running at home •Event data sent as JSON documents, loaded into HDFS via webhdfs protocol •Structured in Hadoop using Hive JSONSerDe •Then loaded hourly into DGraph using Big Data Discovery dataprocessing CLI •Event data automatically enriched, and can be joined to smart home data for analysis Landing Wearables Data In Real-Time 35 New workout logged using Strava 1 Workout details uploaded to Strava using cloud API 2 3 IFTTT recipe gets workout event from Strava API, triggers an HTTP GET web request 4 JSON document received by Logstash, then forwarded to Hadoop using webhdfs PUT 5 JSON documents landed in HDFS in raw form, then structured using Hive JSONSerDe 6 Hive data uploaded into Oracle Big Data Discovery, visualised and wrangled, and modelled using pySpark In the Cloud Home
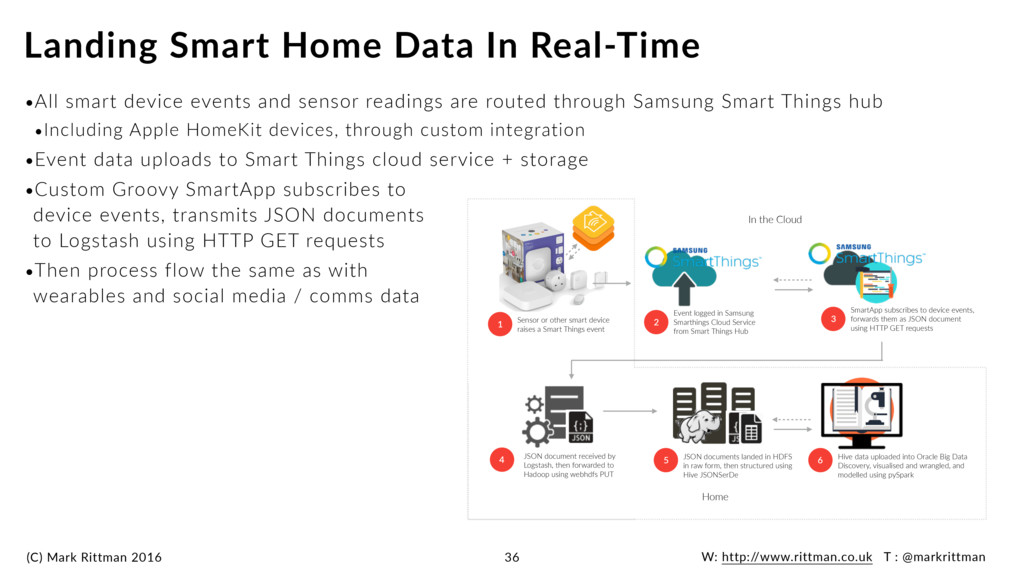
smart device events and sensor readings are routed through Samsung Smart Things hub •Including Apple HomeKit devices, through custom integration •Event data uploads to Smart Things cloud service + storage •Custom Groovy SmartApp subscribes to device events, transmits JSON documents to Logstash using HTTP GET requests •Then process flow the same as with wearables and social media / comms data Landing Smart Home Data In Real-Time 36 Sensor or other smart device raises a Smart Things event 1 Event logged in Samsung Smarthings Cloud Service from Smart Things Hub 2 4 JSON document received by Logstash, then forwarded to Hadoop using webhdfs PUT 5 JSON documents landed in HDFS in raw form, then structured using Hive JSONSerDe 6 Hive data uploaded into Oracle Big Data Discovery, visualised and wrangled, and modelled using pySpark In the Cloud Home SmartApp subscribes to device events, forwards them as JSON document using HTTP GET requests 3
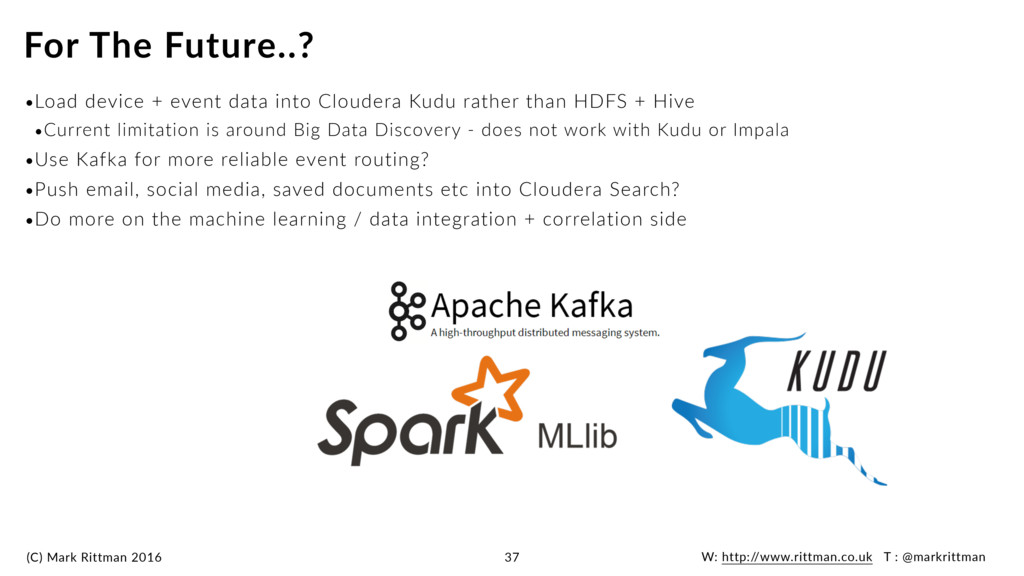
device + event data into Cloudera Kudu rather than HDFS + Hive •Current limitation is around Big Data Discovery - does not work with Kudu or Impala •Use Kafka for more reliable event routing? •Push email, social media, saved documents etc into Cloudera Search? •Do more on the machine learning / data integration + correlation side For The Future..? 37
O F T E X T - S I M P L E A N D E A S Y T O U S E T H E T H E M E O F T H E D E M O T E M P L AT E B L A C K A N D W H I T E W O R L D (C) Mark Rittman 2016 W: http://www.rittman.co.uk T : @markrittman THANK YOU 39