$30 off During Our Annual Pro Sale. View Details »

What Clients Are Saying About Your Pantry

Maryland Food Bank
September 21, 2018
140

What Clients Are Saying About Your Pantry

Tips for improving the flow of healthy foods and beverages from your pantry to your clients.

Maryland Food Bank

September 21, 2018
Tweet

Transcript

  1. #CAUSINGCHANGEMFB

    View Slide

  2. How can food pantries successfully improve
    their stocking and distribution 
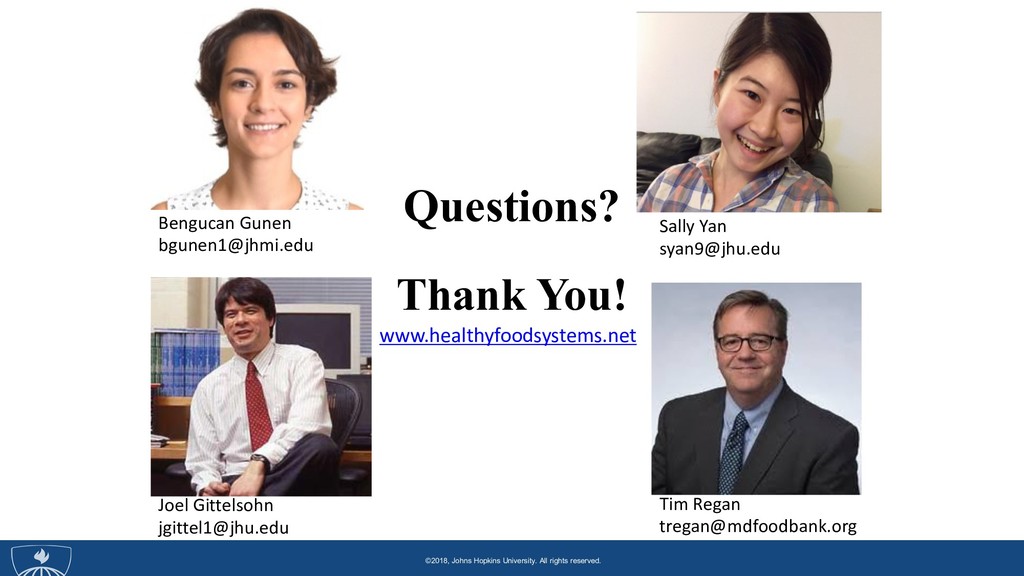
of healthier
    foods and beverages?
    Bengucan Gunen – Candidate, Master of Science in Public Health
    Bloomberg School of Public Health
    Johns Hopkins University
    [email protected]
    Sally Yan – Candidate, Master of Science in Public Health
    Bloomberg School of Public Health
    Johns Hopkins University
    [email protected]

    View Slide

  3. How can food pantries successfully
    improve their stocking and
    distribution of healthier foods and
    beverages?
    Bengucan Gunen, Sally Yan, Tim Regan, Joel Gittelsohn
    September 21, 2018

    View Slide

  4. © 2014, Johns Hopkins University. All rights reserved.
    ©2018, Johns 
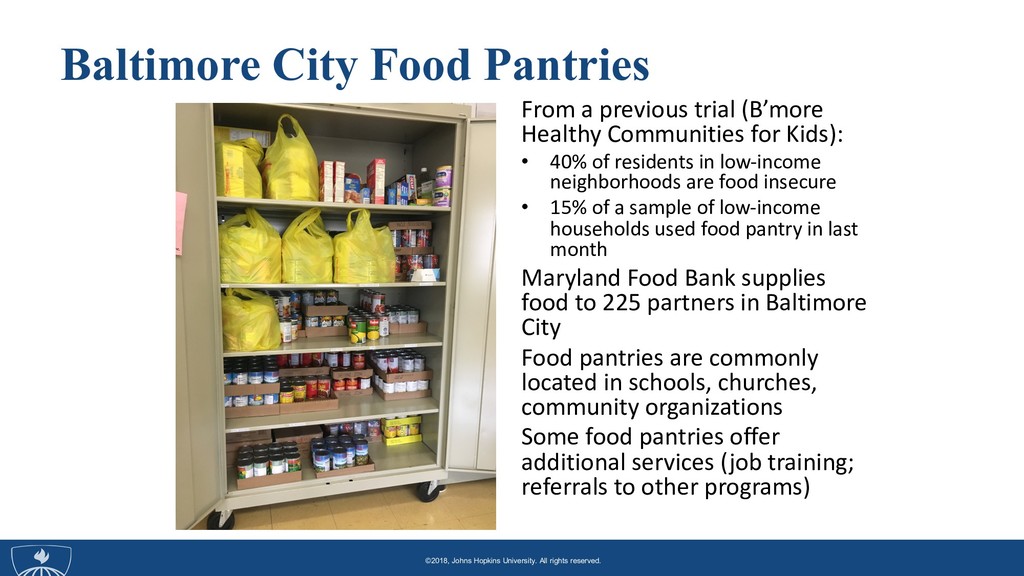
Hopkins University. All rights reserved.
    Gap 1: Limited Healthy
    Food/Beverage Access
    • Baltimore residents in low-income neighborhoods
    have high access to energy- dense foods, but limited
    access to healthier foods and beverages (D’Angelo
    2011)
    • Large percentages of food pantry users did not
    meet the recommendations for A, C, D, and B
    vitamins, or iron, magnesium, and zinc (Simmet
    2017)
    • Inadequate intakes of fruits, vegetables, and
    dairy
    • Pantries have limited ability to offer fresh foods

    View Slide

  5. © 2014, Johns Hopkins University. All rights reserved.
    © 2014, Johns Hopkins University. All rights reserved.
    © 2014, Johns Hopkins University. All rights reserved.
    ©2015, Johns Hopkins University. All rights reserved.
    ©2016, Johns Hopkins University. All rights reserved.
    ©2018, Johns Hopkins University. All rights reserved.
    Freshplace
    • Founded by Foodshare (FS), Chrysalis
    Center (CC), Inc., and Junior League of
    Hartford (JLH), Inc.
    • Designed and evaluated by the
    University of Connecticut
    • Intervention: 1 pantry in Hartford, CT
    • switched to client choice model
    • monthly motivational interviewing with
    project manager
    • referrals to community services
    • Comparison: 1 “traditional” food
    pantry distributing pre-packed bags of
    food in Hartford, CT
    • Improved food security, self-sufficiency
    • Increased fruit and vegetable
    consumption by one serving per day

    View Slide

  6. © 2014, Johns Hopkins University. All rights reserved.
    © 2014, Johns Hopkins University. All rights reserved.
    © 2014, Johns Hopkins University. All rights reserved.
    ©2015, Johns Hopkins University. All rights reserved.
    ©2016, Johns Hopkins University. All rights reserved.
    ©2018, Johns Hopkins University. All rights reserved.
    Pilot Food Bank Intervention Featuring Diabetes-
    Appropriate Food
    • 1/3 of households that use food bank services have at
    least one household member that had diabetes
    • Provided diabetic food pantry users with diabetes-
    appropriate food at 32 pantries in TX, CA, and OH
    • Box consisting of whole grains, lean meats, beans, low-sodium
    vegetables, no sugar added fruit, and shelf-stable dairy products
    • Additional fresh produce, milk, yogurt, cheese, bread, and frozen
    lean meat
    • Improvements in pre-post analyses of:
    • Hemoglobin A1c (decreased from 8.11 percent to 7.96 percent)
    • Fruit and vegetable intake (which increased from 2.8 to 3.1
    servings/day)
    • Self-efficacy
    • Medication adherence

    View Slide

  7. © 2014, Johns Hopkins University. All rights reserved.
    © 2014, Johns Hopkins University. All rights reserved.
    © 2014, Johns Hopkins University. All rights reserved.
    ©2015, Johns Hopkins University. All rights reserved.
    ©2016, Johns Hopkins University. All rights reserved.
    ©2018, Johns Hopkins University. All rights reserved.
    SuperShelf
    • Multi-component approach to increase
    the availability and uptake of healthy
    options at food pantries in MN
    • Transform participating food pantries
    (n=8 transformation; n=8 control):
    • Creating an appealing, dignified
    experience for clients
    • Highlighting healthy options
    • Collect pantry- and client-level data
    • FAST to assess healthfulness of
    foods/beverages at food pantry
    • Client surveys on diet, health
    outcomes
    • For more details, visit supershelfmn.org

    View Slide

  8. © 2014, Johns Hopkins University. All rights reserved.
    © 2014, Johns Hopkins University. All rights reserved.
    © 2014, Johns Hopkins University. All rights reserved.
    ©2015, Johns Hopkins University. All rights reserved.
    ©2016, Johns Hopkins University. All rights reserved.
    ©2018, Johns Hopkins University. All rights reserved.
    Gap 2: Need for Reliable Assessment Tool
    for Food Bank/Pantry Food Quality
    • Foods to Encourage (F2E)
    • Binary
    • F2E percentage: [ Foods to encourage / total food ] * 100
    • Detailed Foods to Encourage
    • Based on F2E, but excludes processed products high in
    sodium, total sugar, saturated fat, trans fat
    • Choosing Healthy Options Program (CHOP)
    • Created by Greater Pittsburgh Community Food Bank
    • A ranking tool to assess nutrition of specific food products
    • Stoplight system
    • Takes into account calories, saturated fat, fiber, protein, vitamins
    A and C, calcium, and iron

    View Slide

  9. © 2014, Johns Hopkins University. All rights reserved.
    © 2014, Johns Hopkins University. All rights reserved.
    © 2014, Johns Hopkins University. All rights reserved.
    ©2015, Johns Hopkins University. All rights reserved.
    ©2016, Johns Hopkins University. All rights reserved.
    ©2018, Johns Hopkins University. All rights reserved.
    Baltimore City Food Pantries
    From a previous trial (B’more
    Healthy Communities for Kids):
    • 40% of residents in low-income
    neighborhoods are food insecure
    • 15% of a sample of low-income
    households used food pantry in last
    month
    Maryland Food Bank supplies
    food to 225 partners in Baltimore
    City
    Food pantries are commonly
    located in schools, churches,
    community organizations
    Some food pantries offer
    additional services (job training;
    referrals to other programs)

    View Slide

  10. © 2014, Johns Hopkins University. All rights reserved.
    © 2014, Johns Hopkins University. All rights reserved.
    © 2014, Johns Hopkins University. All rights reserved.
    ©2015, Johns Hopkins University. All rights reserved.
    ©2016, Johns Hopkins University. All rights reserved.
    ©2018, Johns Hopkins University. All rights reserved.
    Progress/Funding for Studying Baltimore
    City’s Food Pantries
    1. BAHI Seed Grant on Obesity and the Food System: Formative
    research in 15 medium and large food pantries
    2. UHI Student-Community Small Grant Awards: Formative
    research in 7 small food pantries
    3. Lerner Center Community Scholars Grant: Pilot Trial to Test
    the Feasibility of Interventions to Improve Healthy Food
    Access in Baltimore City Food Pantries

    View Slide

  11. Formative Research

    View Slide

  12. © 2014, Johns Hopkins University. All rights reserved.
    © 2014, Johns Hopkins University. All rights reserved.
    © 2014, Johns Hopkins University. All rights reserved.
    ©2015, Johns Hopkins University. All rights reserved.
    ©2016, Johns Hopkins University. All rights reserved.
    ©2018, Johns Hopkins University. All rights reserved.
    Specific Aims of Formative Research in Food
    Pantries
    1. To conduct formative research on the role of food pantries
    in Baltimore City's food environment and on pantry
    operations
    2. To develop and pilot a food pantry data collection
    instrument (Food Pantry Environmental Checklist, FPEC)
    3. To assess the variability of healthy foods and beverages
    offered at food pantries

    View Slide

  13. © 2014, Johns Hopkins University. All rights reserved.
    © 2014, Johns Hopkins University. All rights reserved.
    © 2014, Johns Hopkins University. All rights reserved.
    ©2015, Johns Hopkins University. All rights reserved.
    ©2016, Johns Hopkins University. All rights reserved.
    ©2018, Johns Hopkins University. All rights reserved.
    Formative Research Methods
    • 22 food pantries (annual distribution)
    • 7 small (<10,000)
    • 10 medium (>=10,000 to <25,000)
    • 5 large (>=25,000)
    • In-depth interviews with food pantry managers (n=23)
    • Direct observations of food pantry settings (n=23)
    • 3 repeated FPEC visits, approx. 1 month apart (n=22)

    View Slide

  14. ©2015, Johns Hopkins University. All rights reserved.
    ©2015, Johns Hopkins University. All rights reserved.
    ©2016, Johns Hopkins University. All rights reserved.
    ©2018, Johns Hopkins University. All rights reserved.
    FPEC Data Collection
    Table 1. Food Pantry Distribution Methods
    Small
    (n=7)
    Medium
    (n=10)
    Large
    (n=5)
    Distributes pre-packed
    bags, %
    71 80 60
    Follows the client choice
    model, %
    71 40 40
    Fills bags per client
    requests, %
    14 50 60

    View Slide

  15. ©2015, Johns Hopkins University. All rights reserved.
    ©2015, Johns Hopkins University. All rights reserved.
    ©2016, Johns Hopkins University. All rights reserved.
    ©2018, Johns Hopkins University. All rights reserved.
    Table 2. Food Pantry Guidelines for Food Procurement,
    Distribution and Policy Changes
    Small
    (n=7)
    Mediu
    m
    (n=10)
    Large
    (n=5)
    Gives suggestions on cooking, % 100 60 60
    Escorts clients into the food pantry, % 71 50 40
    Makes changes to orders based on client
    feedback, %
    57 50 60
    Encourages clients to pick up items, % 43 70 80
    Has a limit on how often a client can pick
    up food, %
    43 40 100
    Requires permission from
    board/supervisor to implement changes,
    %
    43 40 60
    Allows clients to swap out items from
    bags, %
    29 70 40

    View Slide

  16. Header/Full Bleed Image
    Name/Subject Subhead
    Title/caption
    Title/caption
    ©2015, Johns Hopkins University. All rights reserved.
    ©2015, Johns Hopkins University. All rights reserved.
    ©2018, Johns Hopkins University. All rights reserved.
    0.0
    0.5
    1.0
    1.5
    2.0
    2.5
    3.0
    FPEC1 FPEC2 FPEC3
    Average Nutrition Education Materials Score*
    Small
    (n=7)
    Medium
    (n=10)
    Large
    (n=5)
    * Maximum score is 3; food pantries receive 1 point each for the availability of shelf labels, posters, and flyers.
    Availability of Nutrition Education Materials in Baltimore City Food
    Pantries

    View Slide

  17. Header/Full Bleed Image
    Name/Subject Subhead
    Title/caption
    Title/caption
    ©2015, Johns Hopkins University. All rights reserved.
    ©2015, Johns Hopkins University. All rights reserved.
    ©2018, Johns Hopkins University. All rights reserved.
    0
    50
    100
    150
    200
    250
    300
    350
    Average Number of Clients Served
    in Last 2 Weeks
    Small
    (n=7)
    Medium
    (n=10)
    Large
    (n=5)
    FPEC 2 FPEC 3
    FPEC 1
    Client Volume in Baltimore City Food Pantries

    View Slide

  18. Header/Full Bleed Image
    Name/Subject Subhead
    Title/caption
    Title/caption
    ©2015, Johns Hopkins University. All rights reserved.
    ©2015, Johns Hopkins University. All rights reserved.
    ©2018, Johns Hopkins University. All rights reserved.
    0
    100
    200
    300
    400
    500
    600
    700
    FPEC1 FPEC2 FPEC3
    Average Number of Estimated Volunteer
    Hours in Last 2 Weeks
    Small
    (n=7)
    Medium
    (n=10)
    Large
    (n=5)
    Volunteer Hours at Baltimore City Food Pantries

    View Slide

  19. Header/Full Bleed Image
    Name/Subject Subhead
    Title/caption
    Title/caption
    ©2015, Johns Hopkins University. All rights reserved.
    ©2015, Johns Hopkins University. All rights reserved.
    ©2018, Johns Hopkins University. All rights reserved.
    0.0
    0.5
    1.0
    1.5
    2.0
    2.5
    3.0
    3.5
    4.0
    4.5
    5.0
    FPEC1 FPEC2 FPEC3
    Average Lean Meat Availability Score*
    Small
    (n=7)
    Medium
    (n=10)
    Large
    (n=5)
    *Maximum score is 5; food pantries receive 1 point each for the availability of unseasoned fresh/frozen chicken
    breast, unseasoned fresh/frozen turkey, >85% lean fresh/frozen ground beef, canned chicken in water, and canned
    fish in water.
    Availability of Canned and Fresh Lean Meats in Baltimore City Food
    Pantries

    View Slide

  20. Header/Full Bleed Image
    Name/Subject Subhead
    Title/caption
    Title/caption
    ©2015, Johns Hopkins University. All rights reserved.
    ©2015, Johns Hopkins University. All rights reserved.
    ©2018, Johns Hopkins University. All rights reserved.
    0.0
    0.5
    1.0
    1.5
    2.0
    2.5
    3.0
    3.5
    4.0
    FPEC1 FPEC2 FPEC3
    Average Produce Availability Score*
    Small
    (n=7)
    Medium
    (n=10)
    Large
    (n=5)
    *Maximum score is 4; food pantries receive 1 point each for the availability of unseasoned frozen vegetables,
    unsweetened frozen fruits, fresh vegetables, and fresh fruits.
    Availability of Fresh and Frozen Fruit/Veg in Baltimore City Food
    Pantries

    View Slide

  21. Header/Full Bleed Image
    Name/Subject Subhead
    Title/caption
    Title/caption
    ©2015, Johns Hopkins University. All rights reserved.
    ©2015, Johns Hopkins University. All rights reserved.
    ©2018, Johns Hopkins University. All rights reserved.
    0.0
    0.5
    1.0
    1.5
    2.0
    2.5
    3.0
    3.5
    4.0
    FPEC1 FPEC2 FPEC3
    Average Whole Grain Availability Score*
    Small
    (n=7)
    Medium
    (n=10)
    Large
    (n=5)
    *Maximum score is 4; food pantries receive 1 point each for the availability of brown rice, 100% whole wheat pasta,
    100% whole wheat bread, and plain oatmeal
    Availability of Whole Grains in Baltimore City Food Pantries

    View Slide

  22. Header/Full Bleed Image
    Name/Subject Subhead
    Title/caption
    Title/caption
    ©2015, Johns Hopkins University. All rights reserved.
    ©2015, Johns Hopkins University. All rights reserved.
    ©2018, Johns Hopkins University. All rights reserved.
    0.0
    0.5
    1.0
    1.5
    2.0
    2.5
    3.0
    3.5
    4.0
    4.5
    5.0
    FPEC1 FPEC2 FPEC3
    Average Low-Sugar Drink Availability Score*
    Small
    (n=7)
    Medium
    (n=10)
    Large
    (n=5)
    *Maximum score is 5; food pantries receive 1 point each for the availability of diet soda, diet sports drinks,
    unsweetened tea/iced tea, water or sparkling water, and 100% fruit juice.
    Availability of Low-Sugar Drinks in Baltimore City Food Pantries

    View Slide

  23. ©2015, Johns Hopkins University. All rights reserved.
    ©2015, Johns Hopkins University. All rights reserved.
    ©2016, Johns Hopkins University. All rights reserved.
    ©2018, Johns Hopkins University. All rights reserved.
    Summary: Opportunities for Intervention
    • Food availability: No pantry had much variety of healthy
    options
    • Small pantries were less likely than medium or large to have low-
    sodium canned items, lean meats, and fresh/frozen fruits and
    vegetables
    • Infrastructure: Small pantries were less likely than
    medium or large pantries to have refrigerators
    • Client support: Small pantries were more likely than
    medium or large to have staff/volunteers escort clients
    through the pantry and give suggestions on how to
    prepare foods

    View Slide

  24. Header/Full Bleed Image
    Name/Subject Subhead
    Title/caption
    Title/caption
    ©2015, Johns Hopkins University. All rights reserved.
    ©2015, Johns Hopkins University. All rights reserved.
    ©2018, Johns Hopkins University. All rights reserved.
    Food Bank Food Pantry Household Individual
    Food Availability
    Food Pricing
    Grants for
    Network Member
    Capacity
    Manager Training
    Resources
    Food Pantry
    Policy
    Manager Skills
    Point of Selection
    Promotion
    Education
    Annual Income
    Sociodemographic
    Food Security
    Food Selection
    Foodways
    Food Preparation
    Psychosocial Factors
    Knowledge
    Self-efficacy
    Intentions
    Food Taste
    Outcome
    Reduced intake of:
    SSB and high-fat foods
    Increased intake of:
    Fruits, vegetables, lean
    proteins, whole grains
    Food Consumption
    Conceptual Framework for Food Bank and Food Pantry
    Operations
    Proposed Intervention Framework

    View Slide

  25. Next Steps: Feasibility Trial

    View Slide

  26. ©2015, Johns Hopkins University. All rights reserved.
    ©2015, Johns Hopkins University. All rights reserved.
    ©2016, Johns Hopkins University. All rights reserved.
    ©2018, Johns Hopkins University. All rights reserved.
    Feasibility Trial: Fresh Shelves, Healthy
    Pantries
    • Multilevel Intervention Plan
    • 6 food pantries: 1 intervention and 1
    comparison from each size category (i.e. small,
    medium, large)
    • 3 phases, each focusing on a different food
    group
    • Testing out a combination of manager training,
    educational/environmental strategies, and
    pantry-level policy within each phase

    View Slide

  27. Header/Full Bleed Image
    Name/Subject Subhead
    Title/caption
    Title/caption
    ©2015, Johns Hopkins University. All rights reserved.
    ©2015, Johns Hopkins University. All rights reserved.
    ©2018, Johns Hopkins University. All rights reserved.
    Intervention Plan for Fresh Shelves, Healthy Pantries
    Intervention
    Phase (Focus)
    Food Pantry Staff Capacity
    Building (In-person training)
    Educational/
    Environmental
    Strategies
    Policy
    1: Lean, Low-
    Sodium
    Proteins
    Video
    Posters; Healthy
    options at eye level
    Minimum requirements
    2: Fresh,
    Frozen and
    Canned
    Produce
    Educational display
    Recipe cards; Healthy
    options at entrance
    Minimum requirements
    3: Healthy
    Carbohydrates
    Booklet Shelf labels; Posters
    Limits to stocking less
    healthy options
    Funded by the Community Scholars Grant awarded by the Lerner Center for Health Communication and
    Promotion

    View Slide

  28. Header/Full Bleed Image
    Name/Subject Subhead
    Title/caption
    Title/caption
    ©2015, Johns Hopkins University. All rights reserved.
    ©2015, Johns Hopkins University. All rights reserved.
    ©2018, Johns Hopkins University. All rights reserved.
    Months 1-2
    Jul-Aug 2018
    Project Start
    - IRB Approval
    - Recruitment
    Months 3-4
    Sep-Oct 2018
    - Material Development
    - Baseline Data Collection
    Months 5-6
    Nov-Dec 2018
    Phase 1: Lean & Low-
    Sodium Proteins
    Months 7-8
    Jan-Feb 2019
    Phase 2: Fruits &
    Vegetables
    Months 9-10
    Mar-Apr 2019
    Phase 3: Healthy
    Carbohydrates
    Month 11
    May 2019
    Post-Intervention
    Data Collection
    Month 12
    June 2019
    - Analysis
    - Manuscript and
    Deliverable Preparation

    View Slide

  29. ©2015, Johns Hopkins University. All rights reserved.
    ©2015, Johns Hopkins University. All rights reserved.
    ©2016, Johns Hopkins University. All rights reserved.
    ©2018, Johns Hopkins University. All rights reserved.
    Fresh Shelves, Healthy Pantries Evaluation
    Approaches
    • Client bag audits, at baseline and at project
    completion
    – 10 clients from each food pantry
    – Contents of client bags, sociodemographic characteristics,
    exposure to intervention at project completion
    • Food Assortment Scoring Tool (FAST) to see the weight of foods in
    each food group and calculate a healthfulness score for bags

    View Slide

  30. ©2015, Johns Hopkins University. All rights reserved.
    ©2015, Johns Hopkins University. All rights reserved.
    ©2016, Johns Hopkins University. All rights reserved.
    ©2018, Johns Hopkins University. All rights reserved.
    Evaluation Approaches cont.
    • Modified FPEC, at baseline and end of each phase
    – Availability of promoted and de-promoted options; changes in
    food pantry guidelines
    • In-depth interviews with food pantry managers at project completion
    – Feedback on intervention materials and new policies

    View Slide

  31. Questions?
    Thank You!
    ©2018, Johns Hopkins University. All rights reserved.
    Tim Regan
    [email protected]
    Bengucan Gunen
    [email protected]
    Joel Gittelsohn
    [email protected]
    Sally Yan
    [email protected]
    www.healthyfoodsystems.net

    View Slide

  32. #CAUSINGCHANGEMFB

    View Slide