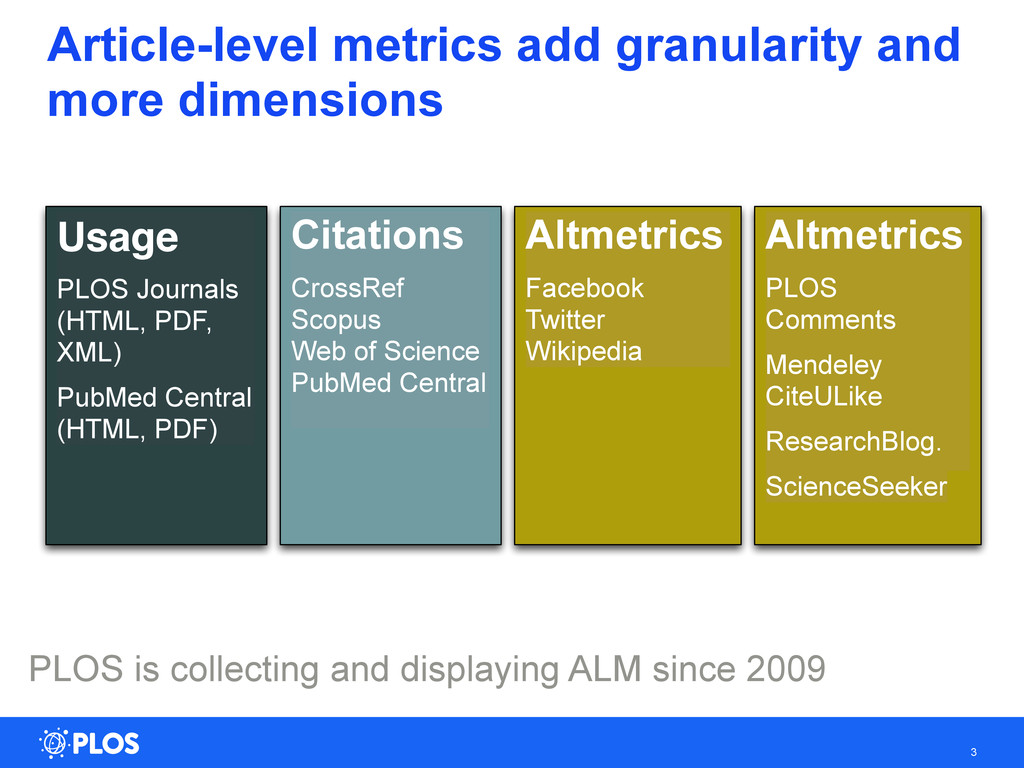
collecting and displaying ALM since 2009 Usage PLOS Journals (HTML, PDF, XML) PubMed Central (HTML, PDF) Citations CrossRef Scopus Web of Science PubMed Central Altmetrics Facebook Twitter Wikipedia Altmetrics PLOS Comments Mendeley CiteULike ResearchBlog. ScienceSeeker
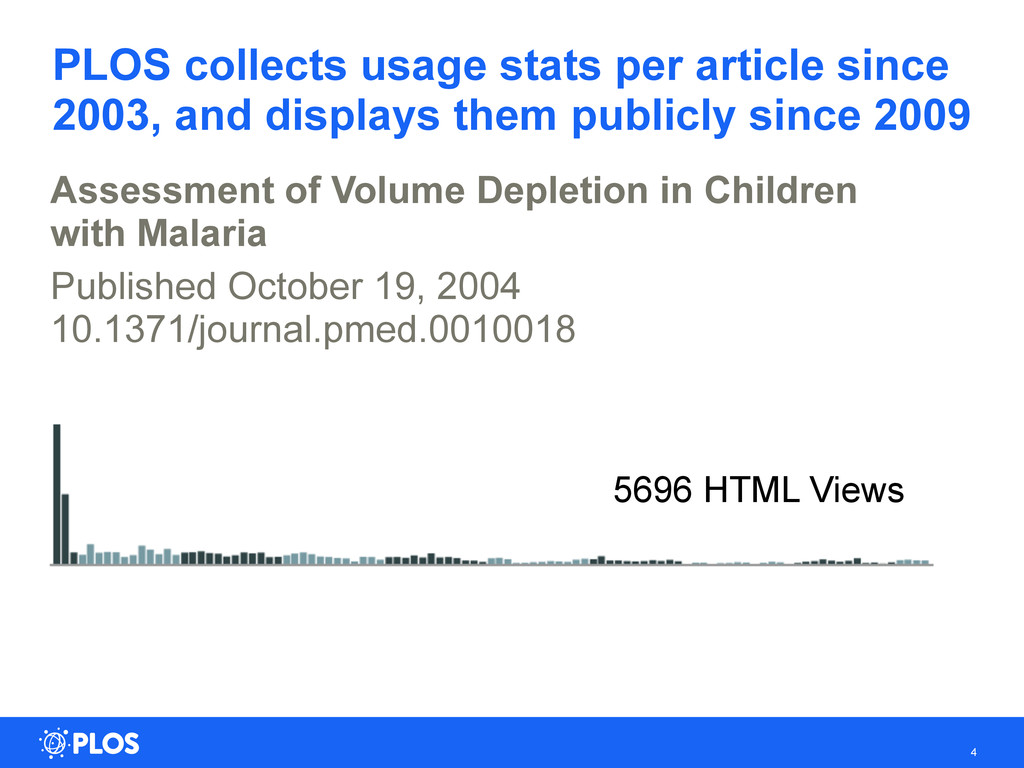
them publicly since 2009 Assessment of Volume Depletion in Children with Malaria Published October 19, 2004 10.1371/journal.pmed.0010018 4 5696 HTML Views
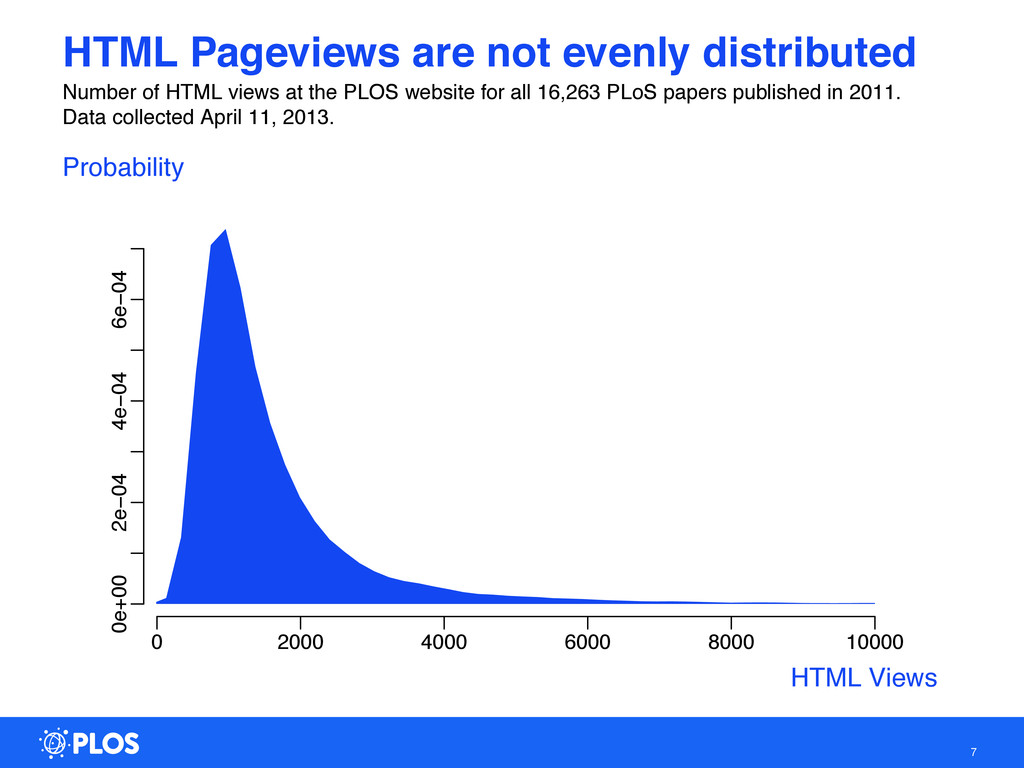
6e−04 HTML Pageviews are not evenly distributed Number of HTML views at the PLOS website for all 16,263 PLoS papers published in 2011. Data collected April 11, 2013. HTML Views Probability
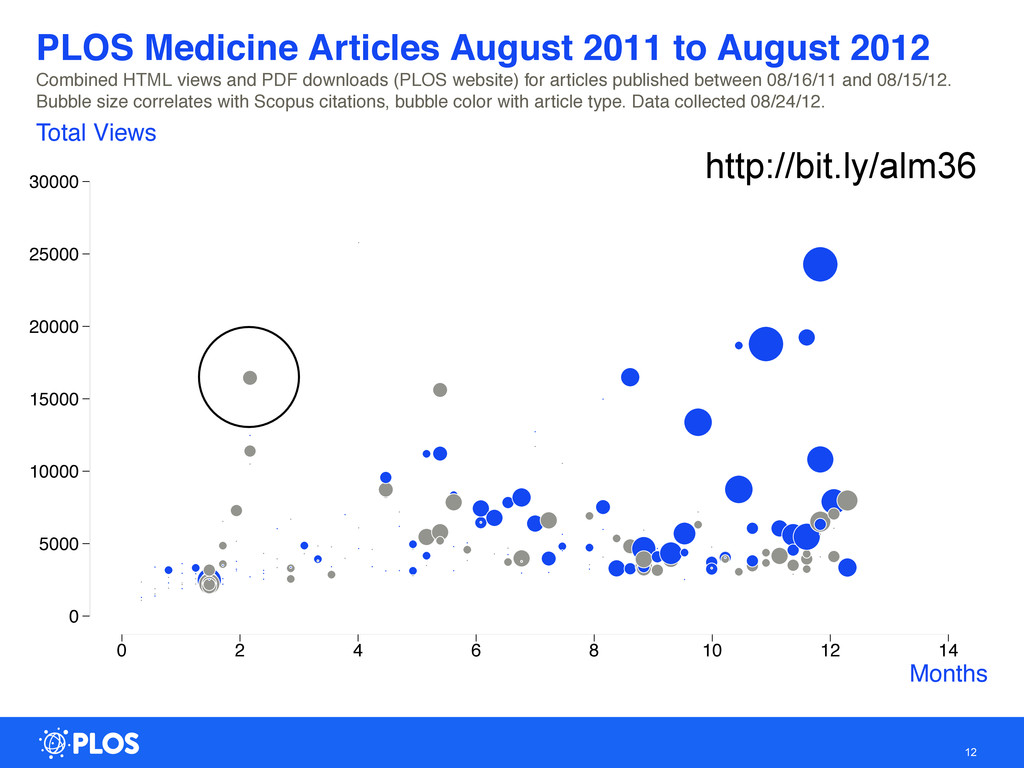
5000 10000 15000 20000 25000 30000 PLOS Medicine Articles August 2011 to August 2012 Combined HTML views and PDF downloads (PLOS website) for articles published between 08/16/11 and 08/15/12. Bubble size correlates with Scopus citations, bubble color with article type. Data collected 08/24/12. Months Total Views http://bit.ly/alm36
6000 8000 10000 12000 14000 PLOS Articles from the Big Food collection Tweets vs. HTML views at PLOS for articles in the Big Food collection. Circle size correlates with Facebook activity. Data collected August 19, 2012. Tweets HTML Views
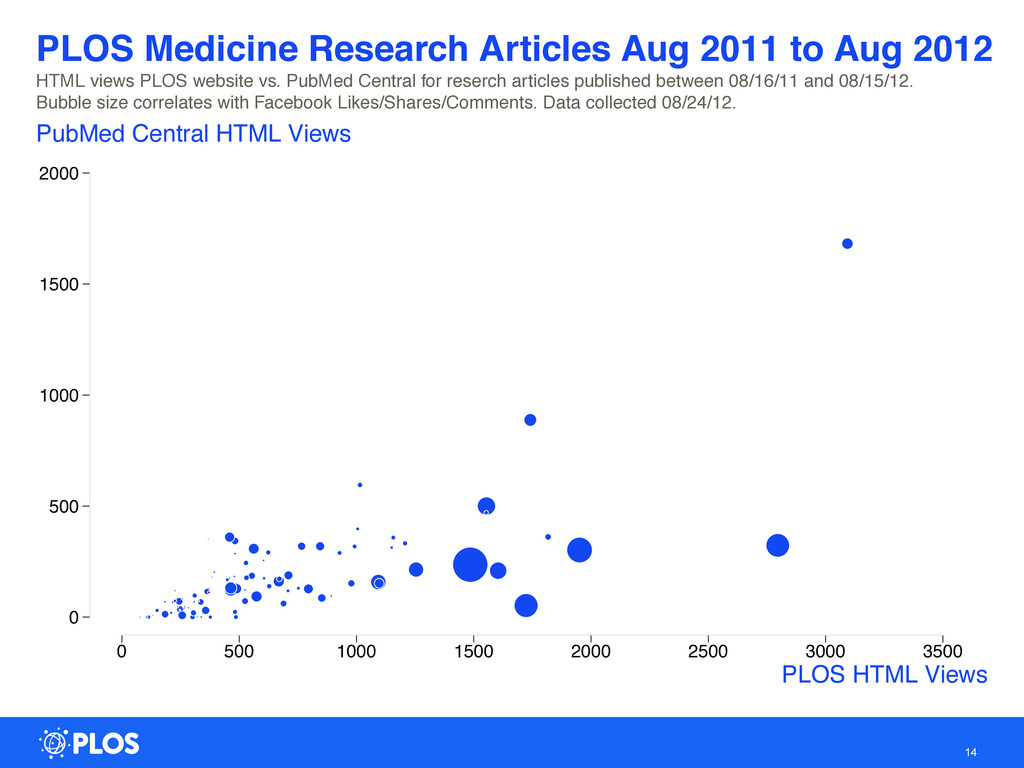
500 1000 1500 2000 PLOS Medicine Research Articles Aug 2011 to Aug 2012 HTML views PLOS website vs. PubMed Central for reserch articles published between 08/16/11 and 08/15/12. Bubble size correlates with Facebook Likes/Shares/Comments. Data collected 08/24/12. PLOS HTML Views PubMed Central HTML Views
of Death in the United States: Comparative Risk Assessment of Dietary, Lifestyle, and Metabolic Risk Factors 10.1371/journal.pmed.1000058 Preferred Reporting Items for Systematic Reviews and Meta-Analyses: The PRISMA Statement 10.1371/journal.pmed.1000097 Initial Severity and Antidepressant Benefits: A Meta-Analysis of Data Submitted to the Food and Drug Administration 10.1371/journal.pmed.0050045 Lifetime Medical Costs of Obesity: Prevention No Cure for Increasing Health Expenditure 10.1371/journal.pmed.0050029 HTML views per month from PLOS website, data collected April 18, 2013
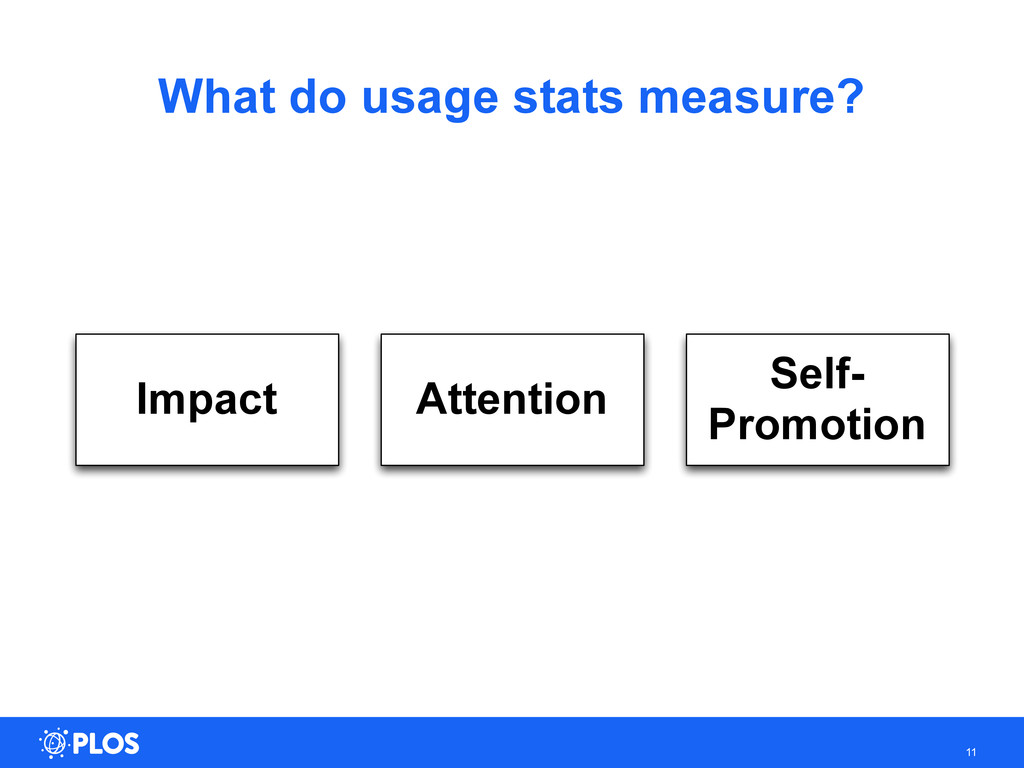
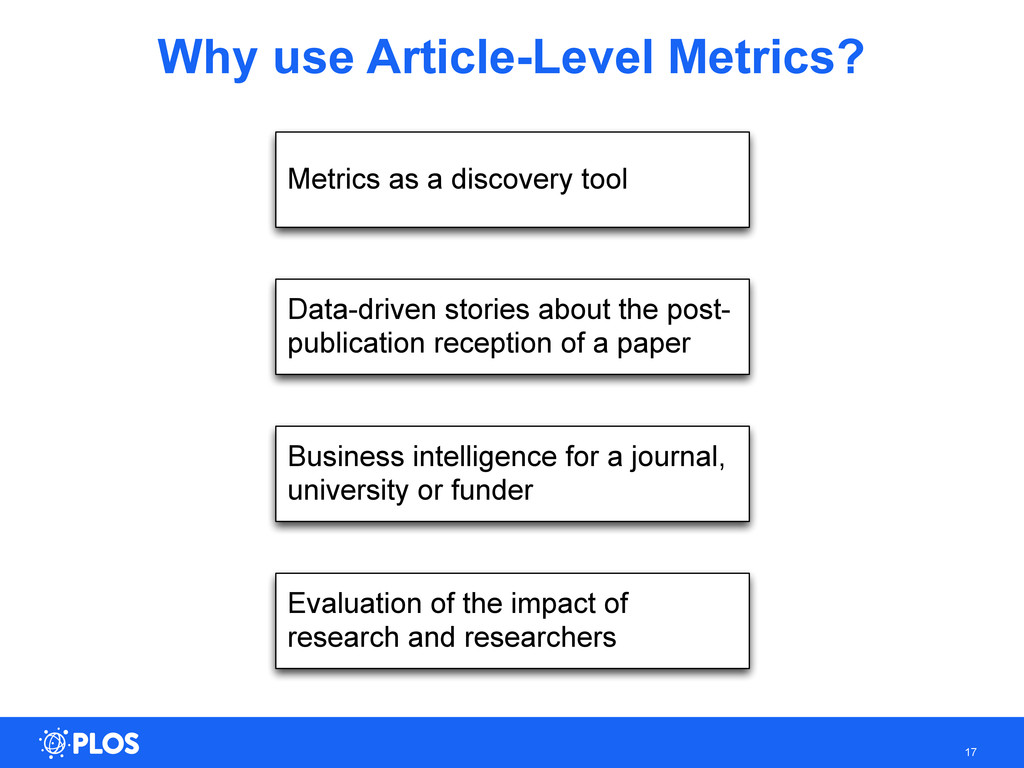
publication reception of a paper Business intelligence for a journal, university or funder Evaluation of the impact of research and researchers Metrics as a discovery tool