$30 off During Our Annual Pro Sale. View Details »

Visualizing Large 3D city models in the Web

Visualizing Large 3D city models in the Web

In this 1.5h tutorial that I gave at the Web3D 2014 conference in Vancouver, BC, Canada I presented different tools to prepare large geospatial data sets (in particular 3D city models), so they can be visualized in the Web.

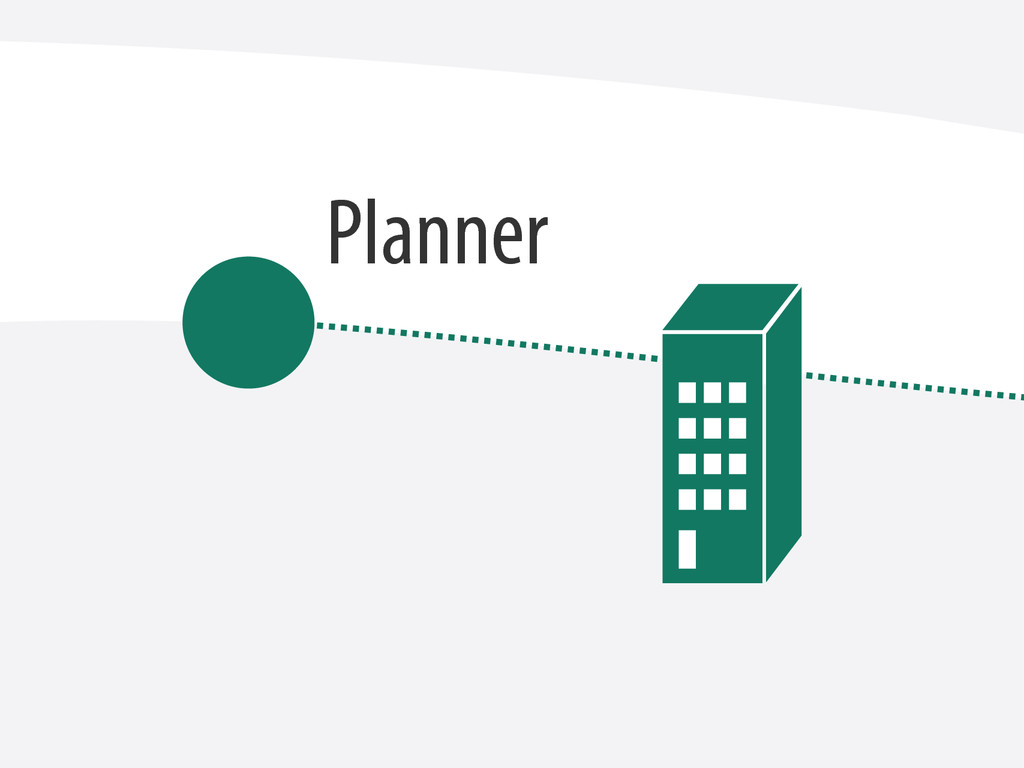
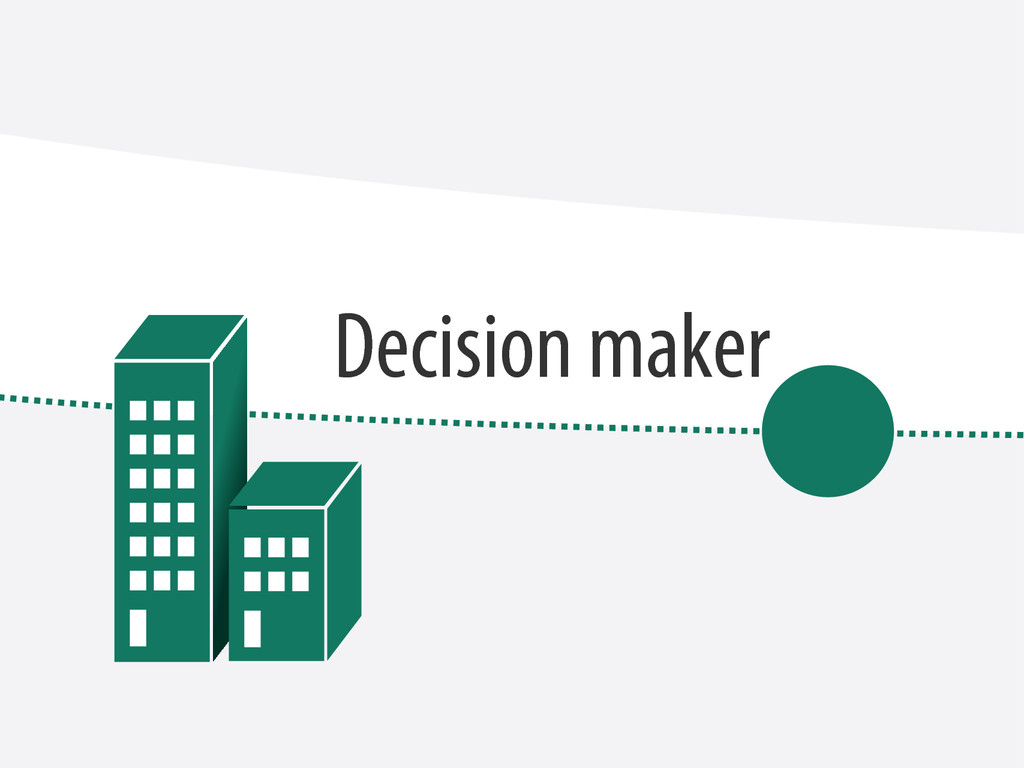
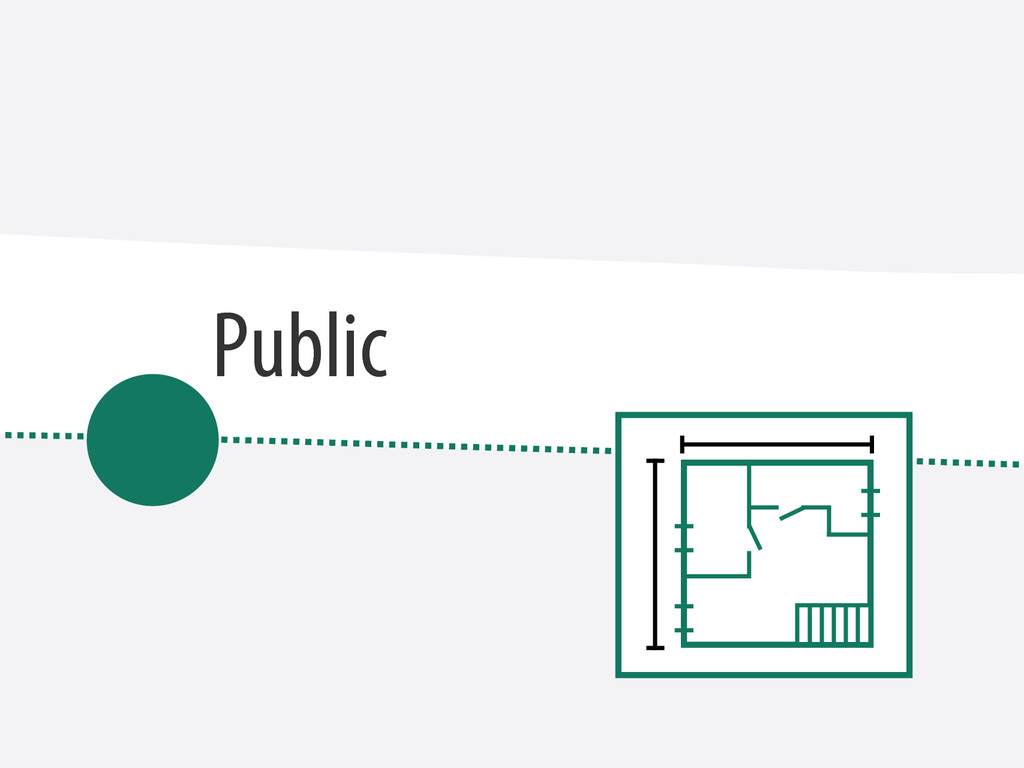
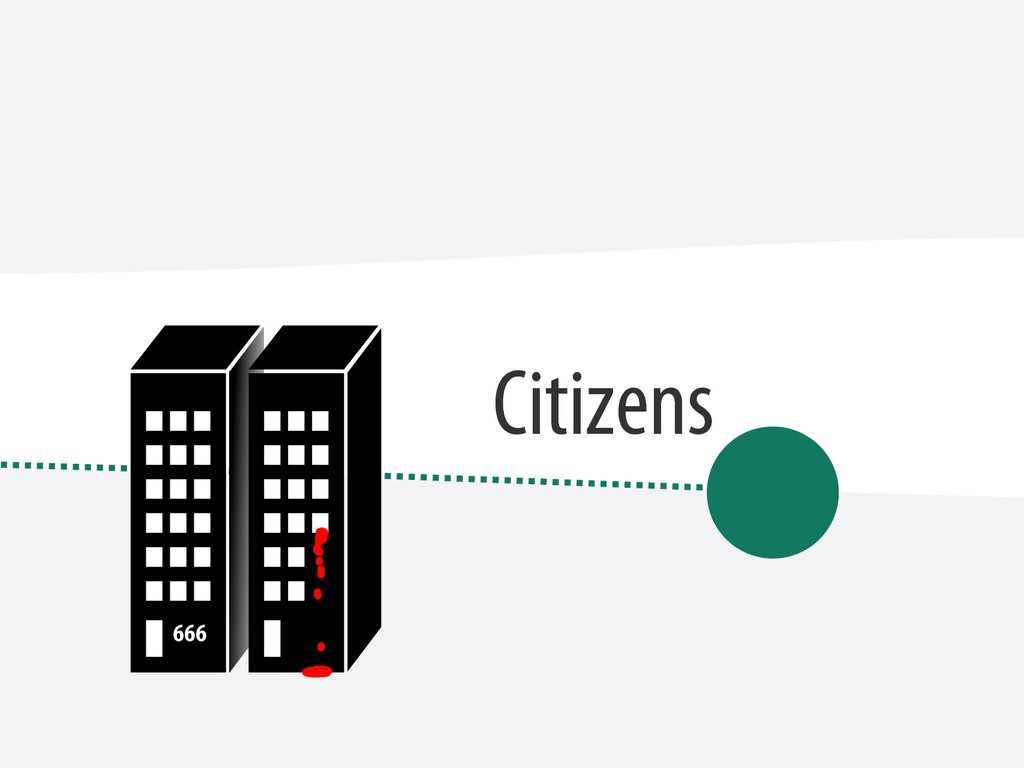
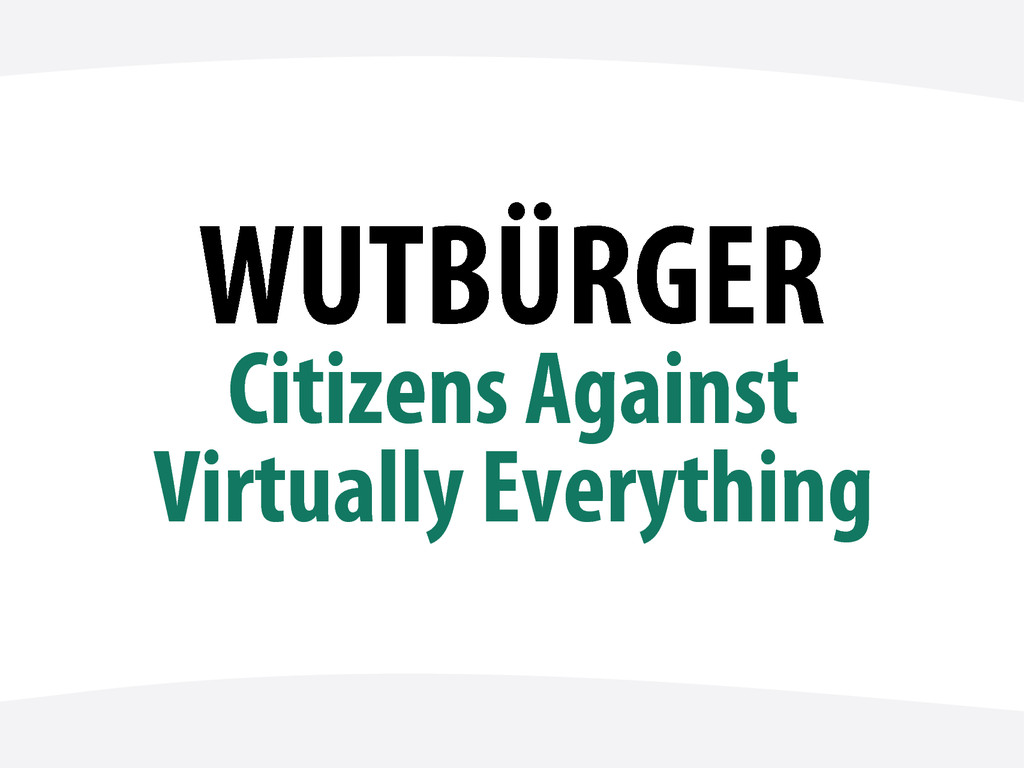
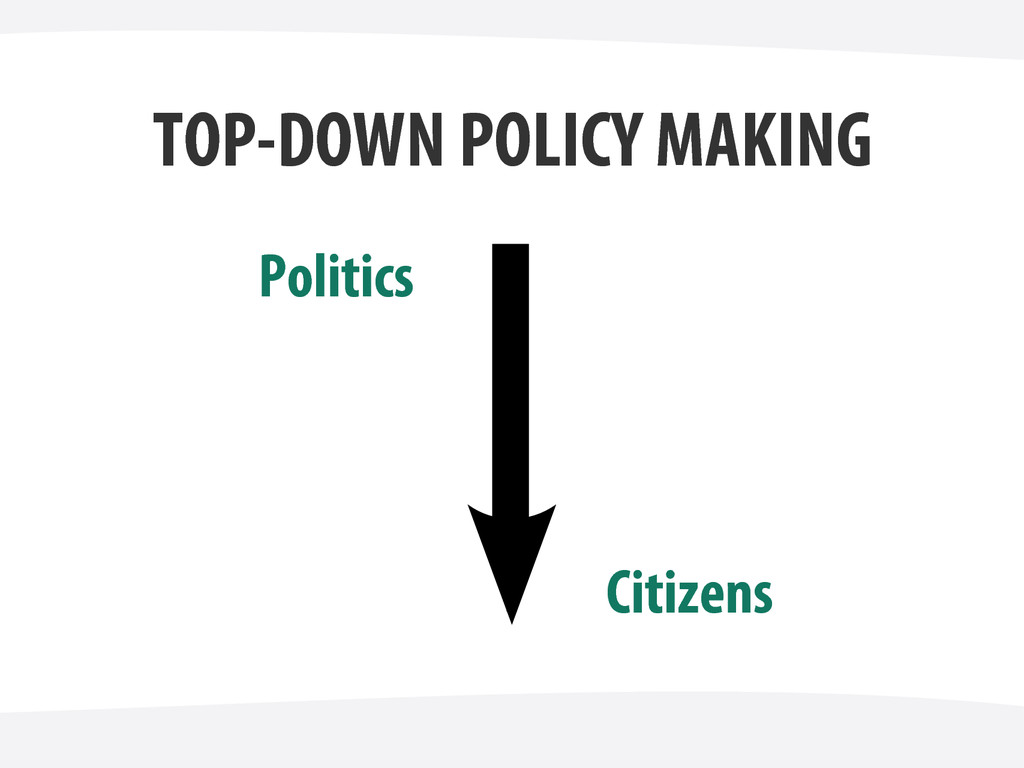
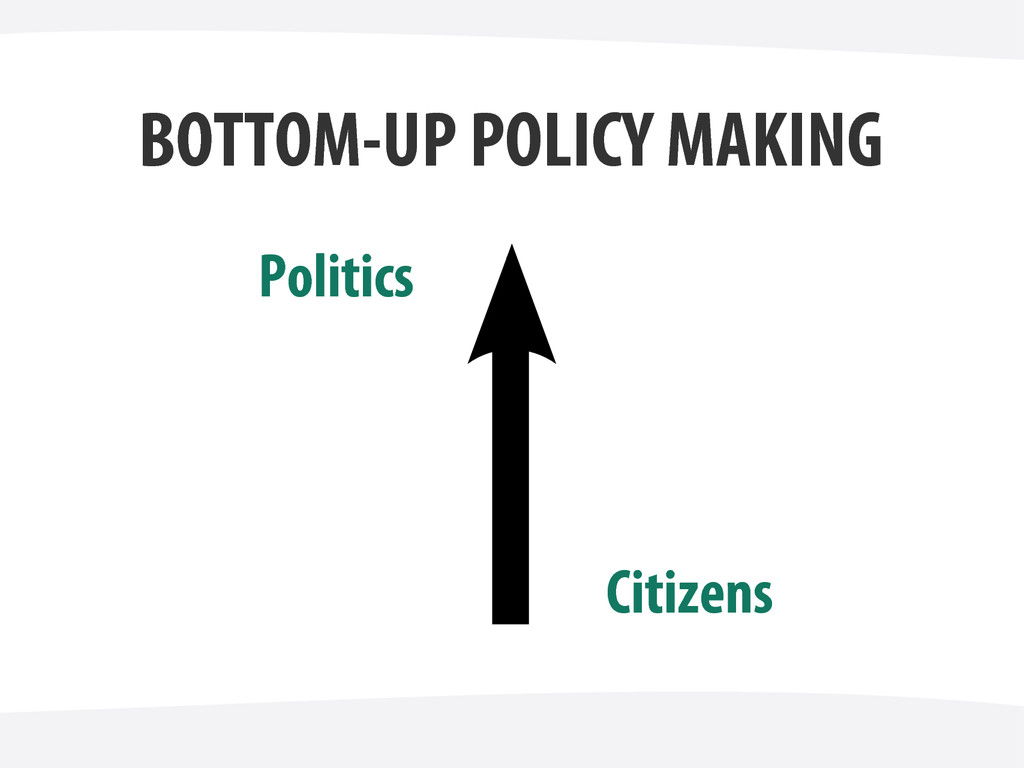
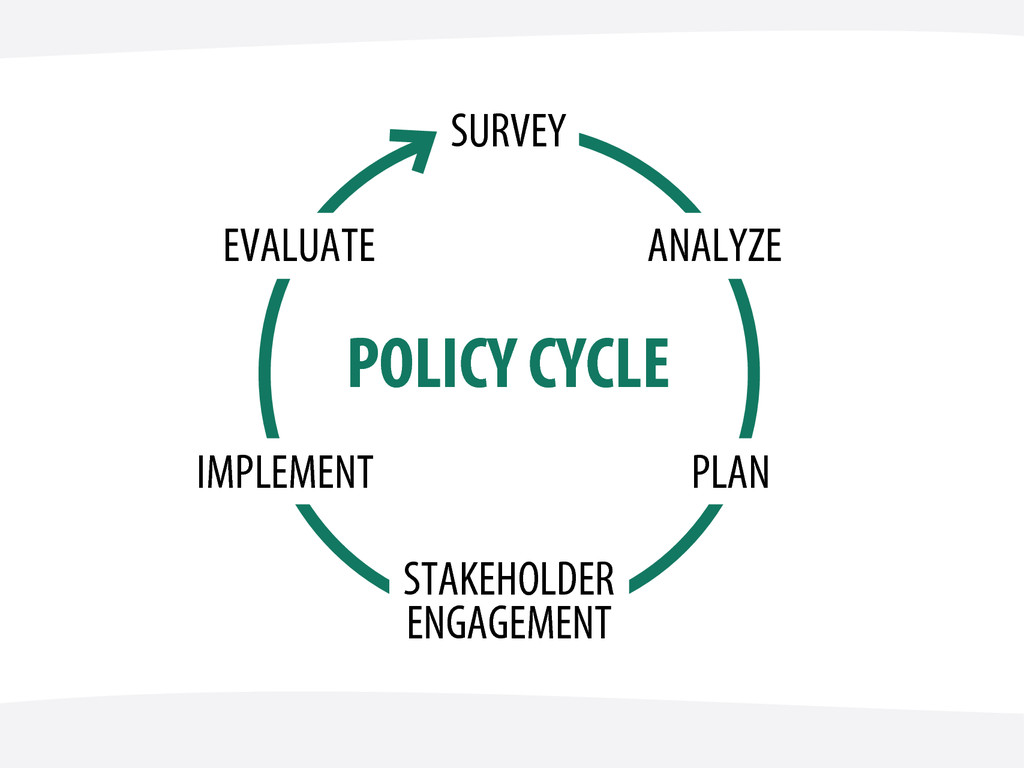
The presentation starts with a motivating example explaining how 3D city models in the Web can help urban planners and decision makers to present their policy plans to the public to engage all stakeholders in the planning process.

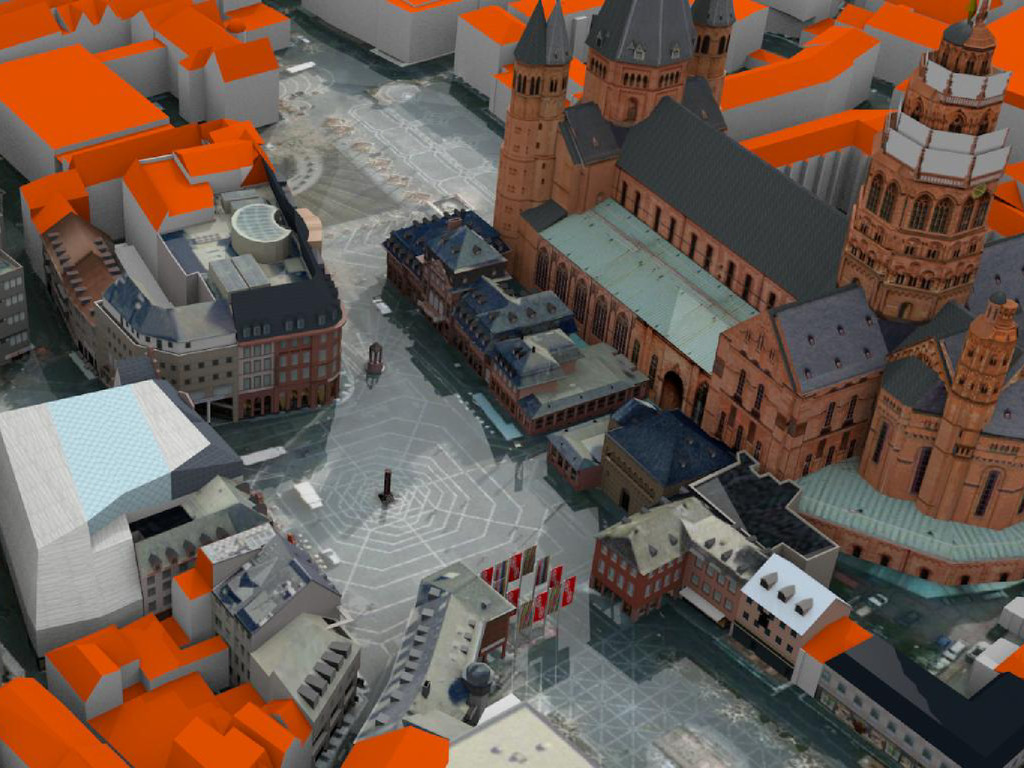
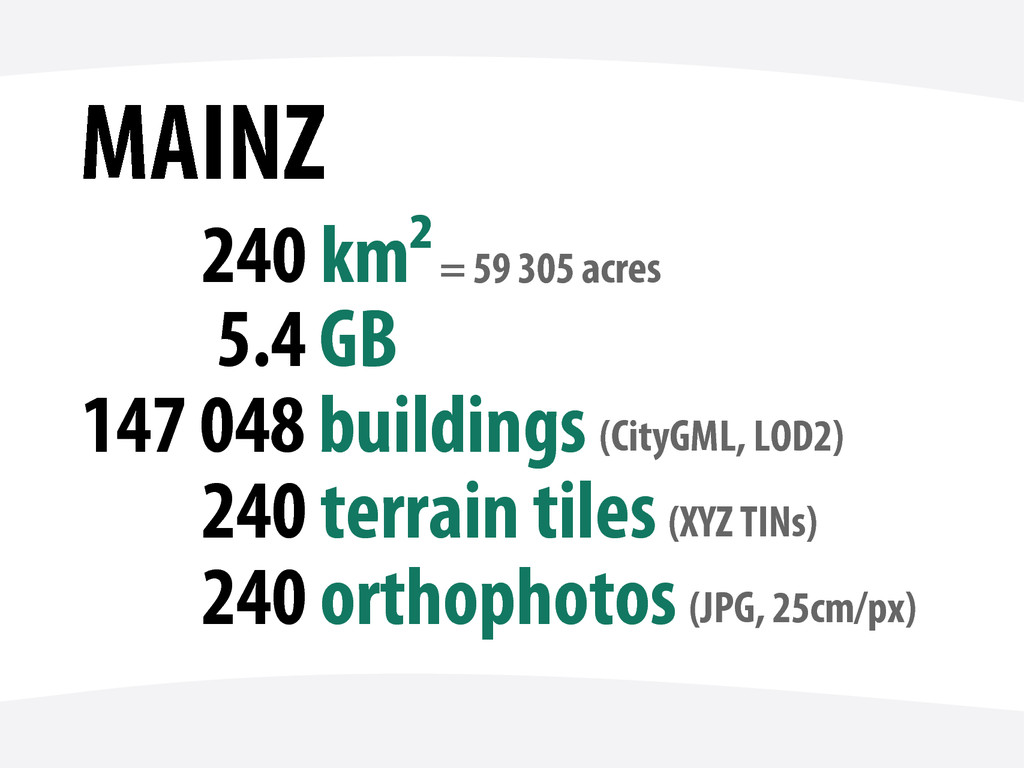
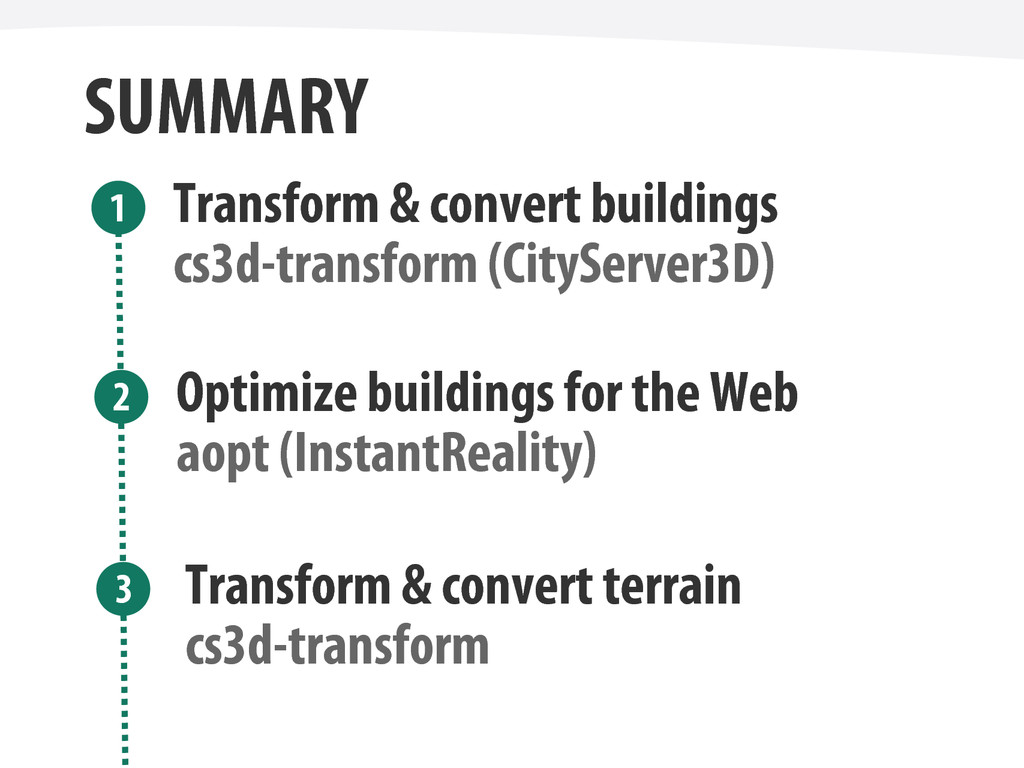
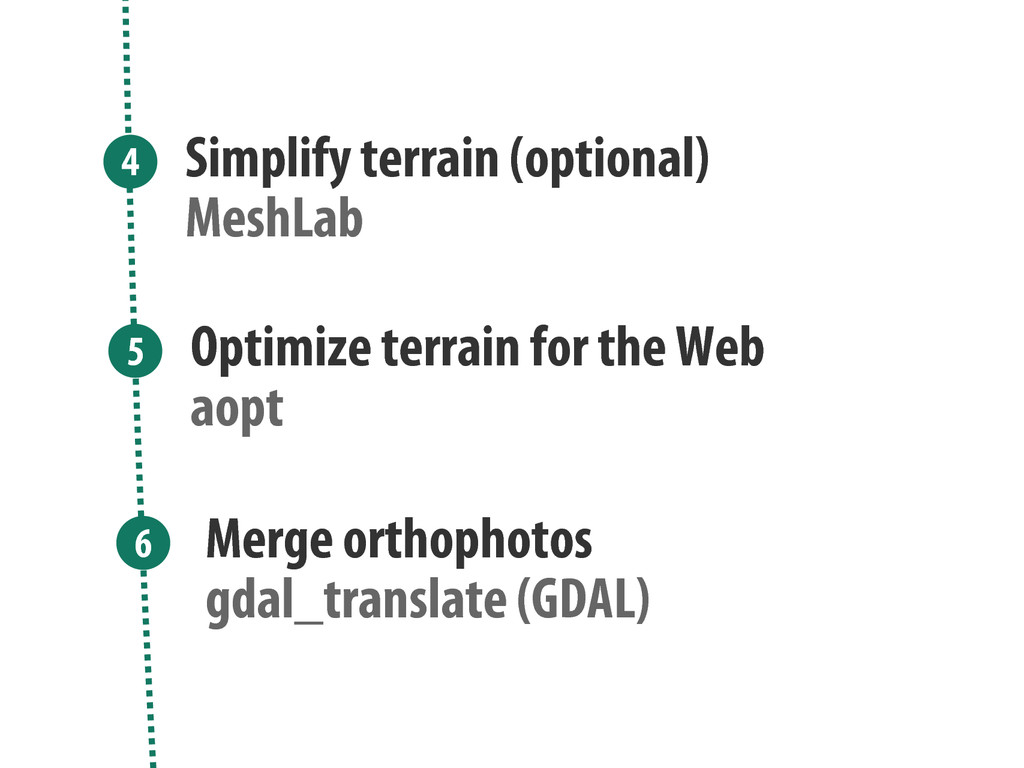
Most of the talk consisted of a live demo where I actually converted a large CityGML model to X3D to put it into the web browser using WebGL/X3DOM.

Michel Krämer

August 09, 2014
Tweet

More Decks by Michel Krämer

Other Decks in Education

Transcript

  1. VISUALIZING LARGE 3D CITY MODELS IN
    THE WEB (FOR PUBLIC PARTICIPATION)
    Michel Krämer

    View Slide

  2. View Slide

  3. PROJECT www.iqmulus.eu
    IQmulus

    View Slide

  4. PROJECT www.urbanapi.eu

    View Slide

  5. Planner

    View Slide

  6. Decision maker

    View Slide

  7. Public

    View Slide

  8. Public

    View Slide

  9. Citizens
    666

    View Slide

  10. NIMBY
    Not In My Backyard!

    View Slide

  11. LULU
    Locally Unpopular
    Land Use

    View Slide

  12. NIMFY
    Not In My Frontyard
    Either!

    View Slide

  13. NOPE
    Not On Planet Earth!

    View Slide

  14. CAVE
    Citizens Against
    Virtually Everything

    View Slide

  15. WUTBÜRGER
    Citizens Against
    Virtually Everything

    View Slide

  16. TOP-DOWN POLICY MAKING
    Politics
    Citizens

    View Slide

  17. BOTTOM-UP POLICY MAKING
    Politics
    Citizens

    View Slide

  18. POLICY CYCLE
    SURVEY
    ANALYZE
    PLAN
    STAKEHOLDER
    ENGAGEMENT
    IMPLEMENT
    EVALUATE

    View Slide

  19. HOW TO
    IMPLEMENT THIS?

    View Slide

  20. HOW TO
    REACH A
    AUDIENCE?
    LARGE

    View Slide

  21. HTML5 Logo by W3C

    View Slide

  22. WHAT ABOUT
    REALLY
    3D CITY MODELS?
    LARGE

    View Slide

  23. View Slide

  24. MAINZ
    240 km²
    147 048 buildings
    240 terrain tiles
    240 orthophotos (JPG, 25cm/px)
    (XYZ TINs)
    (CityGML, LOD2)
    5.4 GB
    = 59 305 acres

    View Slide

  25. STEPS
    Transform
    Convert
    Optimize
    Simplify
    Merge
    1 2 3 4 5

    View Slide

  26. SUMMARY
    Transform & convert buildings
    Optimize buildings for the Web
    1
    2
    3
    cs3d-transform (CityServer3D)
    aopt (InstantReality)
    Transform & convert terrain
    cs3d-transform

    View Slide

  27. Simplify terrain (optional)
    Optimize terrain for the Web
    4
    5
    6
    MeshLab
    aopt
    Merge orthophotos
    gdal_translate (GDAL)

    View Slide

  28. Merge and convert terrain
    Transform merged terrain
    7
    8
    9
    cs3d-merge
    MeshLab
    Simplify merged terrain
    MeshLab

    View Slide

  29. OUTLOOK
    X3DOM 2.0
    Shape Resource Container
    SRC – A Streamable Format for Generalized Web-based 3D Data Transmission
    Max Limper, Maik Thöner, Johannes Behr, Dieter W. Fellner
    Streaming in the Web
    OGC 3D Portrayal Service
    Workshop: Geospatial information on the Web, Mike McCann (& Volker Coors)
    Right after the break

    View Slide

  30. Michel Krämer
    Fraunhofer Institute for
    Computer Graphics Research IGD
    Fraunhoferstraße 5
    64283 Darmstadt, Germany
    [email protected]
    +49 6151 155 415

    View Slide