Upgrade to Pro
— share decks privately, control downloads, hide ads and more …
Speaker Deck
Features
Speaker Deck
PRO
Sign in
Sign up for free
Search
Search
GAFFTA Visualizing and Mapping Data, Day One
Search
migurski
February 10, 2012
Education
190
0
Share
Embed
Copy iframe code
Copy JS code
Copy link
Start on current slide
GAFFTA Visualizing and Mapping Data, Day One
migurski
February 10, 2012
More Decks by migurski
See All by migurski
GAFFTA Visualizing and Mapping Data, Day Four
migurski
0
790
GAFFTA Visualizing and Mapping Data, Day Three
migurski
0
920
GAFFTA Visualizing and Mapping Data, Day Two
migurski
2
140
Other Decks in Education
See All in Education
[2026前期火5] 論理学(京都大学文学部 前期 第9回)「正規化の停止性——ヒドラゲームによる証明」
yatabe
0
180
Throw Yourself In! - How I've learned English and What I'm Facing
georgeorge
1
190
Visionary Initiative: Materials-Positive Society 「モノの進化をポジティブな社会の原動力に」|Science Tokyo(東京科学大学)
sciencetokyo
PRO
0
680
Laura Wilson - The Quarterly PR Pivot
laurawilsonbseo1
1
370
Visionary Initiative: Future Intelligence — Laying the foundations for the future of science, intelligence, and society | Science Tokyo
sciencetokyo
PRO
0
140
Interaction - Lecture 10 - Information Visualisation (4019538FNR)
signer
PRO
0
2.7k
遊ぶかね欲しさの犯行(ルビ:労働)です
shirayanagiryuji
0
160
[2026前期火5] 論理学(京都大学文学部 前期 第11回)「ハーモニー:三層モデルと保存拡大」
yatabe
0
170
JAWS-UG初心者支部#81 GWにEduJAWSと何か作ろうもくもく会!
otsuki
0
150
2026年度春学期 統計学 第8回(オンデマンド配信回) 演習(1)・問題に対する答案の書き方 (2026. 5. 21)
akiraasano
PRO
0
130
[2026前期火5] 論理学(京都大学文学部 前期 第6回)「かつとまたはの規則」
yatabe
0
430
アラムコSTEAMチャレンジ 実践報告書
codeforeveryone
0
170
Featured
See All Featured
CSS Pre-Processors: Stylus, Less & Sass
bermonpainter
360
30k
The State of eCommerce SEO: How to Win in Today's Products SERPs - #SEOweek
aleyda
2
11k
Public Speaking Without Barfing On Your Shoes - THAT 2023
reverentgeek
1
460
Optimising Largest Contentful Paint
csswizardry
37
3.8k
My Coaching Mixtape
mlcsv
0
170
Tell your own story through comics
letsgokoyo
1
990
The Impact of AI in SEO - AI Overviews June 2024 Edition
aleyda
5
1.1k
JavaScript: Past, Present, and Future - NDC Porto 2020
reverentgeek
52
6k
The Curious Case for Waylosing
cassininazir
1
430
Mind Mapping
helmedeiros
PRO
1
280
技術選定の審美眼(2025年版) / Understanding the Spiral of Technologies 2025 edition
twada
PRO
118
120k
Distributed Sagas: A Protocol for Coordinating Microservices
caitiem20
333
23k
Transcript
Visualizing and Mapping Data Michal Migurski & Shawn Allen, Stamen
Design GAFFTA February 2012 http://sta.mn/633
Who is Stamen?
None
None
None
None
Day One: Dots On Maps
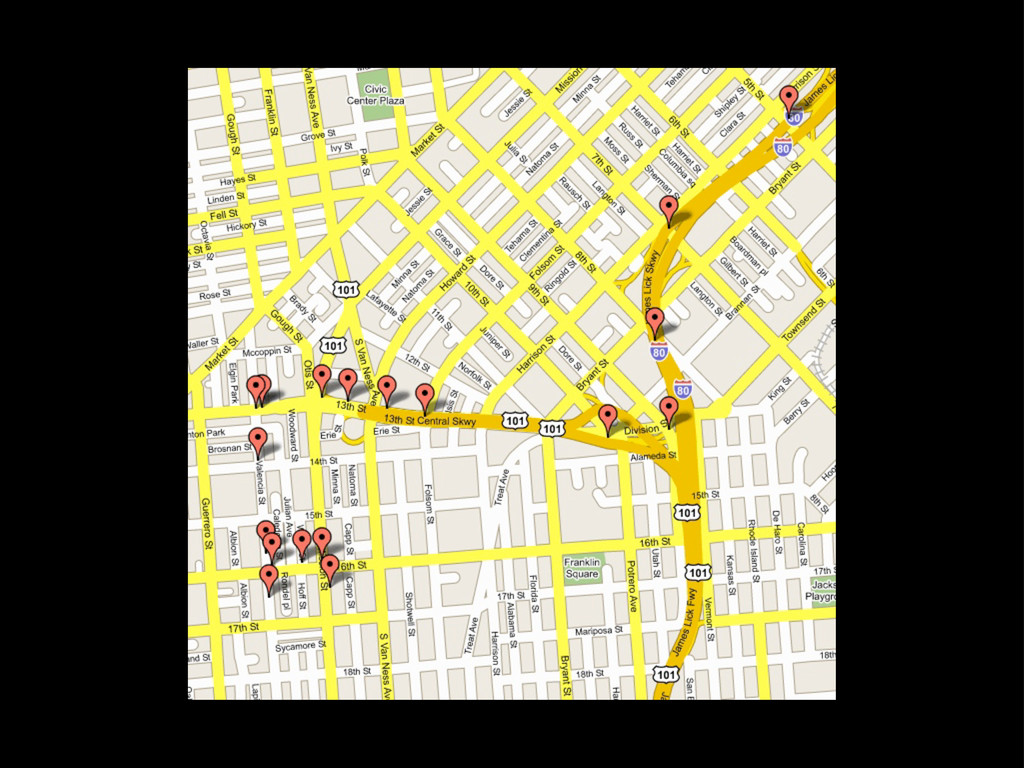
Dots
None
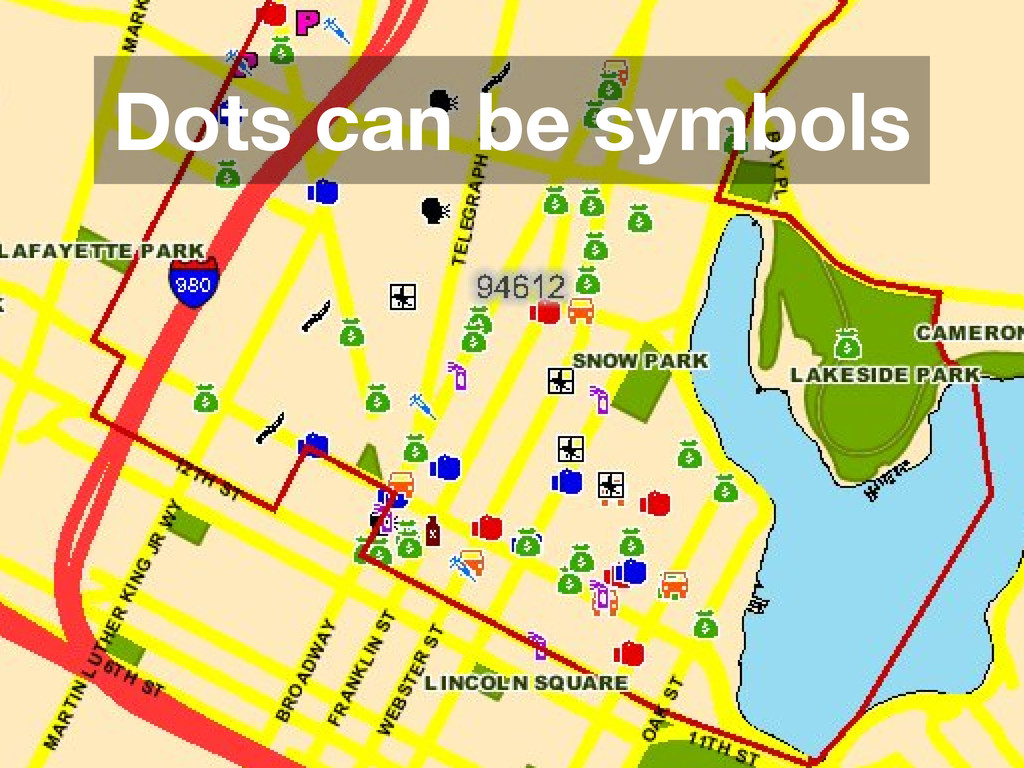
Dots can be symbols
Guessing Game
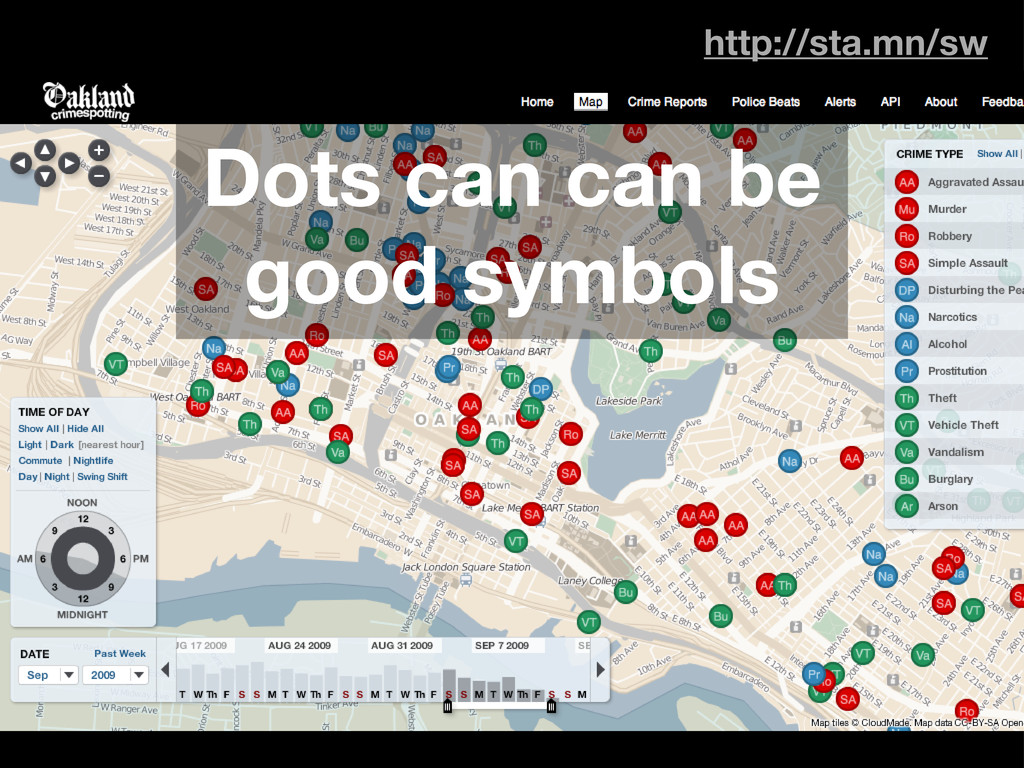
http://sta.mn/sw Dots can can be good symbols
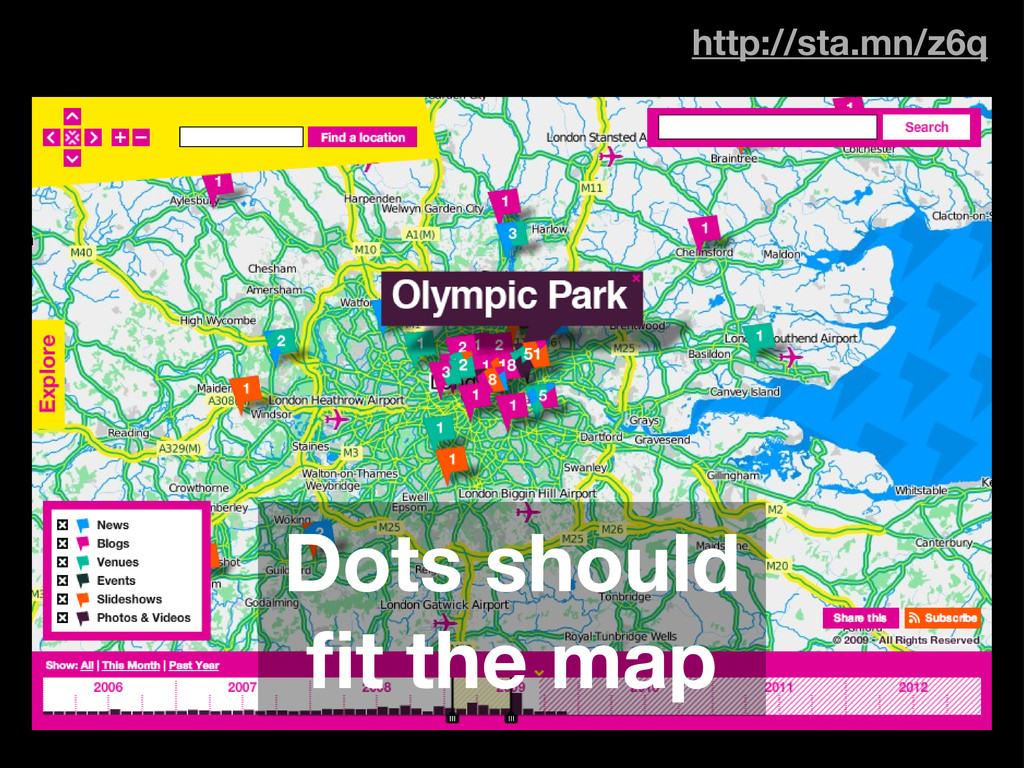
http://sta.mn/z6q Dots should fit the map
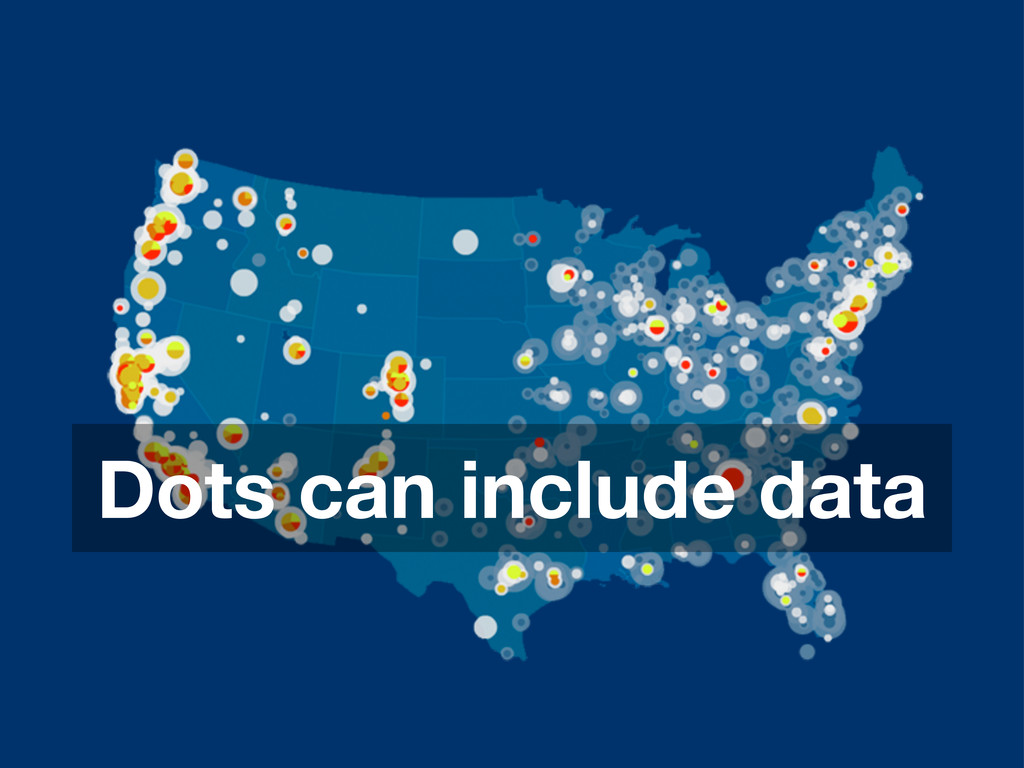
Dots can include data
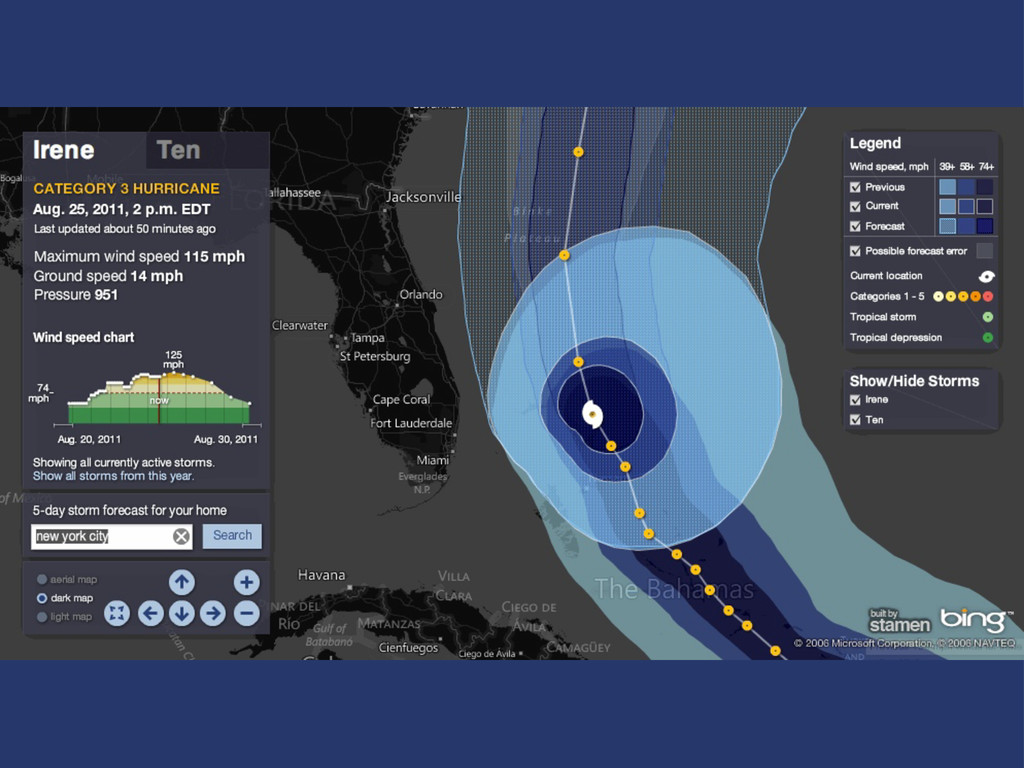
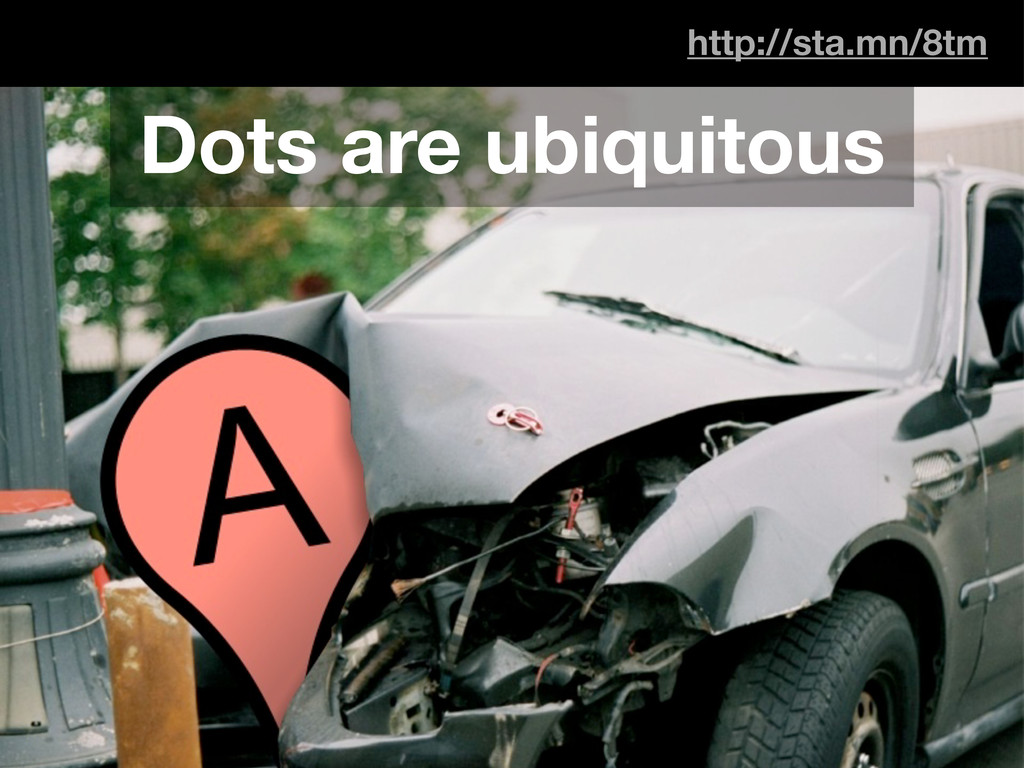
http://sta.mn/8tm Dots are ubiquitous
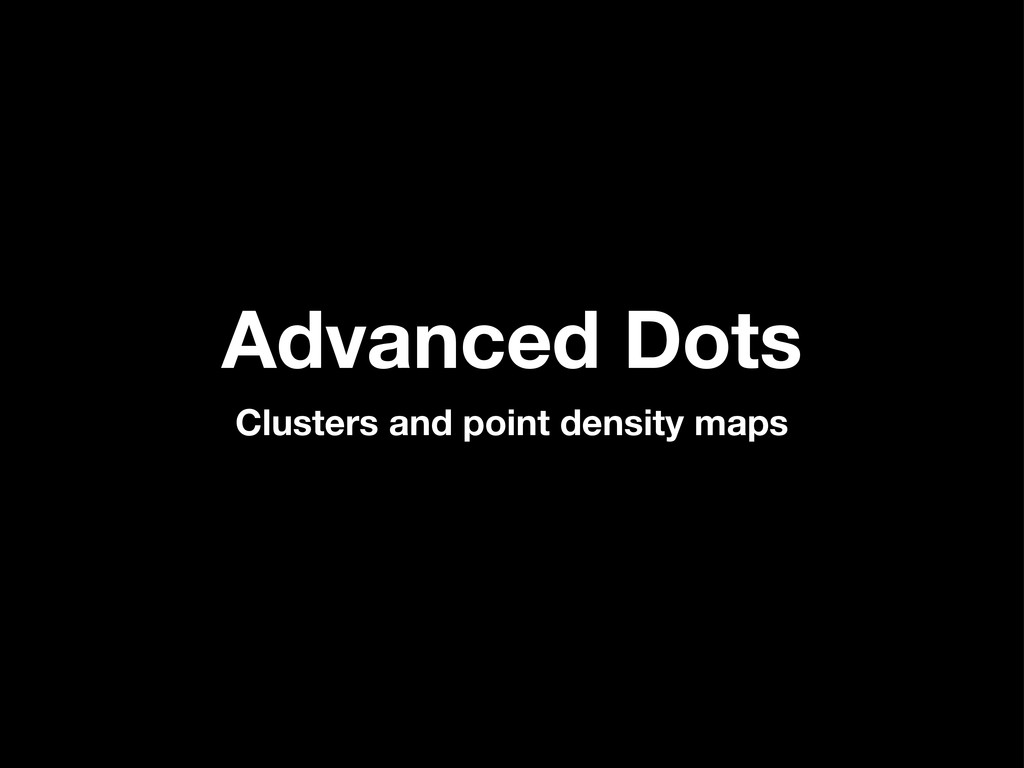
Advanced Dots Clusters and point density maps
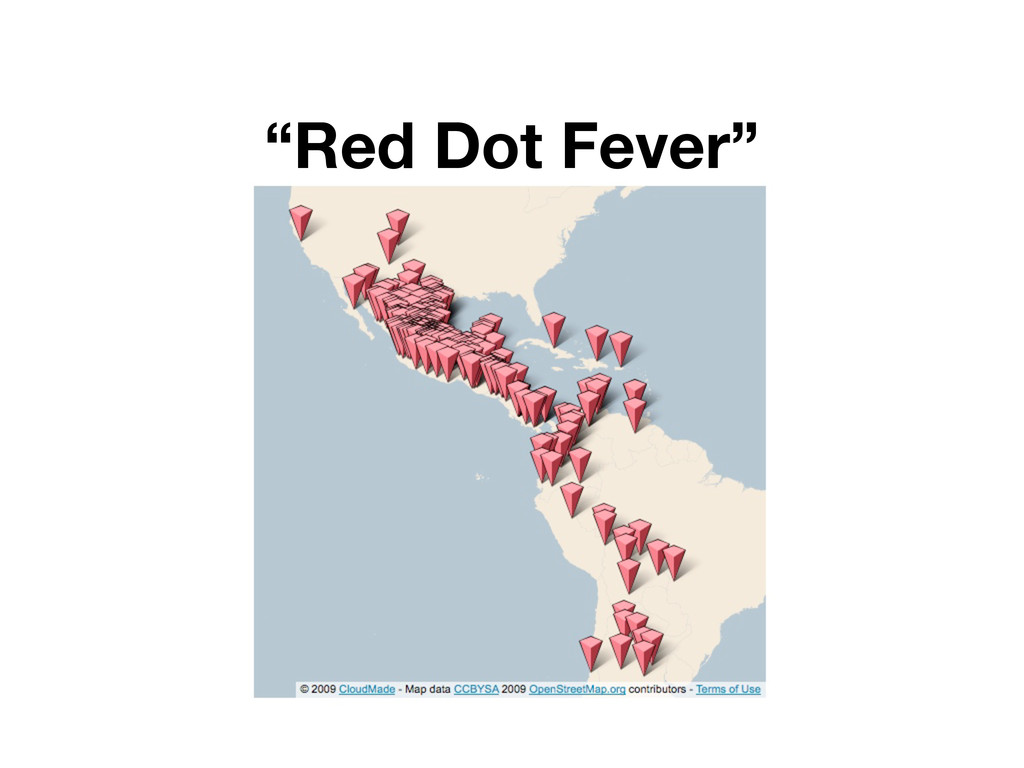
“Red Dot Fever”
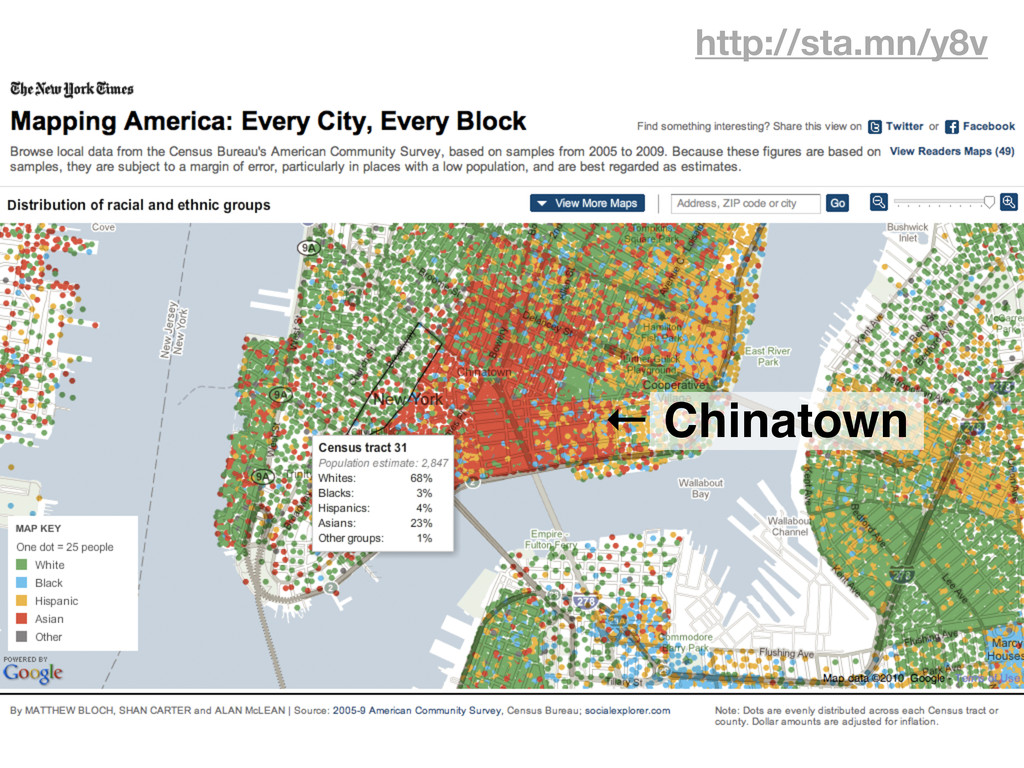
http://sta.mn/y8v ← Chinatown
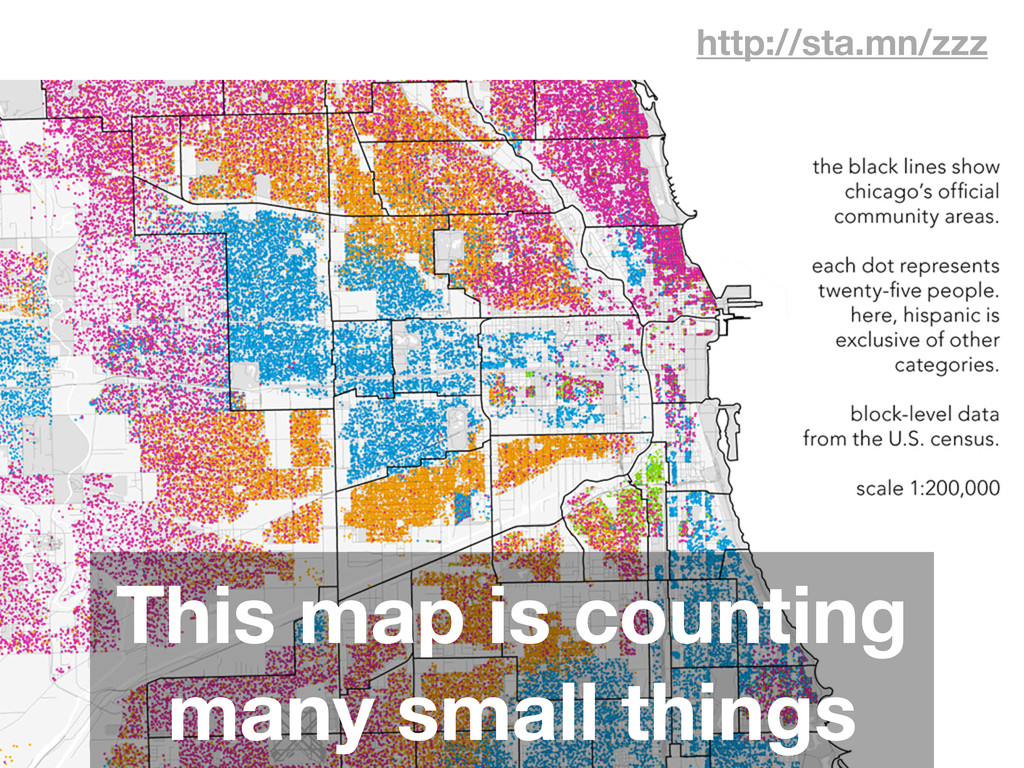
http://sta.mn/zzz This map is counting many small things
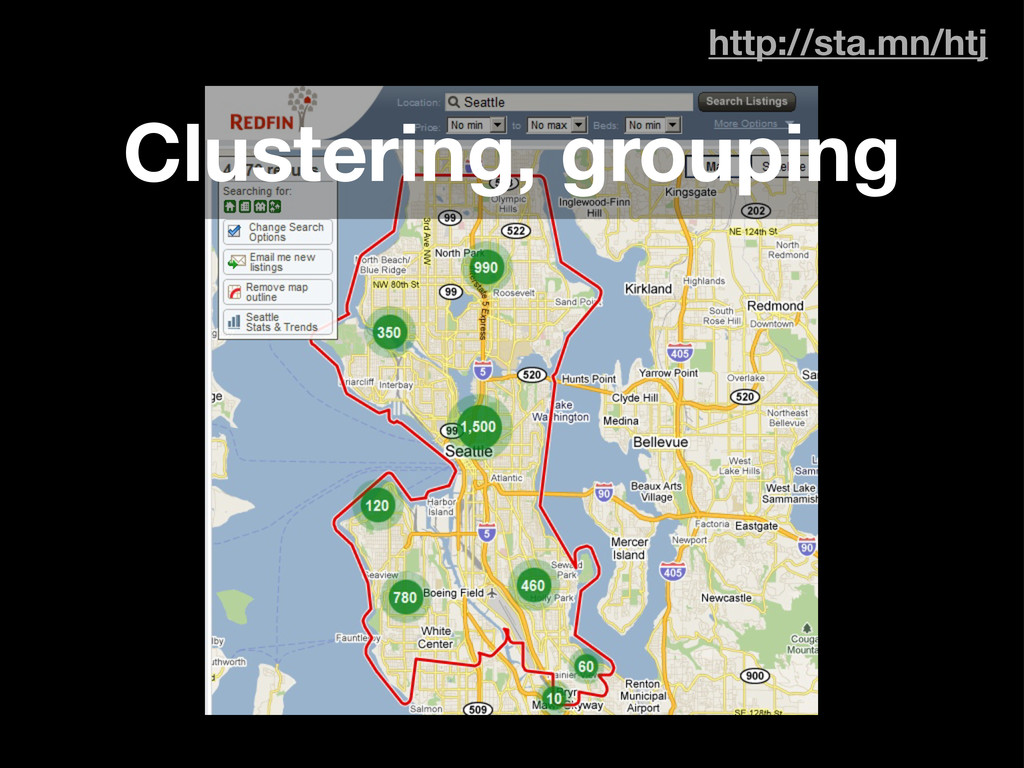
http://sta.mn/htj Clustering, grouping
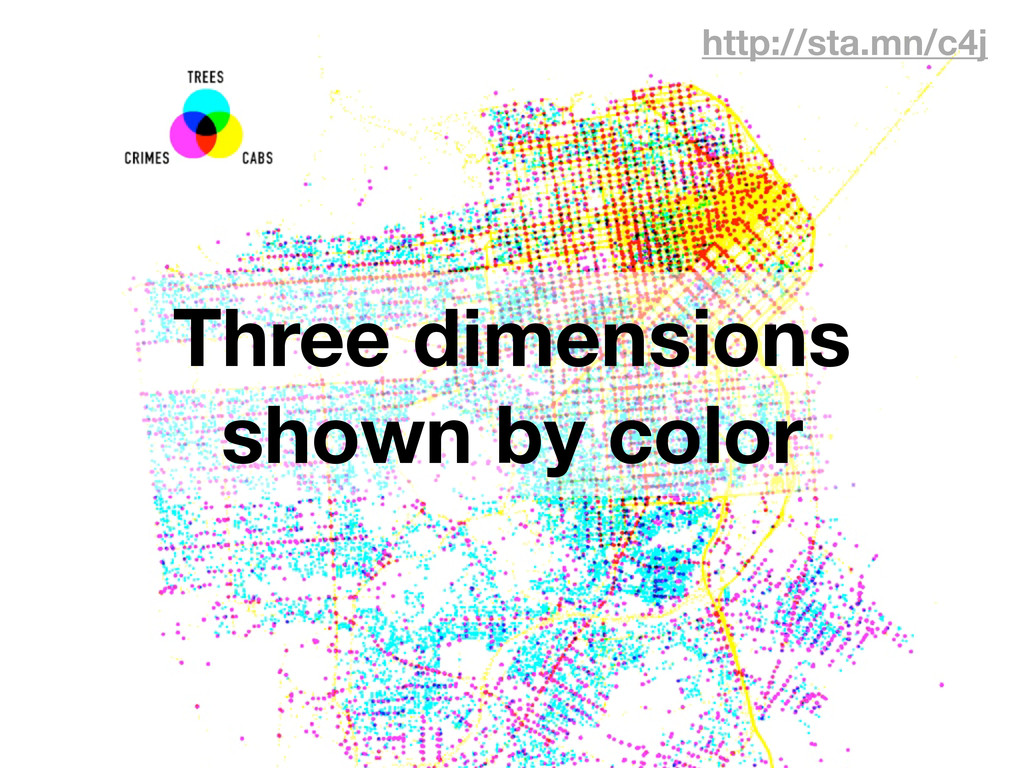
http://sta.mn/c4j Three dimensions shown by color
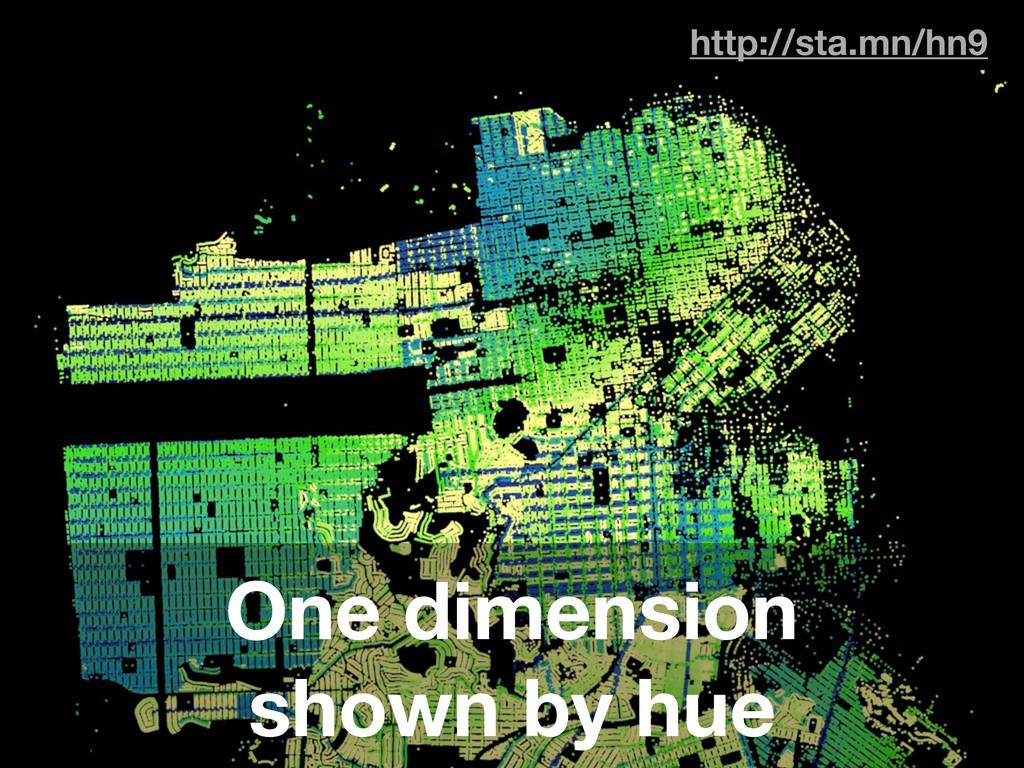
http://sta.mn/hn9 One dimension shown by hue
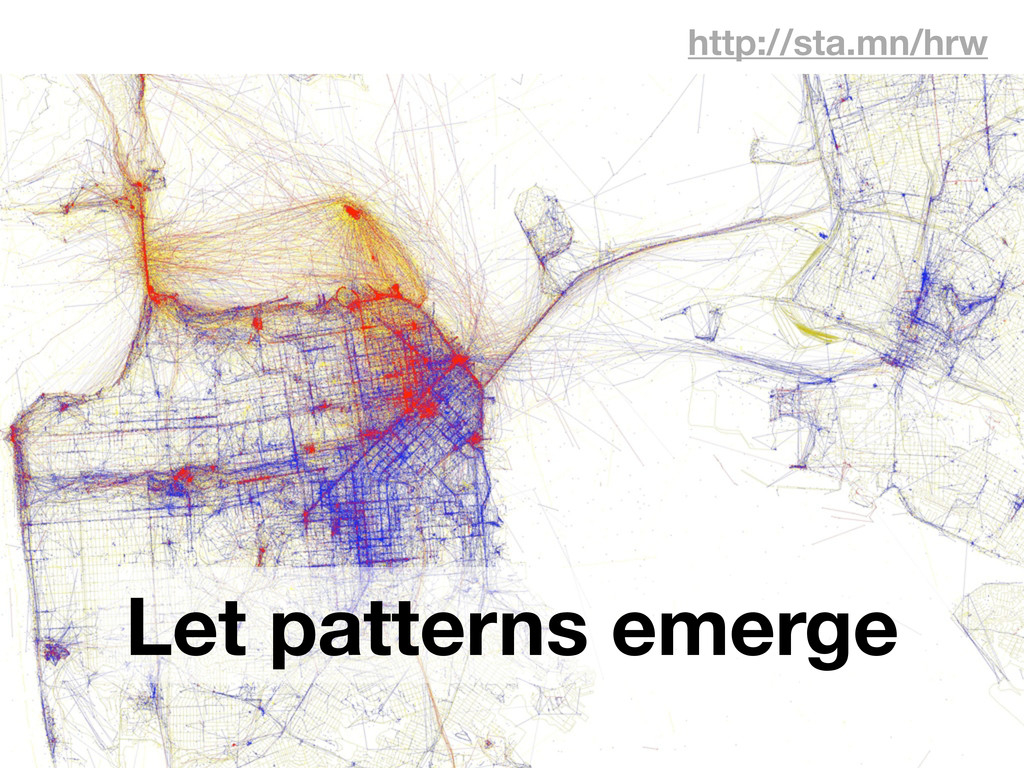
http://sta.mn/hrw Let patterns emerge
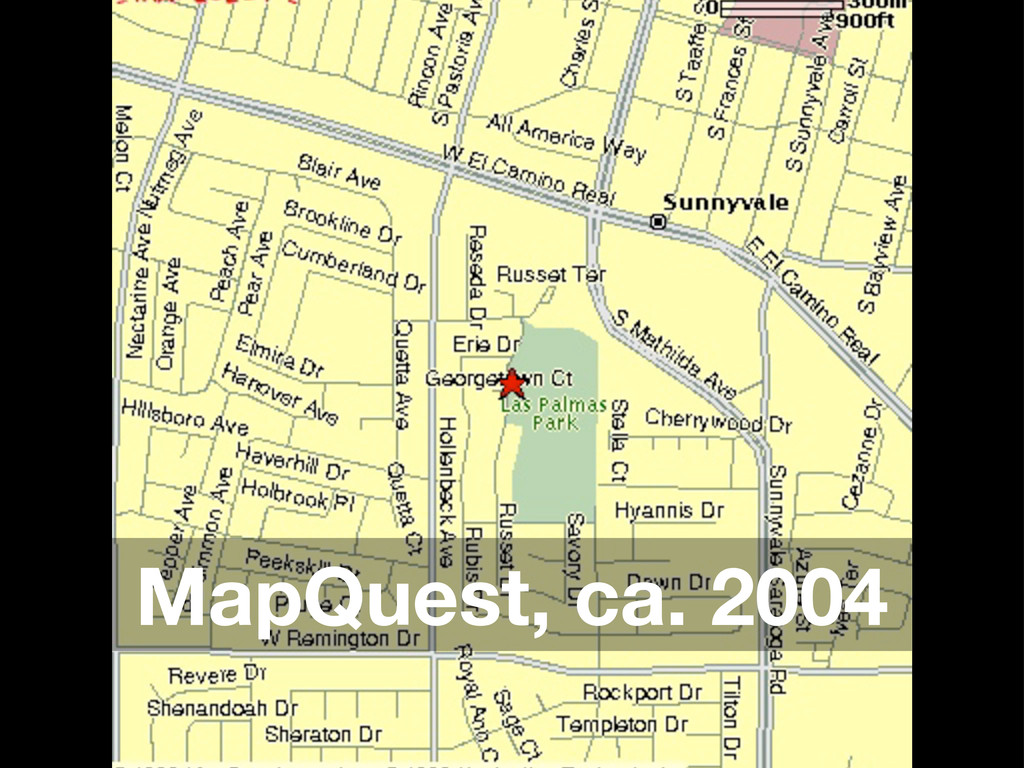
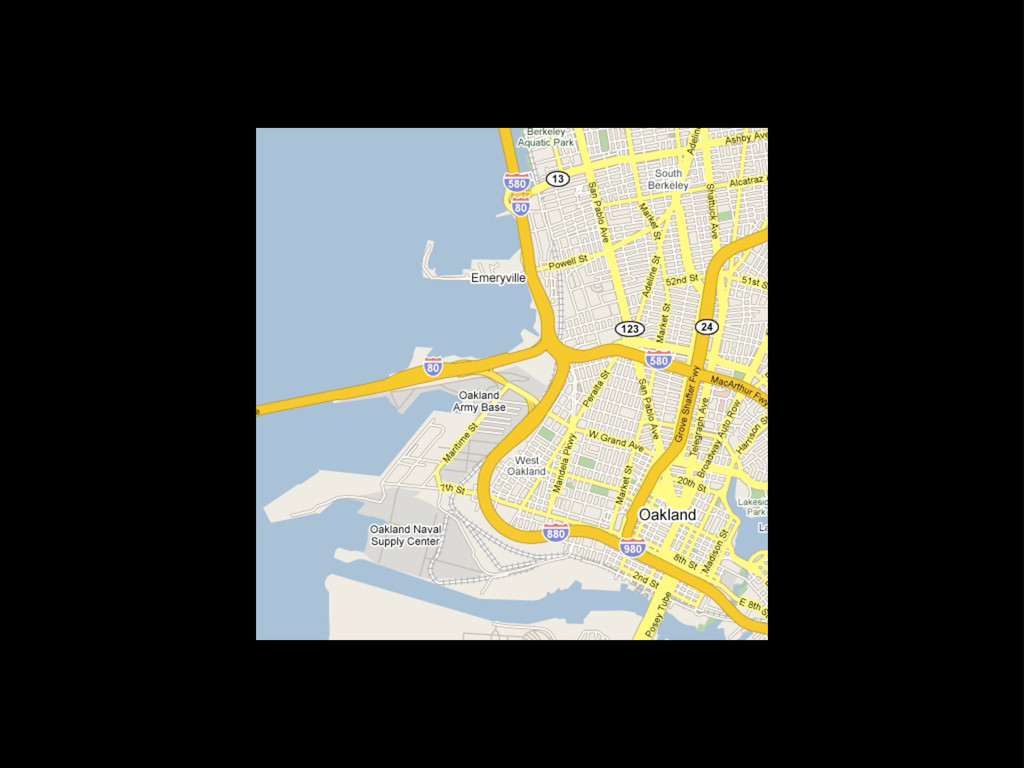
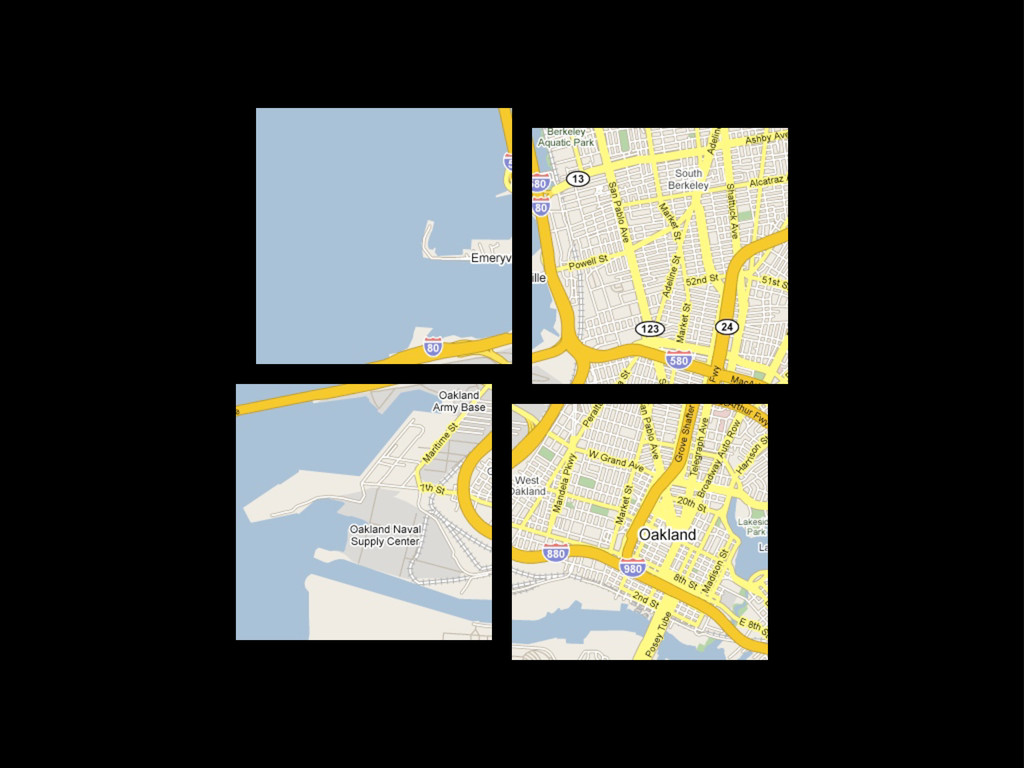
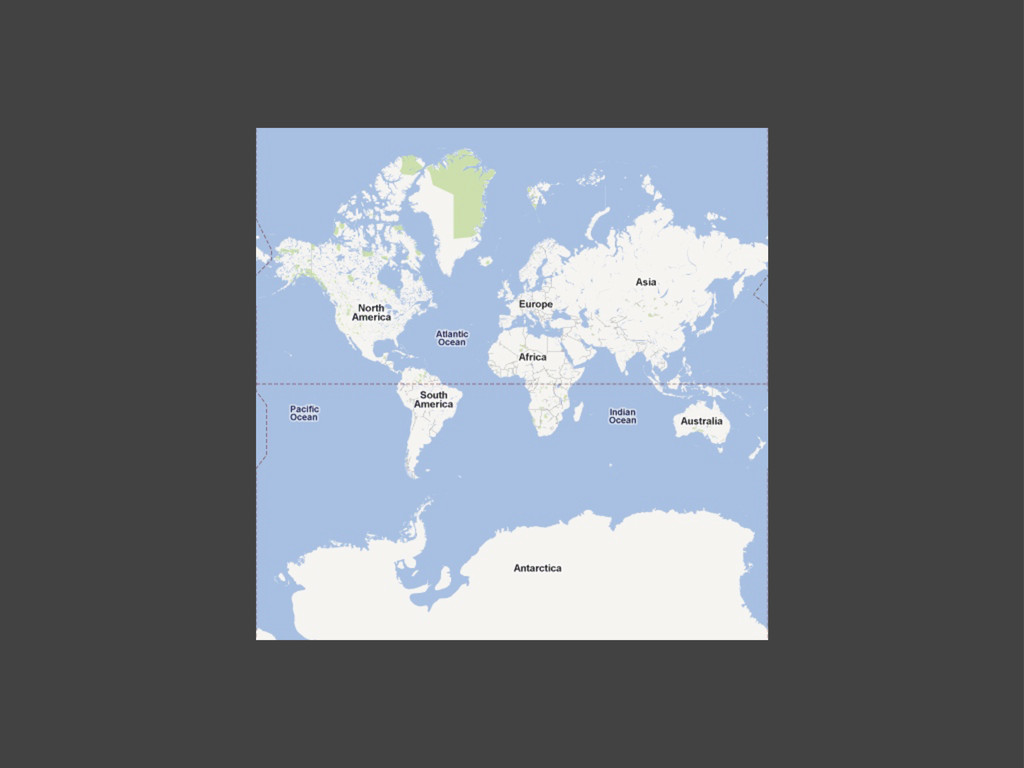
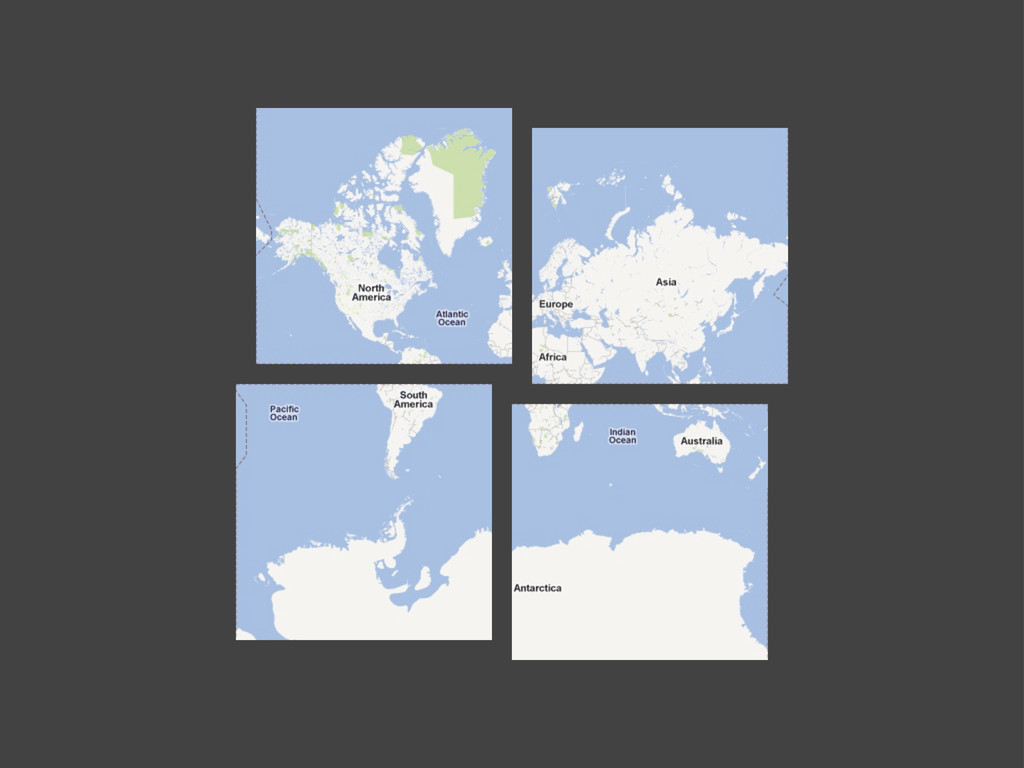
Tiles
MapQuest, ca. 2004
None
None
None
None
data
data style
data style images
data style images interaction
Days 2, 3, and 4
Where Data Comes From Finding, processing, cleaning, publishing point-based location
and address data
Custom Cartography Using OpenStreetMap and government data to develop your
own custom base maps
More Spatial Data Census tracts, heat maps, and aerial imagery
Time to follow along: http://sta.mn/633
1. Lists of Pins
2. Click Interaction
3. Placement on Map
4. Tiles
None
None
None
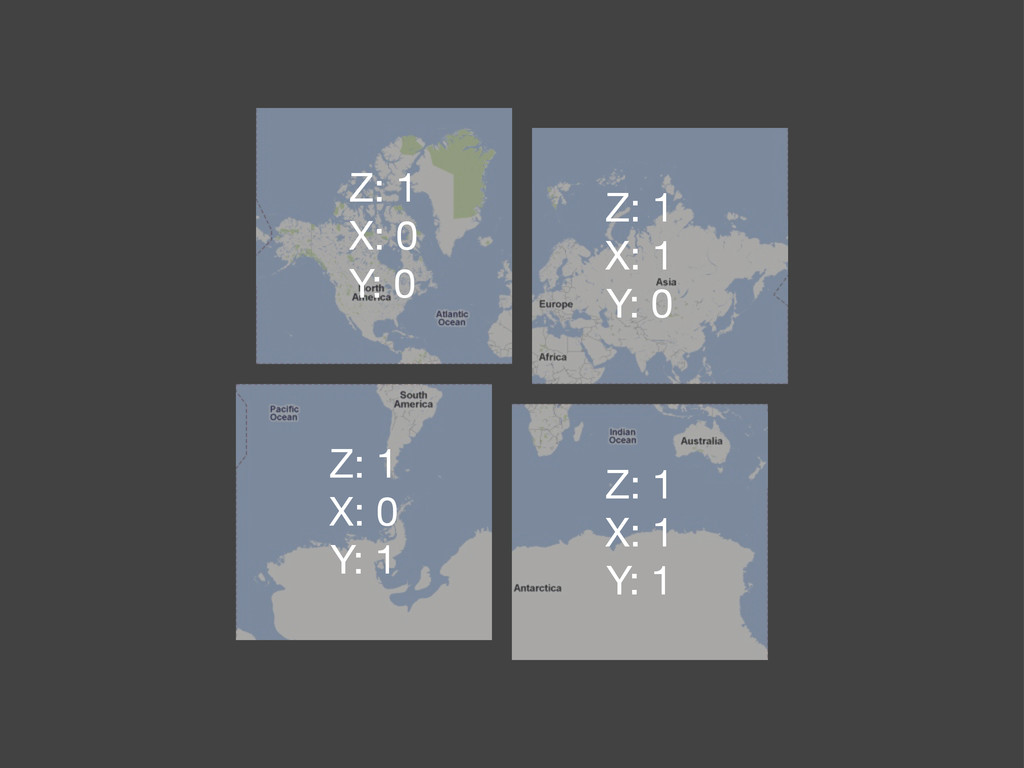
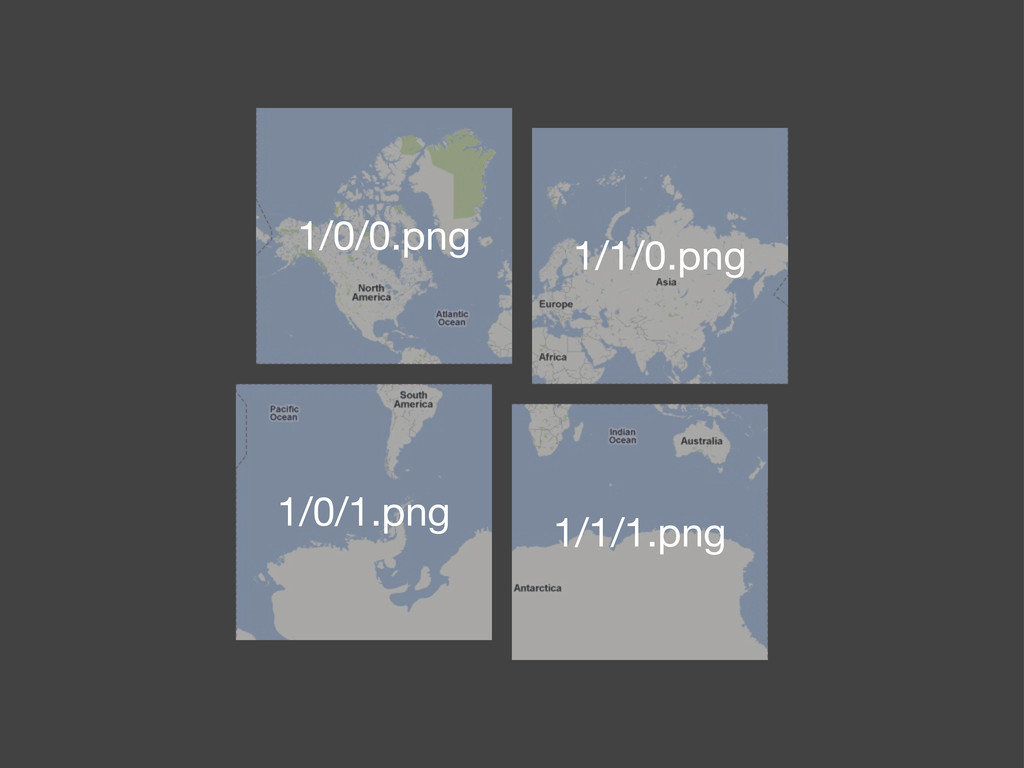
Z: 1 X: 0 Y: 0 Z: 1 X: 1
Y: 0 Z: 1 X: 1 Y: 1 Z: 1 X: 0 Y: 1
1/0/0.png 1/1/0.png 1/1/1.png 1/0/1.png
None
None
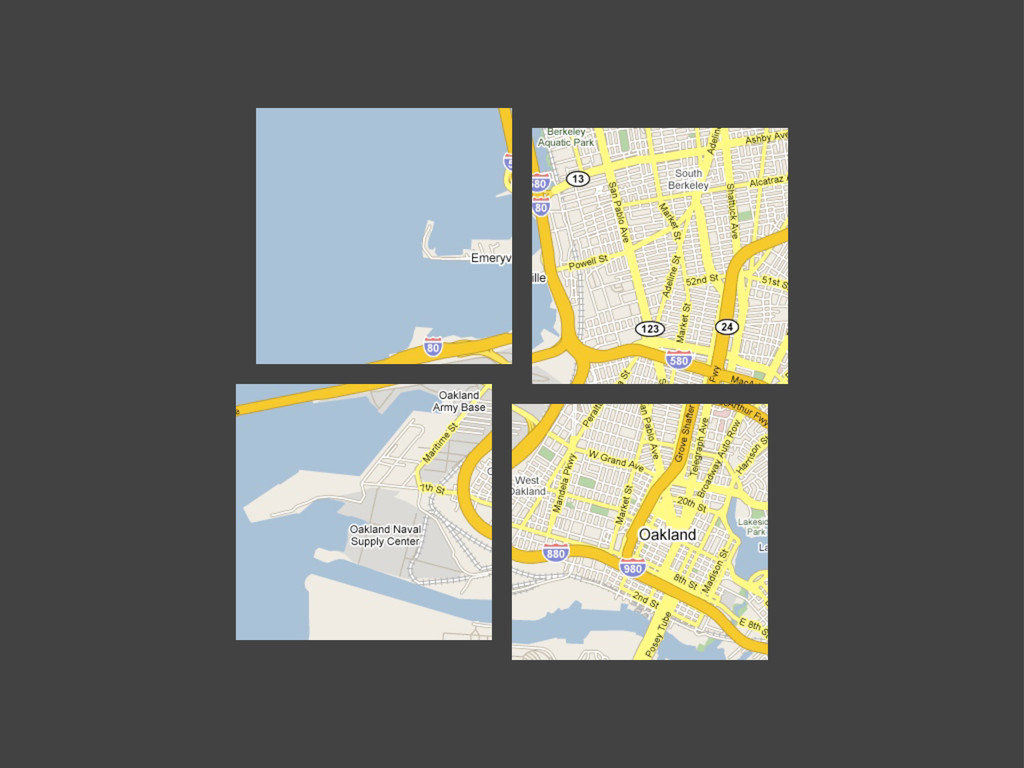
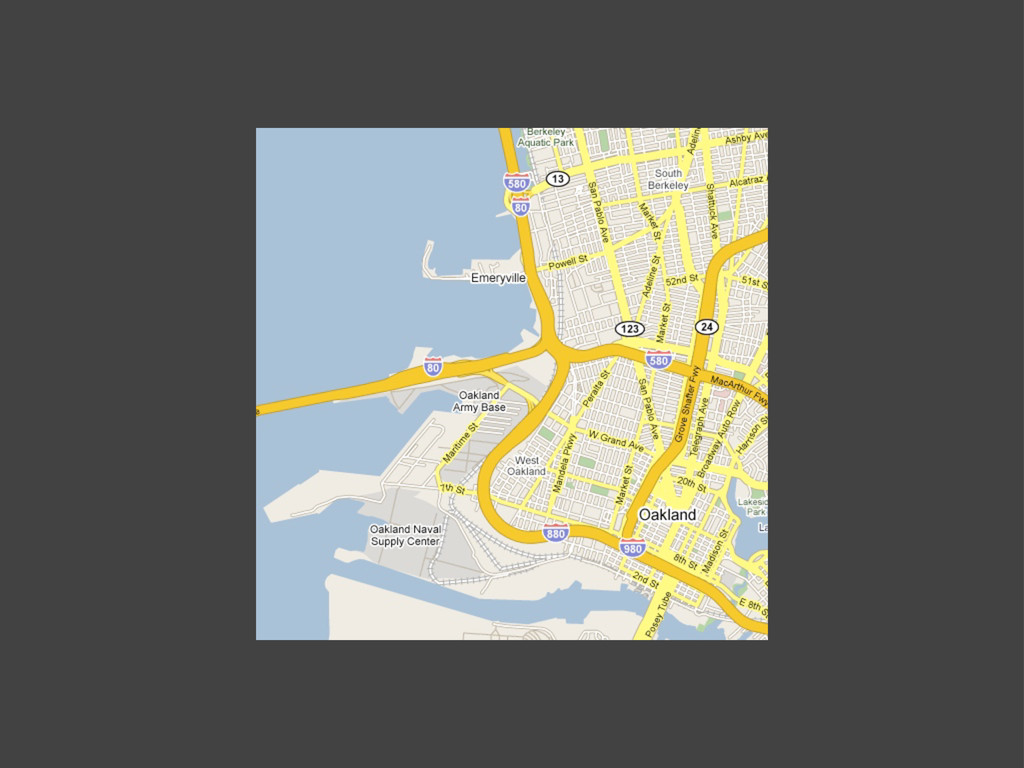
5. Simple Tile Grid
6. Panning a Map
7. First Slippy Map
8. Adding Map Pins
Fin.