Upgrade to Pro — share decks privately, control downloads, hide ads and more …

Confab 2019: What’s the “Scoop”?

Confab 2019: What’s the “Scoop”?

Building an editorial analytics dashboard with purpose.

Mike Petroff

April 15, 2019
Tweet

Other Decks in Education

Transcript

  1. Introductions Mike Petroff @mikepetroff Senior Product Manager Harvard Business Publishing

    Aaron Baker @helveticaman Associate Director of Content Strategy Harvard University
  2. Our mission Communicate and amplify Harvard’s mission of excellence in

    teaching, learning, and research while making the University and its contributions relatable and relevant in an always-on world.
  3. How can I keep up with all these requests for

    data? How did it do? Which stories should I share with alumni? Is this a good email open rate? Can you pull the numbers? How many readers do we have?
  4. Our (ideal) process 1. Create content that aligns to business

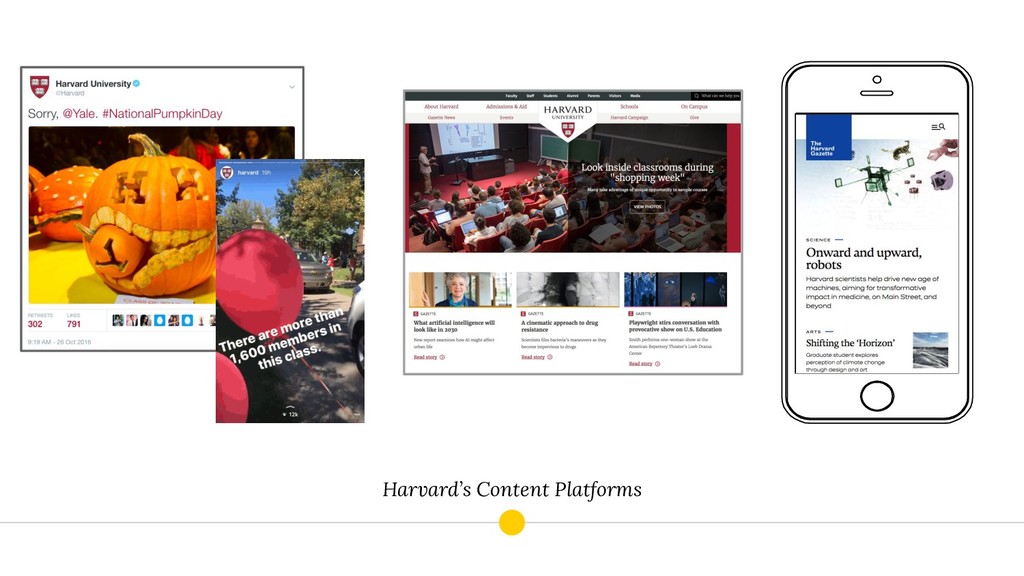
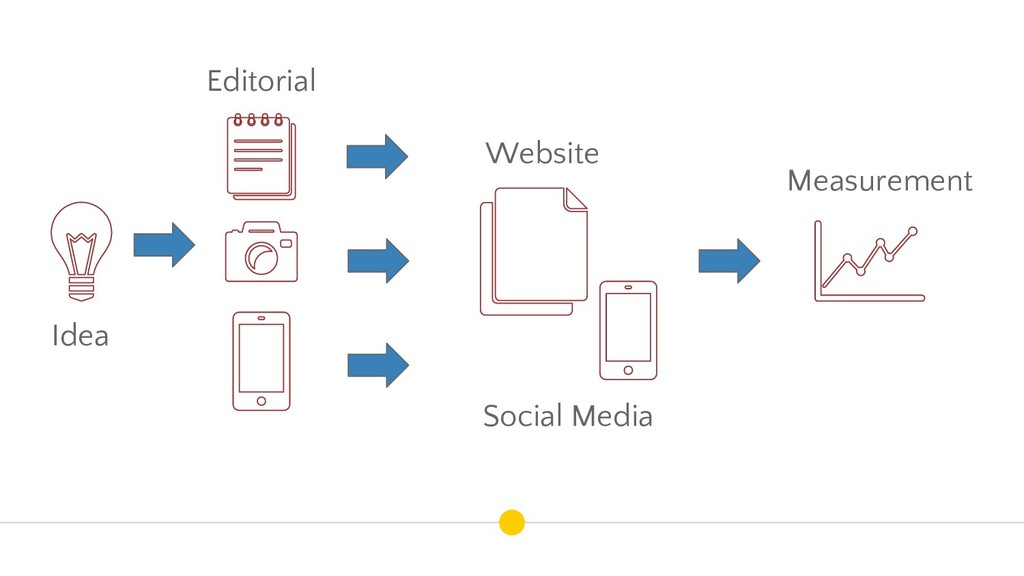
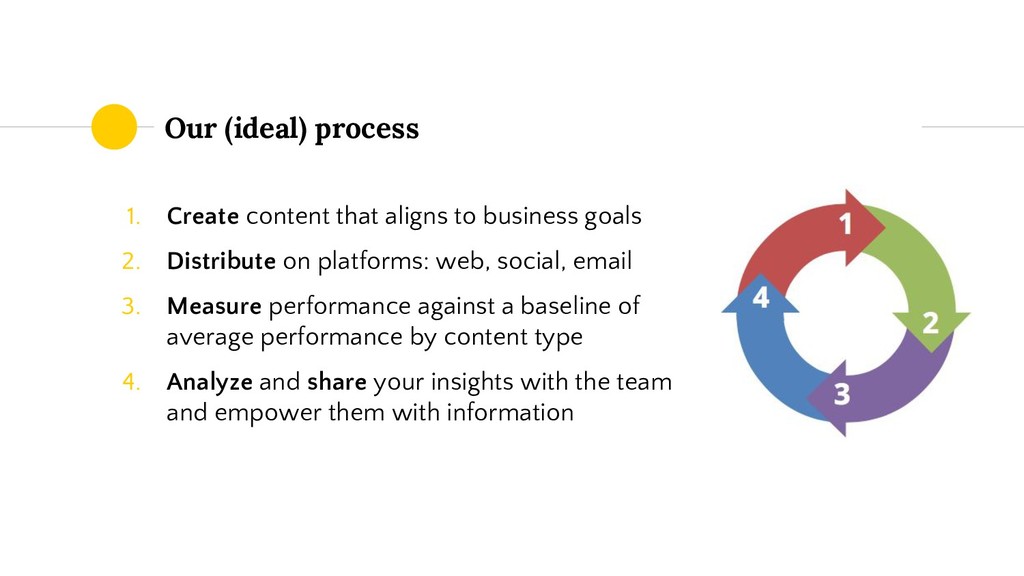
    goals 2. Distribute on platforms: web, social, email 3. Measure performance against a baseline of average performance by content type 4. Analyze and share your insights with the team and empower them with information
  5. We identified gaps in our analytics measurement and reporting capabilities.

    ➔ Benchmarking ➔ On-demand access ➔ Scaled reporting ➔ Shared vocabulary ?
  6. Measurement plan goals ◉ Translate institutional goals to measurable user

    action ◉ Ensure quality data capturing ◉ Establish baseline KPIs ◉ Speculate action plan based on results
  7. Turning goals into metrics Goals ❏ Visual storytelling ❏ Reader

    engagement ❏ Cross-platform content promotion Wishlist ➢ Element visibility ➢ Scroll depth ➢ Outbound link tracking
  8. “ For something to be considered innovation, it needs to

    be new, valuable, implemented, and adopted. 22 Sari Harrison Ideas are Easy, Sorting them is Hard
  9. Creating the roadmap for Scoop Value? > Measurement plan >

    Build prototype > User interviews > Collect feedback Implementation? > Gather resources > Build “MVP” > Collect feedback > Iterative improvement Adoption? > User onboarding > Increase awareness > Build reports > Measure usage
  10. How it works ◉ Server requests data via platform APIs

    ◉ Data is stored in a database ◉ Averages are calculated ◉ Results are published
  11. 7am request email stats every 15 minutes 1am request Facebook

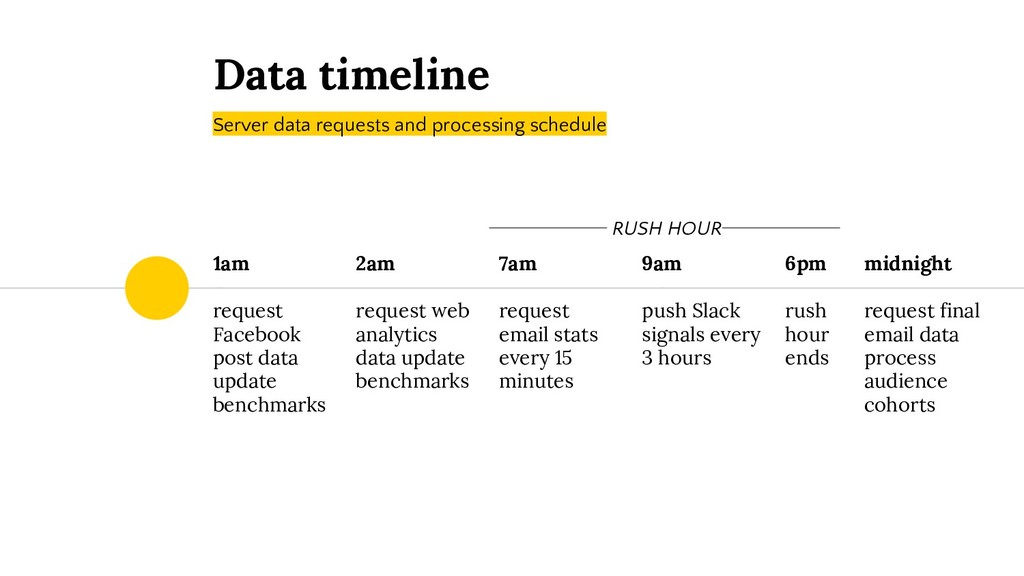
    post data update benchmarks Data timeline 2am request web analytics data update benchmarks 9am push Slack signals every 3 hours 6pm rush hour ends midnight request final email data process audience cohorts Server data requests and processing schedule RUSH HOUR
  12. Democratizing data “The goal is to have anybody use data

    at any time to make decisions with no barriers to access or understanding.” -Bernard Marr Source: What Is Data Democratization?, Forbes
  13. Email reports from Scoop ◉ Daily Gazette email performance ◉

    Introduced and reinforced benchmark visuals and shared vocabulary
  14. Email reports from Scoop ◉ Weekly content performance ◉ Narrative

    explanations and insights ◉ Provided links to Scoop dashboard for more analysis
  15. Signals and Scoop Slackbot “I just want Scoop to tell

    me what’s important and when I should pay attention.”
  16. Credit: Graziella Jackson, Echo&Co Based on an assumed 1,782 working

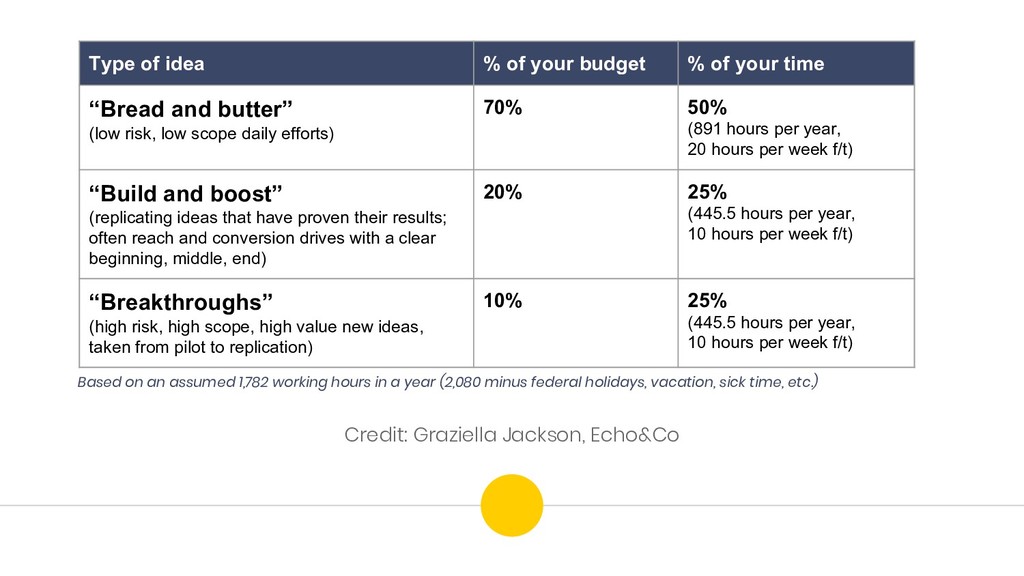
    hours in a year (2,080 minus federal holidays, vacation, sick time, etc.) Type of idea % of your budget % of your time “Bread and butter” (low risk, low scope daily efforts) 70% 50% (891 hours per year, 20 hours per week f/t) “Build and boost” (replicating ideas that have proven their results; often reach and conversion drives with a clear beginning, middle, end) 20% 25% (445.5 hours per year, 10 hours per week f/t) “Breakthroughs” (high risk, high scope, high value new ideas, taken from pilot to replication) 10% 25% (445.5 hours per year, 10 hours per week f/t)