an investigative process of problem-solving and decision making. Students should not leave their introductory statistics course with the mistaken impression that statistics consists of an unrelated collection of formulas and methods. Rather, students should understand that statistics is a problem-solving and decision making process that is fundamental to scientific inquiry and essential for making sound decisions. ‣ Give students experience with multivariable thinking. We live in a complex world in which the answer to a question often depends on many factors. Students will encounter such situations within their own fields of study and everyday lives. We must prepare our students to answer challenging questions that require them to investigate and explore relationships among many variables. Doing so will help them to appreciate the value of statistical thinking and methods. 2. Focus on conceptual understanding. 3. Integrate real data with a context and purpose. 4. Foster active learning. 5. Use technology to explore concepts and analyse data. 6. Use assessments to improve and evaluate student learning. amstat.org/asa/files/pdfs/GAISE/GaiseCollege_Full.pdf bit.ly/art-sci-dlnc
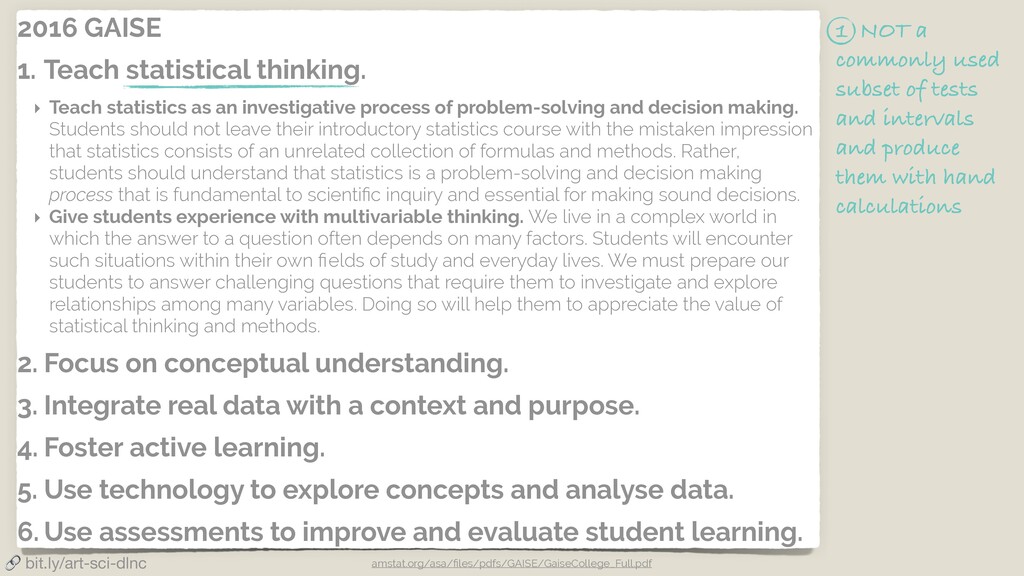
an investigative process of problem-solving and decision making. Students should not leave their introductory statistics course with the mistaken impression that statistics consists of an unrelated collection of formulas and methods. Rather, students should understand that statistics is a problem-solving and decision making process that is fundamental to scientific inquiry and essential for making sound decisions. ‣ Give students experience with multivariable thinking. We live in a complex world in which the answer to a question often depends on many factors. Students will encounter such situations within their own fields of study and everyday lives. We must prepare our students to answer challenging questions that require them to investigate and explore relationships among many variables. Doing so will help them to appreciate the value of statistical thinking and methods. 2. Focus on conceptual understanding. 3. Integrate real data with a context and purpose. 4. Foster active learning. 5. Use technology to explore concepts and analyse data. 6. Use assessments to improve and evaluate student learning. 1 NOT a commonly used subset of tests and intervals and produce them with hand calculations amstat.org/asa/files/pdfs/GAISE/GaiseCollege_Full.pdf bit.ly/art-sci-dlnc
an investigative process of problem-solving and decision making. Students should not leave their introductory statistics course with the mistaken impression that statistics consists of an unrelated collection of formulas and methods. Rather, students should understand that statistics is a problem-solving and decision making process that is fundamental to scientific inquiry and essential for making sound decisions. ‣ Give students experience with multivariable thinking. We live in a complex world in which the answer to a question often depends on many factors. Students will encounter such situations within their own fields of study and everyday lives. We must prepare our students to answer challenging questions that require them to investigate and explore relationships among many variables. Doing so will help them to appreciate the value of statistical thinking and methods. 2. Focus on conceptual understanding. 3. Integrate real data with a context and purpose. 4. Foster active learning. 5. Use technology to explore concepts and analyse data. 6. Use assessments to improve and evaluate student learning. 2 Multivariate analysis requires the use of computing amstat.org/asa/files/pdfs/GAISE/GaiseCollege_Full.pdf bit.ly/art-sci-dlnc
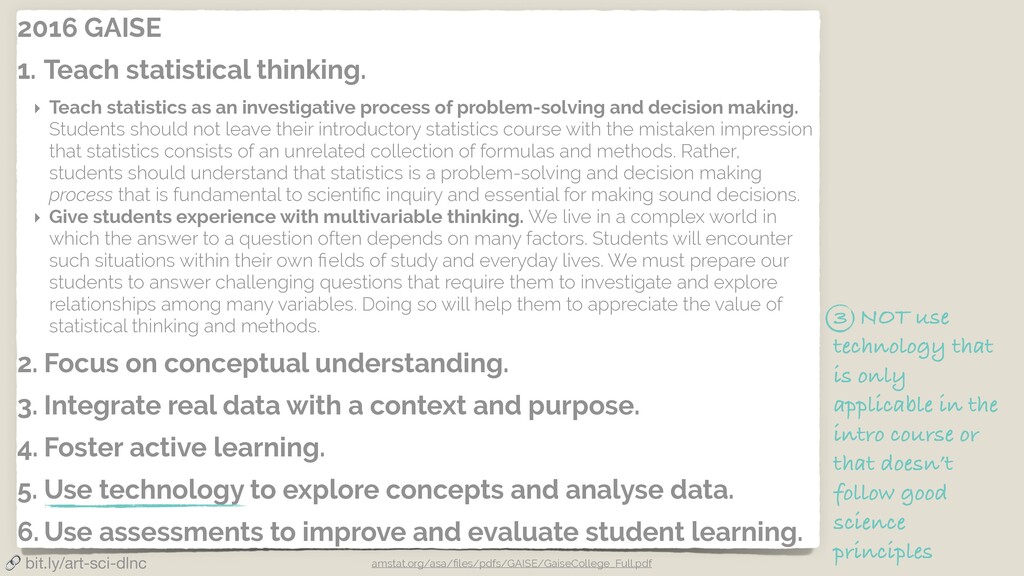
an investigative process of problem-solving and decision making. Students should not leave their introductory statistics course with the mistaken impression that statistics consists of an unrelated collection of formulas and methods. Rather, students should understand that statistics is a problem-solving and decision making process that is fundamental to scientific inquiry and essential for making sound decisions. ‣ Give students experience with multivariable thinking. We live in a complex world in which the answer to a question often depends on many factors. Students will encounter such situations within their own fields of study and everyday lives. We must prepare our students to answer challenging questions that require them to investigate and explore relationships among many variables. Doing so will help them to appreciate the value of statistical thinking and methods. 2. Focus on conceptual understanding. 3. Integrate real data with a context and purpose. 4. Foster active learning. 5. Use technology to explore concepts and analyse data. 6. Use assessments to improve and evaluate student learning. 3 NOT use technology that is only applicable in the intro course or that doesn’t follow good science principles amstat.org/asa/files/pdfs/GAISE/GaiseCollege_Full.pdf bit.ly/art-sci-dlnc
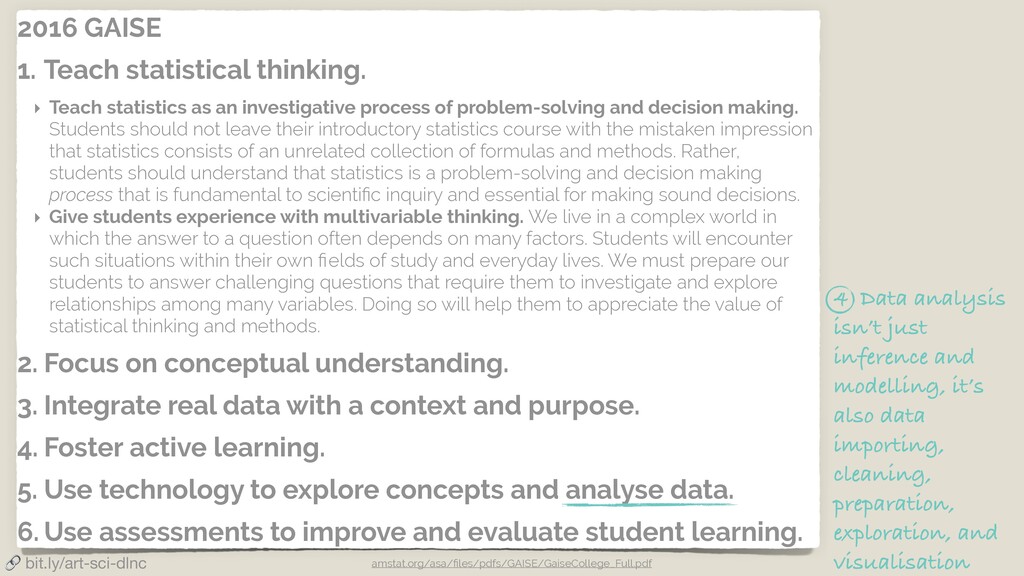
an investigative process of problem-solving and decision making. Students should not leave their introductory statistics course with the mistaken impression that statistics consists of an unrelated collection of formulas and methods. Rather, students should understand that statistics is a problem-solving and decision making process that is fundamental to scientific inquiry and essential for making sound decisions. ‣ Give students experience with multivariable thinking. We live in a complex world in which the answer to a question often depends on many factors. Students will encounter such situations within their own fields of study and everyday lives. We must prepare our students to answer challenging questions that require them to investigate and explore relationships among many variables. Doing so will help them to appreciate the value of statistical thinking and methods. 2. Focus on conceptual understanding. 3. Integrate real data with a context and purpose. 4. Foster active learning. 5. Use technology to explore concepts and analyse data. 6. Use assessments to improve and evaluate student learning. 4 Data analysis isn’t just inference and modelling, it’s also data importing, cleaning, preparation, exploration, and visualisation amstat.org/asa/files/pdfs/GAISE/GaiseCollege_Full.pdf bit.ly/art-sci-dlnc
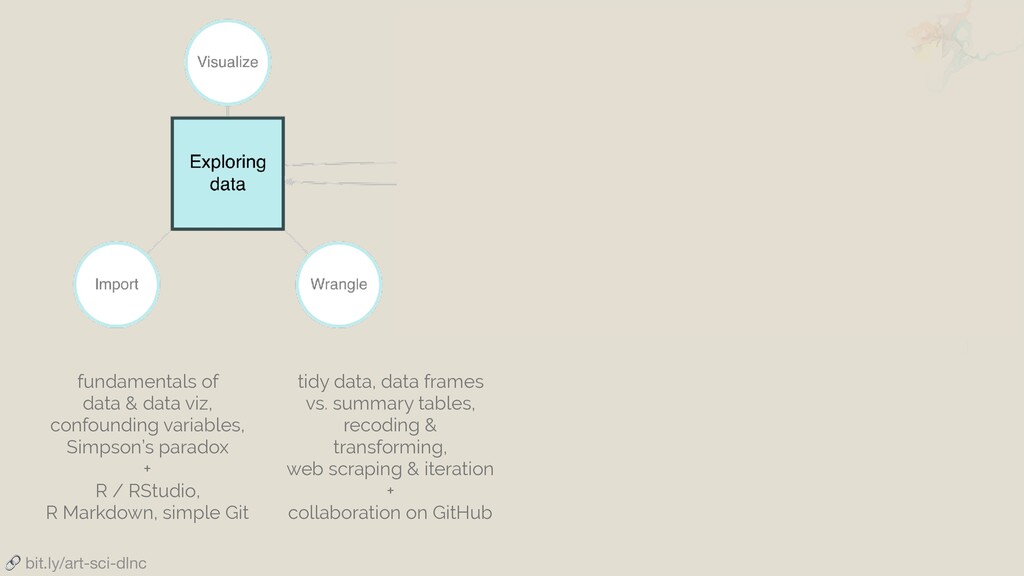
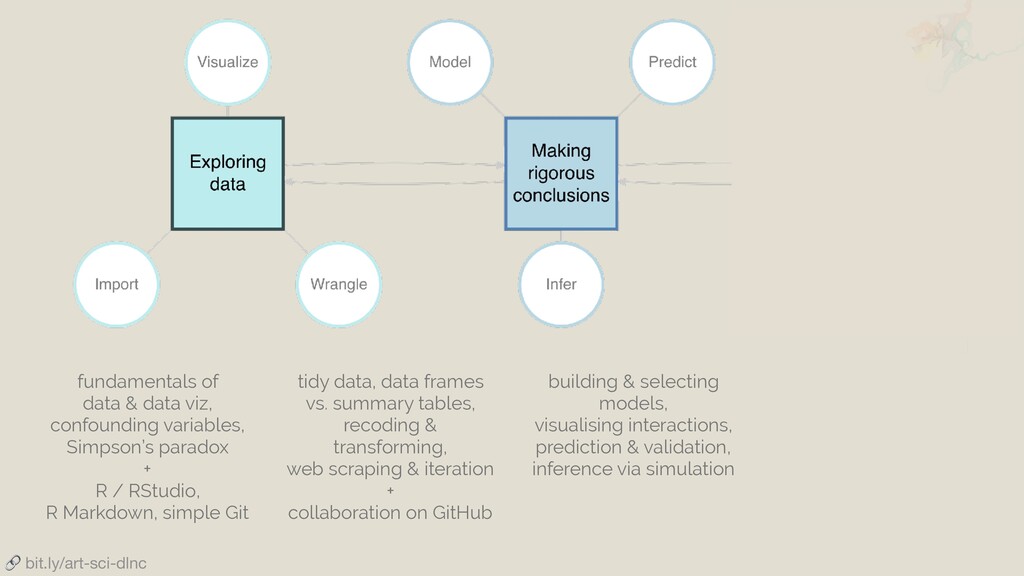
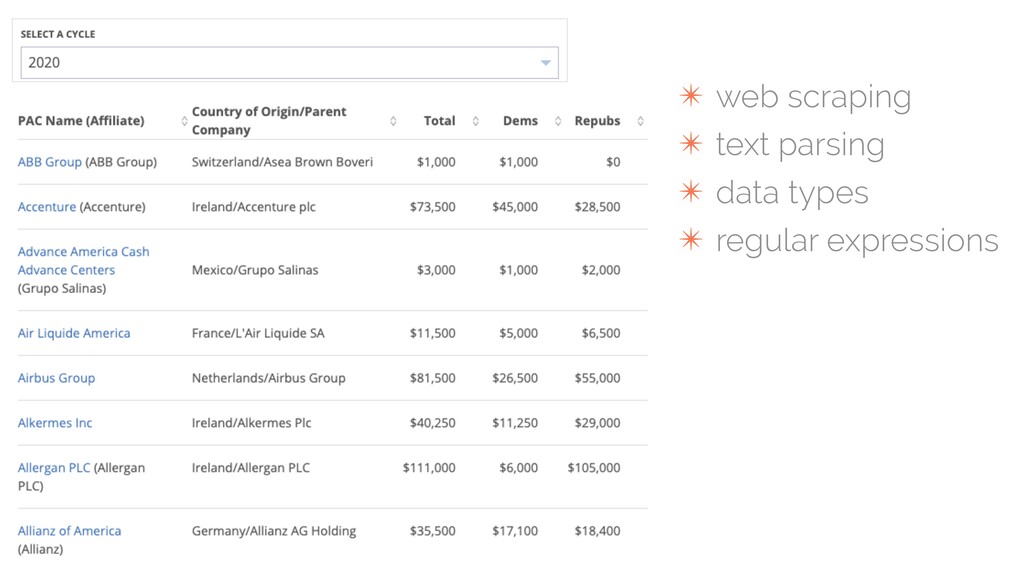
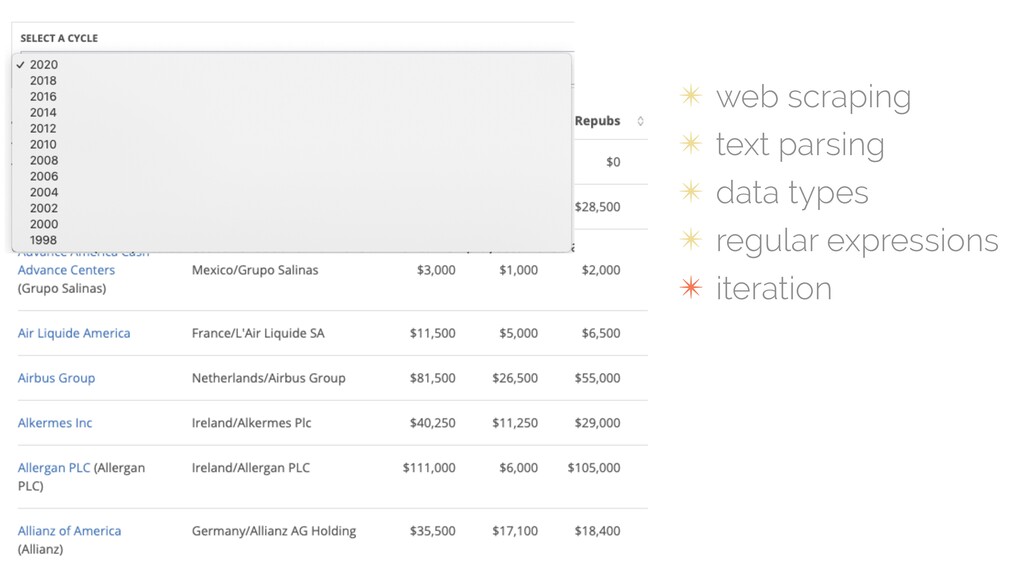
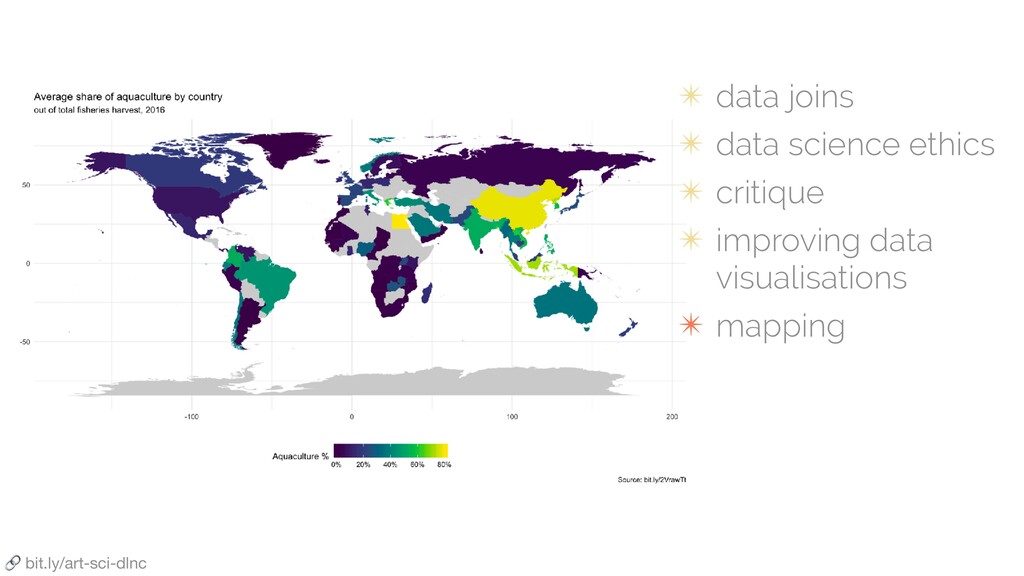
+ R / RStudio, R Markdown, simple Git tidy data, data frames vs. summary tables, recoding & transforming, web scraping & iteration + collaboration on GitHub bit.ly/art-sci-dlnc
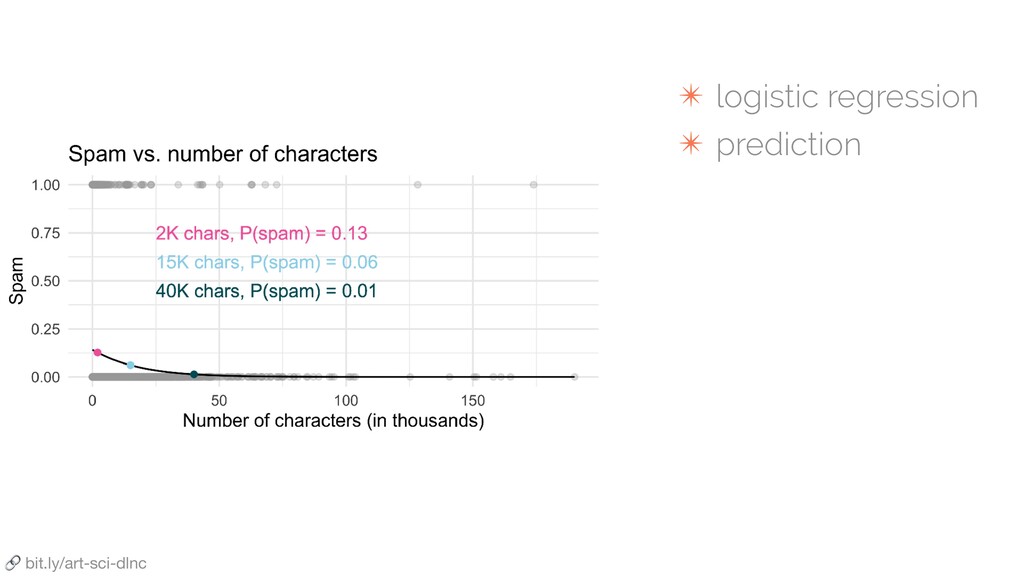
+ R / RStudio, R Markdown, simple Git tidy data, data frames vs. summary tables, recoding & transforming, web scraping & iteration + collaboration on GitHub building & selecting models, visualising interactions, prediction & validation, inference via simulation bit.ly/art-sci-dlnc
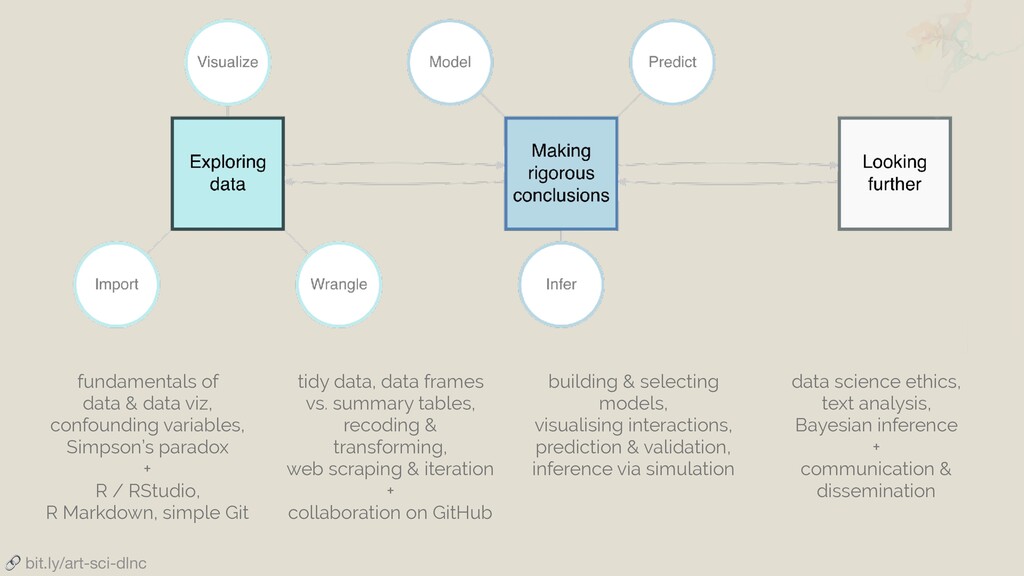
+ R / RStudio, R Markdown, simple Git tidy data, data frames vs. summary tables, recoding & transforming, web scraping & iteration + collaboration on GitHub building & selecting models, visualising interactions, prediction & validation, inference via simulation data science ethics, text analysis, Bayesian inference + communication & dissemination bit.ly/art-sci-dlnc
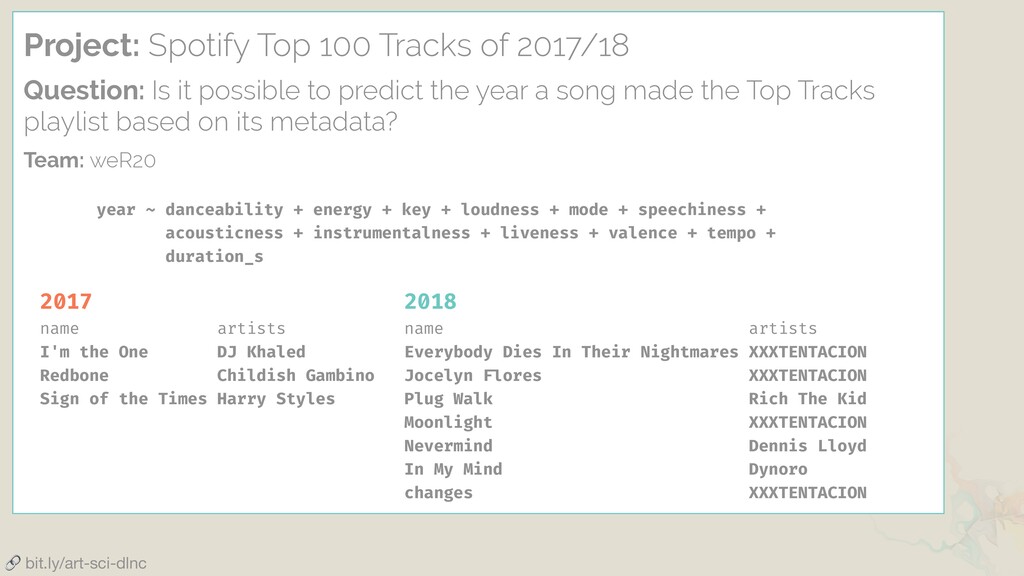
possible to predict the year a song made the Top Tracks playlist based on its metadata? Team: weR20 year ~ danceability + energy + key + loudness + mode + speechiness + acousticness + instrumentalness + liveness + valence + tempo + duration_s 2017 name artists I'm the One DJ Khaled Redbone Childish Gambino Sign of the Times Harry Styles 2018 name artists Everybody Dies In Their Nightmares XXXTENTACION Jocelyn Flores XXXTENTACION Plug Walk Rich The Kid Moonlight XXXTENTACION Nevermind Dennis Lloyd In My Mind Dynoro changes XXXTENTACION bit.ly/art-sci-dlnc
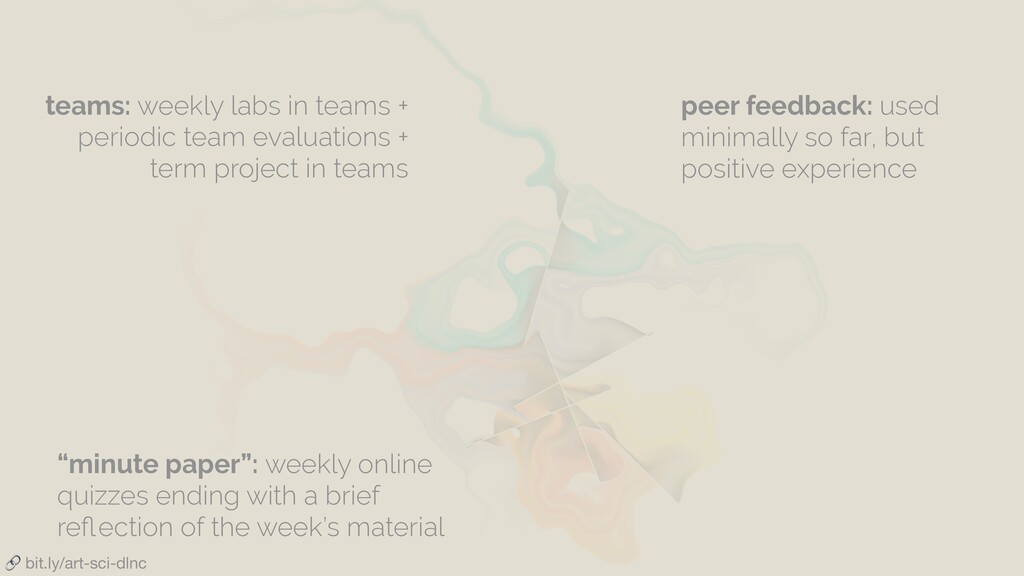
term project in teams peer feedback: used minimally so far, but positive experience “minute paper”: weekly online quizzes ending with a brief reflection of the week’s material bit.ly/art-sci-dlnc
term project in teams peer feedback: used minimally so far, but positive experience “minute paper”: weekly online quizzes ending with a brief reflection of the week’s material creativity: assignments that make room for creativity bit.ly/art-sci-dlnc
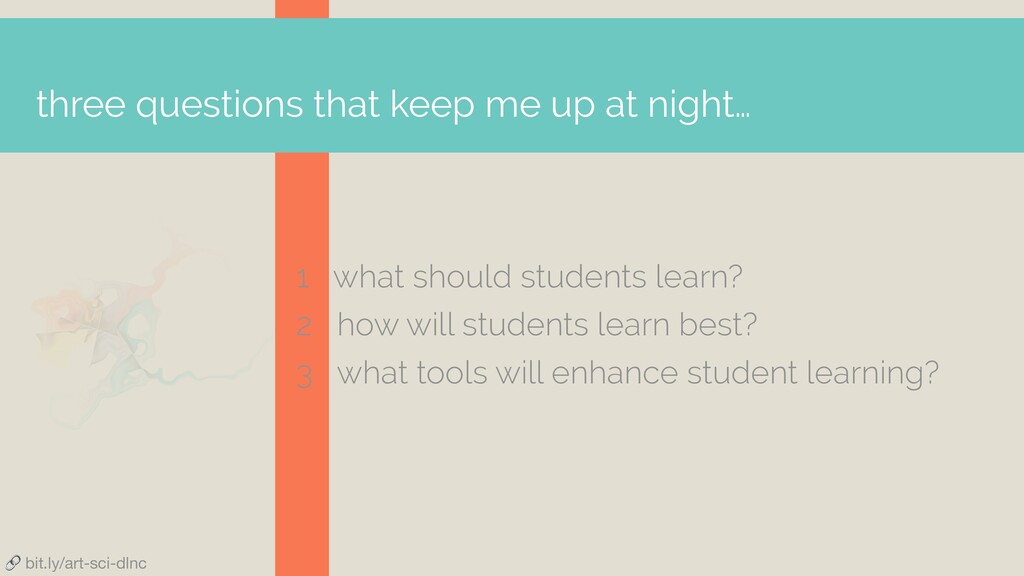
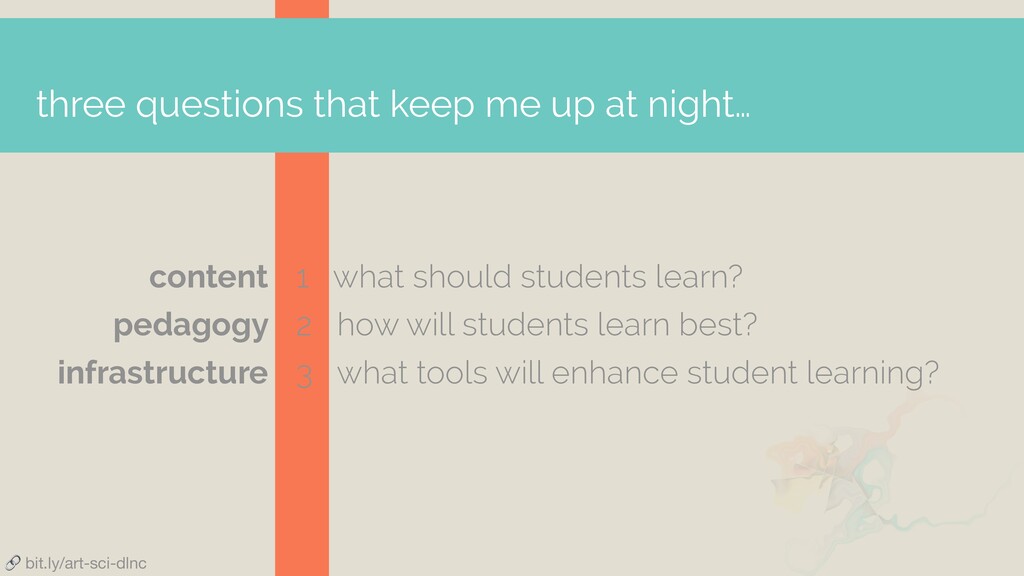
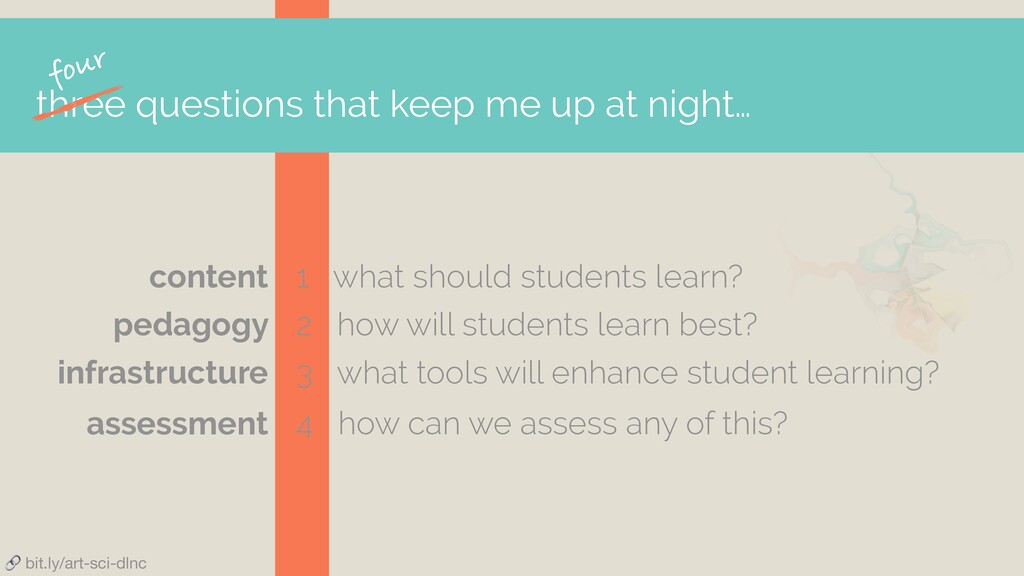
should students learn? 2 how will students learn best? 3 what tools will enhance student learning? content pedagogy infrastructure four 4 how can we assess any of this? assessment bit.ly/art-sci-dlnc
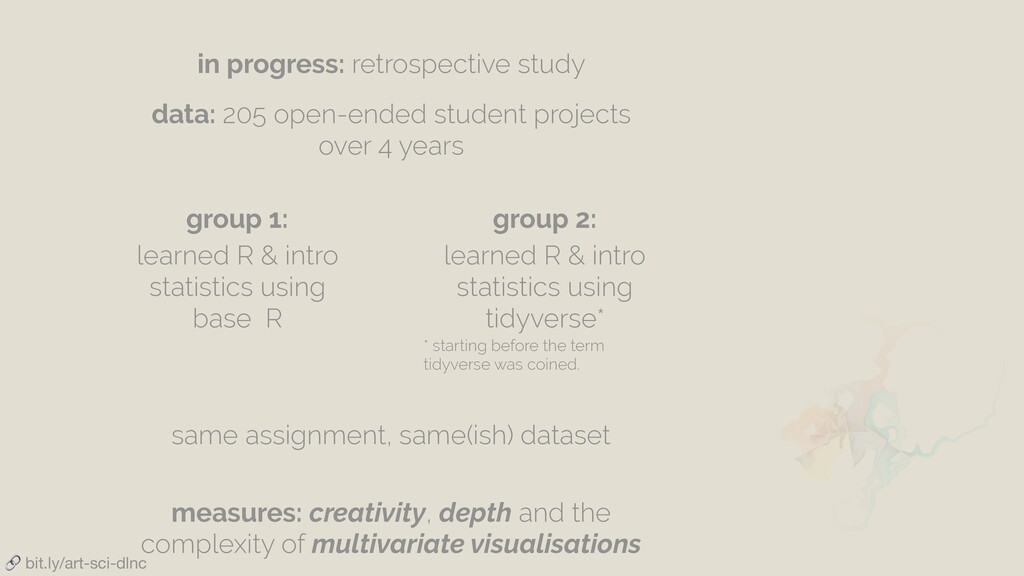
learned R & intro statistics using base R group 2: learned R & intro statistics using tidyverse* * starting before the term tidyverse was coined. same assignment, same(ish) dataset measures: creativity, depth and the complexity of multivariate visualisations in progress: retrospective study bit.ly/art-sci-dlnc
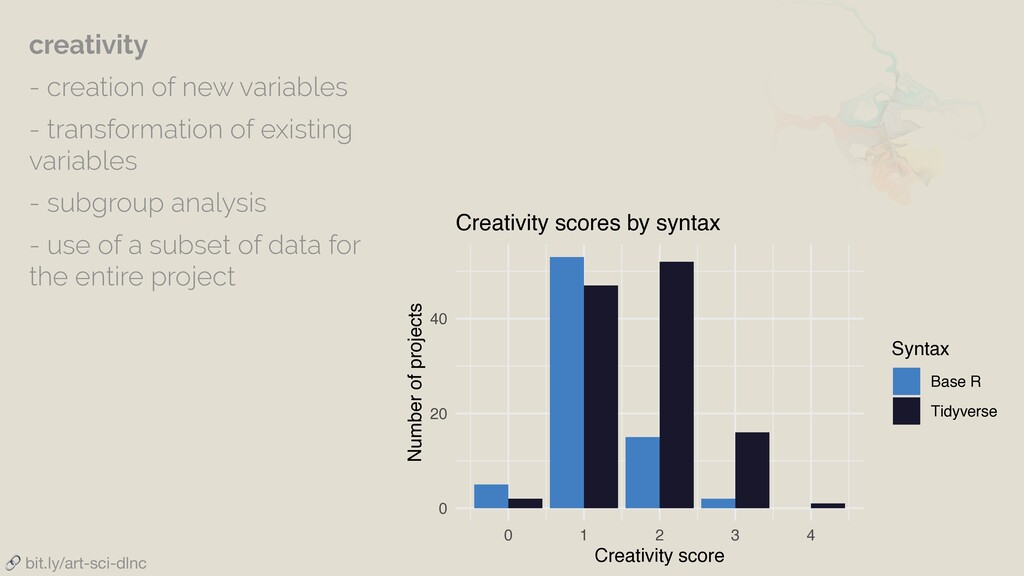
Number of projects Syntax Base R Tidyverse Creativity scores by syntax creativity - creation of new variables - transformation of existing variables - subgroup analysis - use of a subset of data for the entire project bit.ly/art-sci-dlnc
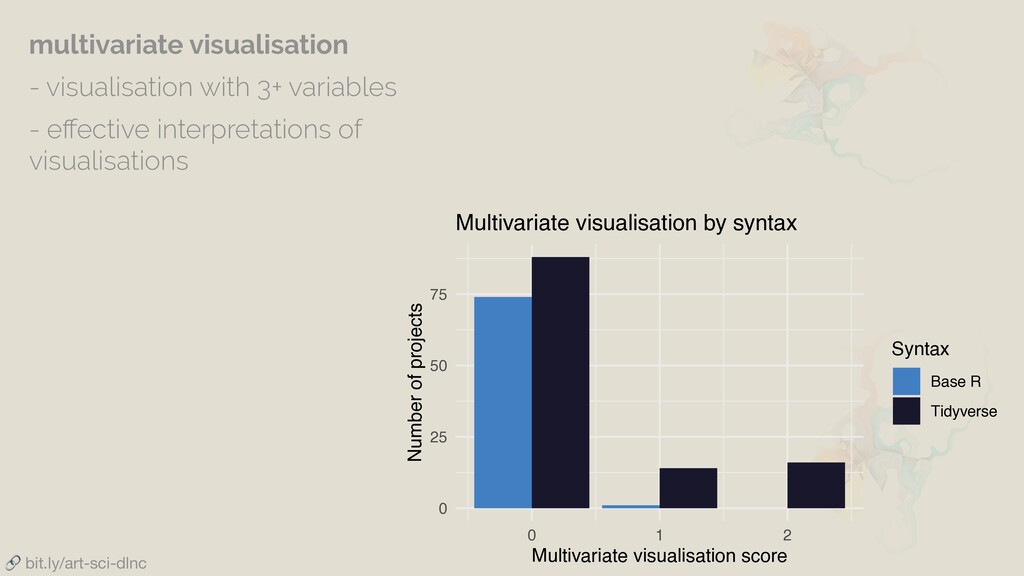
Number of projects Syntax Base R Tidyverse Multivariate visualisation by syntax multivariate visualisation - visualisation with 3+ variables - effective interpretations of visualisations bit.ly/art-sci-dlnc
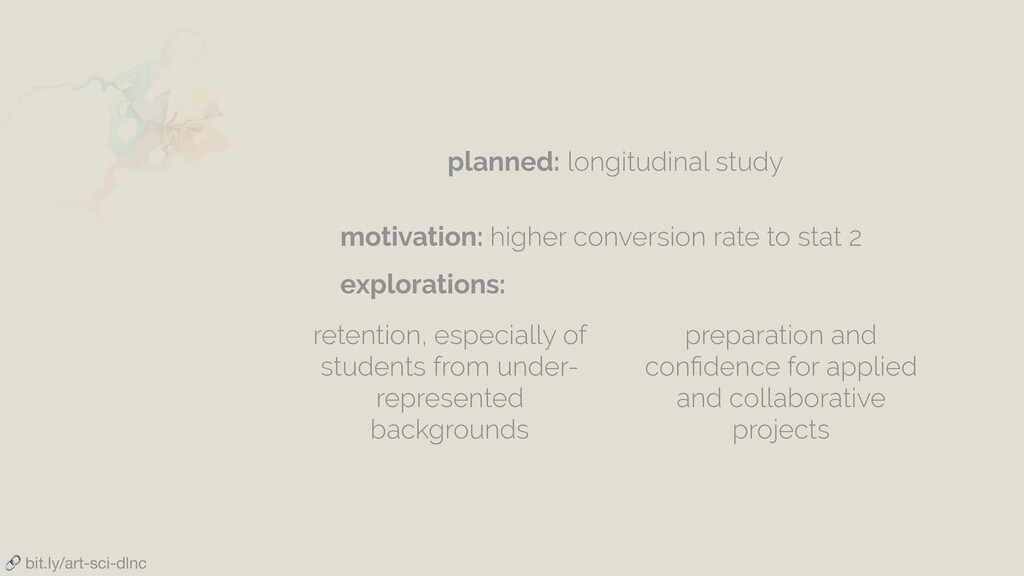
explorations: retention, especially of students from under- represented backgrounds preparation and confidence for applied and collaborative projects bit.ly/art-sci-dlnc