Upgrade to Pro — share decks privately, control downloads, hide ads and more …

The results in Table 1 don’t seem to correspond to those in Figure 2 (Pydata)

The results in Table 1 don’t seem to correspond to those in Figure 2 (Pydata)

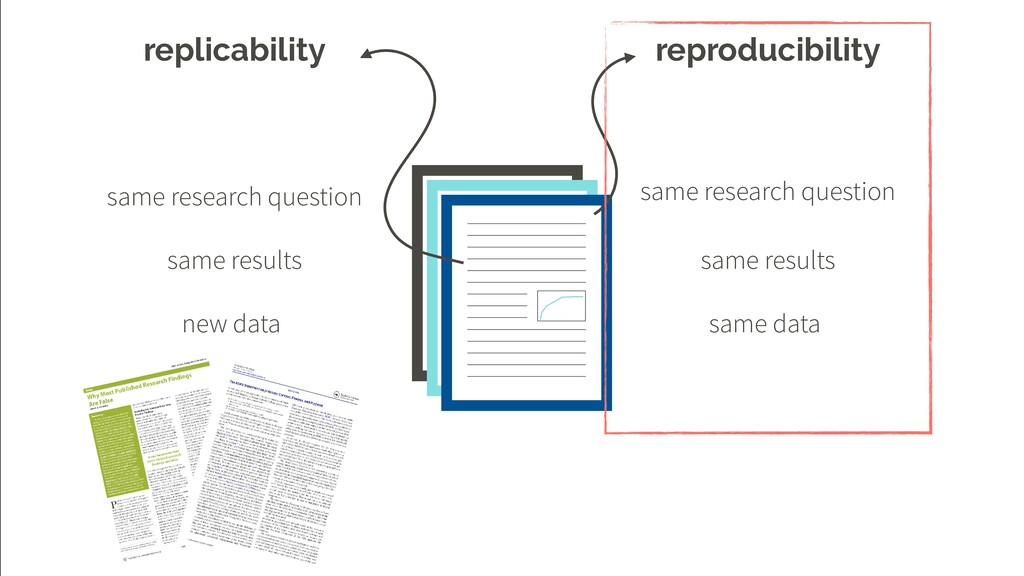
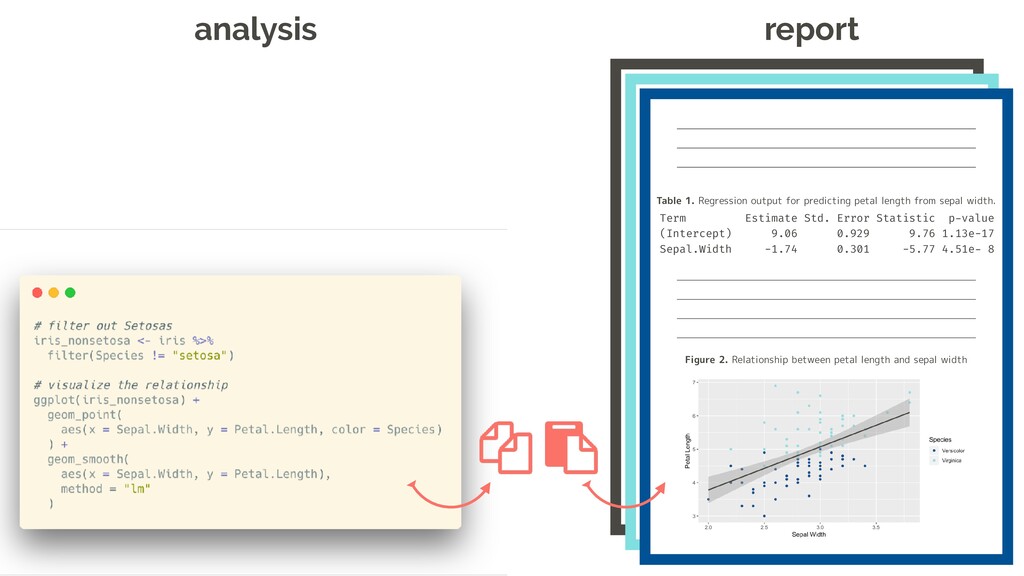
For data analysis to be reproducible, the data and code should be assembled in a way such that results (e.g. tables and figures) can be re-created. While the scientific community is by and large in agreement that reproducibility is a minimal standard by which data analyses should be evaluated, and a myriad of software tools for reproducible computing exist, it is still not trivial to reproduce someone's (sometimes your own!) results without fiddling with unavailable analysis data, external dependencies, missing packages, out of date software, etc. In this talk, we present good, better, and best workflows for reproducibility that touch on everything from data storage, cleaning, analysis, to communication of final results.

Mine Cetinkaya-Rundel

May 06, 2020
Tweet

More Decks by Mine Cetinkaya-Rundel

Other Decks in Technology

Transcript

  1. The results in Table 1 don’t seem to correspond to

    those in Figure 2 Mine Çetinkaya-Rundel University of Edinburgh + Duke University + RStudio mine-cetinkaya-rundel [email protected] @minebocek bit.ly/tab1-fig2-pydata
  2. 70 have tried and failed to reproduce another scientist's experiments

    more than percent Baker, Monya. "1,500 scientists lift the lid on reproducibility." Nature News 533.7604 (2016): 452.
  3. 50 have tried and failed to reproduce their own experiments

    more than percent Baker, Monya. "1,500 scientists lift the lid on reproducibility." Nature News 533.7604 (2016): 452.
  4. 379 Google Scholar Search, May 5, 2020. results containing the

    term reproducibility crisis just in 2020 Google Scholar yields
  5. Term Estimate Std. Error Statistic p-value (Intercept) 9.06 0.929 9.76

    1.13e-17 Sepal.Width -1.74 0.301 -5.77 4.51e- 8 Table 1. Regression output for predicting petal length from sepal width. Figure 2. Relationship between petal length and sepal width e.g.
  6. Term Estimate Std. Error Statistic p-value (Intercept) 9.06 0.929 9.76

    1.13e-17 Sepal.Width -1.74 0.301 -5.77 4.51e- 8 Table 1. Regression output for predicting petal length from sepal width. Figure 2. Relationship between petal length and sepal width e.g.
  7. analysis report Term Estimate Std. Error Statistic p-value (Intercept) 9.06

    0.929 9.76 1.13e-17 Sepal.Width -1.74 0.301 -5.77 4.51e- 8 Table 1. Regression output for predicting petal length from sepal width.
  8. analysis report Term Estimate Std. Error Statistic p-value (Intercept) 9.06

    0.929 9.76 1.13e-17 Sepal.Width -1.74 0.301 -5.77 4.51e- 8 Table 1. Regression output for predicting petal length from sepal width. Figure 2. Relationship between petal length and sepal width
  9. analysis report Term Estimate Std. Error Statistic p-value (Intercept) 9.06

    0.929 9.76 1.13e-17 Sepal.Width -1.74 0.301 -5.77 4.51e- 8 Table 1. Regression output for predicting petal length from sepal width. Figure 2. Relationship between petal length and sepal width
  10. Term Estimate Std. Error Statistic p-value (Intercept) 9.06 0.929 9.76

    1.13e-17 Sepal.Width -1.74 0.301 -5.77 4.51e- 8 Table 1. Regression output for predicting petal length from sepal width. Figure 2. Relationship between petal length and sepal width
  11. raw data code & documentation to reproduce the analysis specifications

    of your computational environment make available and accessible Peng, Roger. "The reproducibility crisis in science: A statistical counterattack." Significance 12.3 (2015): 30-32. Gentleman, Robert, and Duncan Temple Lang. "Statistical analyses and reproducible research." Journal of Computational and Graphical Statistics 16.1 (2007): 1-23.
  12. – Keith Baggerly “The most important tool is the mindset,

    when starting, that the end product will be reproducible.”
  13. nobody, not even yourself, can recreate any part of your

    analysis push button reproducibility in published work
  14. “There’s no one-size-fits-all solution for computational reproducibility.” Perkel, Jeffrey M.

    "A toolkit for data transparency takes shape." Nature 560 (2018): 513-515.
  15. simpler analysis raw-data processed-data manuscript |- manuscript.Rmd more complex analysis

    raw-data processed-data scripts manuscript figures |- manuscript.Rmd stick with the conventions of your peers
  16. raw-data processed-data scripts manuscript figures |- README.md |- airports.csv |-

    flights.csv |- planes.csv |- weather.csv # README This folder contains the raw data for the project. All datasets were downloaded from open flights.org/data.html on 2019-04-01. -airlines: Airline names -airports: Airports metadata - flights: Flight data -planes: Plane metadata -weather: Hourly weather data |- airlines.csv
  17. Student Exam Grade Name 1 2 Major Barney Donaldson 89

    76 Data Science, Public Policy Clay Whelan 67 83 Public Policy Simran Bass 82 90 Statistics Chante Munro 45 72 Political Science, Statistics Gabrielle Cherry 32 79 . Kush Piper 98 sick Statistics Faizan Ratliff 82 75 Data Science Torin Ruiz 70 80 Sociology, Statistics Reiss Richardson missed exam 34 Neuroscience Ajwa Cochran 50 65 Data Science Low participation name exam_1 exam_2 first_major second_major participation Barney Donaldson 89 76 Data Science Public Policy ok Clay Whelan 67 83 Public Policy NA ok Simran Bass 82 90 Statistics NA ok Chante Munro 45 72 Political Science Statistics Low Gabrielle Cherry 32 79 NA NA ok Kush Piper 98 NA Statistics NA ok Faizan Ratliff 82 75 Data Science NA ok Torin Ruiz 70 80 Sociology Statistics ok Reiss Richardson NA 34 Neuroscience NA low Ajwa Cochran 50 65 Data Science NA low record code + document non-code steps + write tests Broman, Karl W., and Kara H. Woo. "Data organization in spreadsheets." The American Statistician 72.1 (2018): 2-10.
  18. raw-data processed-data scripts manuscript figures |- 01-load-packages.R |- 03-clean-data.R |-

    04-explore.R |- 05-model.R |- 06-summarise.R |- 02-load-data.R |- 00-analyse.R
  19. 1 organize your project 2 write READMEs liberally 3 keep

    data tidy & machine readable 4 comment your code 5 use literate programming 6 use version control 7 automate your process 8 share computing environment
  20. Greg Wilson, Jennifer Bryan, Karen Cranston, Justin Kitzes, Lex Nederbragt,

    Tracy K. Teal “Good enough practices in scientific computing." PLoS computational biology 13.6 (2017): e1005510.
  21. The results in Table 1 don’t seem to correspond to

    those in Figure 2 mine-cetinkaya-rundel [email protected] @minebocek bit.ly/tab1-fig2-pydata bit.ly/tab1-fig2