Upgrade to Pro — share decks privately, control downloads, hide ads and more …

Boston 2013 - Session - Cliff Moon

Monitorama
March 28, 2013
300

Boston 2013 - Session - Cliff Moon

Monitorama

March 28, 2013
Tweet

Transcript

  1. Hierarchy of Monitoring Needs • What is going on? •

    Is something wrong? • Why is it wrong? • What should I do about it? Wednesday, May 29, 13
  2. How Do We Climb The Hierarchy • Make simplifying assumptions.

    • Eventually those assumptions break. • What robust assumptions can we make? Wednesday, May 29, 13
  3. The State of the Art • A zoo of home

    grown stuff. • Commercial point solutions. • Enterprise monoliths that require N years of configuration work. Wednesday, May 29, 13
  4. Hierarchy of Monitoring Needs • What is going on? •

    Is something wrong? • Why is it wrong? • What should I do about it? Wednesday, May 29, 13
  5. Hierarchy of Monitoring Needs • What is going on? •

    Is something wrong? • Why is it wrong? • What should I do about it? Wednesday, May 29, 13
  6. I don’t want to stare at a graph all day.

    And what do all these colored lines mean, anyways? Wednesday, May 29, 13
  7. Classification Models • Static thresholds. • Seasonal predictive. • Capacity

    predictive. • SVM’s, Neural Networks, etc. Wednesday, May 29, 13
  8. Wait - On which metrics should I alert, and how

    should I know which values are bad? Wednesday, May 29, 13
  9. Hierarchy of Monitoring Needs • What is going on? •

    Is something wrong? • Why is it wrong? • What should I do about it? Wednesday, May 29, 13
  10. The Dataset is Multivariate • You track many variables per

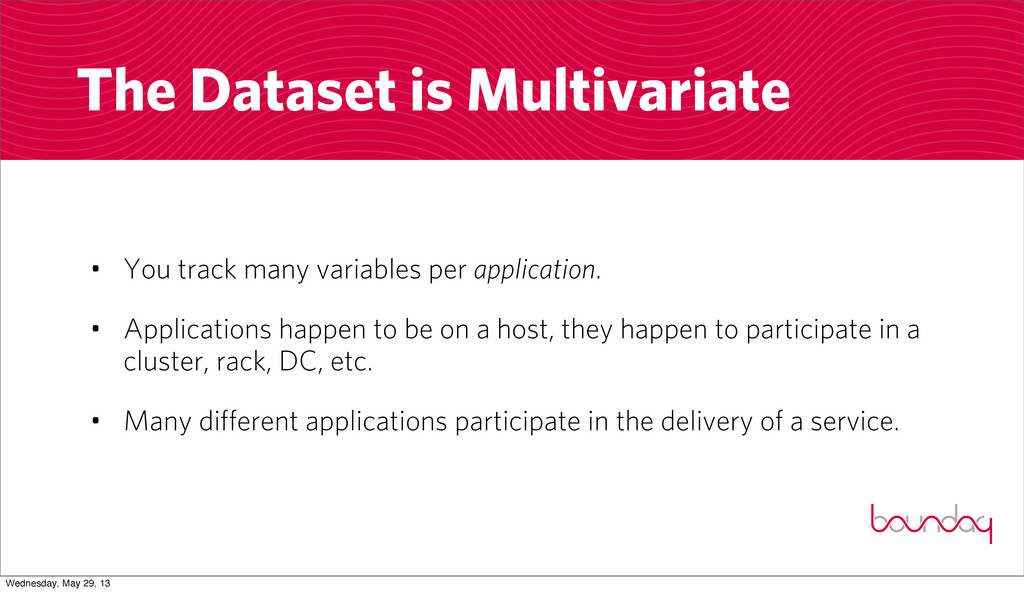
    application. • Applications happen to be on a host, they happen to participate in a cluster, rack, DC, etc. • Many different applications participate in the delivery of a service. Wednesday, May 29, 13
  11. The Data Lives in a Graph • Applications are logically

    connected. • Hosts are physically connected. • This topology provides us with clues as to how things relate. Wednesday, May 29, 13
  12. Use The Graph • The graph provides natural groupings of

    metrics. • Paths from customer issues to contributing factors. • We can strengthen or weaken the graph empirically. Wednesday, May 29, 13
  13. Learning Paths • Similarity search on candidate time series. •

    Over time we can assert strong relationships between variables. • Aberration detection based on variable dependence. Wednesday, May 29, 13
  14. Models • Set expectations for throughput and latency. • Each

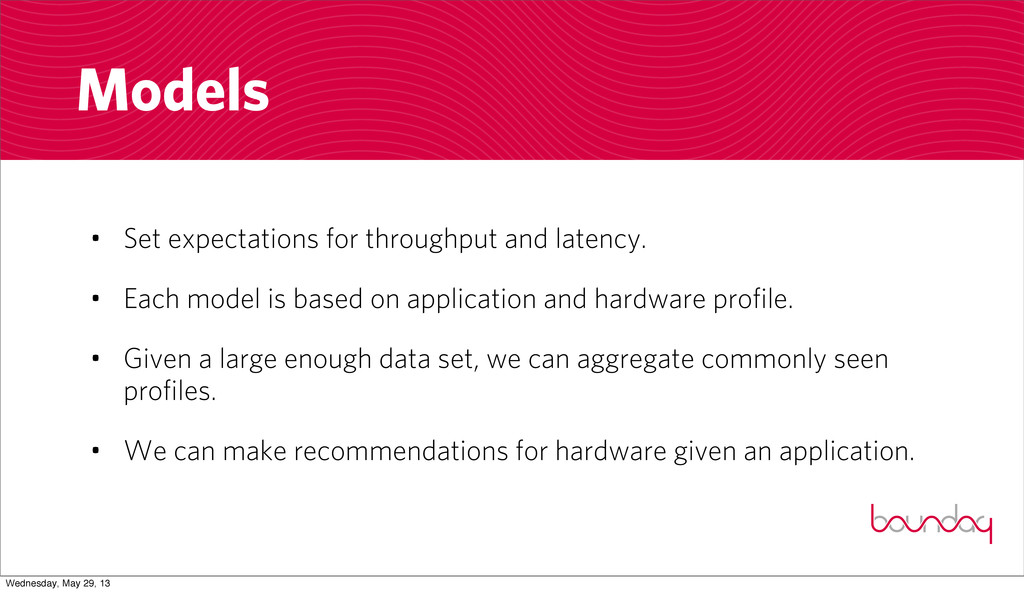
    model is based on application and hardware profile. • Given a large enough data set, we can aggregate commonly seen profiles. • We can make recommendations for hardware given an application. Wednesday, May 29, 13
  15. Why is it Wrong? • Rather - “What changed?” •

    Models can put assumptions up front. • Surface the assumption that was violated. Wednesday, May 29, 13
  16. Data is the Way Forward • We carry it around

    as folklore and institutional knowledge. • It must be collected and quantified. • And automated. Wednesday, May 29, 13
  17. Dependencies • Difficult to integrate in a zoo of monitoring

    point solutions. • High resolution data. • Will never fully be on premise. Wednesday, May 29, 13