Upgrade to Pro — share decks privately, control downloads, hide ads and more …

Portfolio Analysis

Sponsored · Your Podcast. Everywhere. Effortlessly. Share. Educate. Inspire. Entertain. You do you. We'll handle the rest. →

Portfolio Analysis

Avatar for Na Uy Nguyễn

Na Uy Nguyễn

June 04, 2026

Other Decks in Research

Transcript

  1. _________________________________________________________________________________________________________________________________ IMPORTANT DISCLAIMER & DISCLOSURE: This equity research report has

    been prepared independently by the author solely for recruitment, informational, and academic purposes. It does not constitute a prospectus, offering circular, or an invitation, solicitation, or recommendation to subscribe for, purchase, or sell any securities, derivatives, or financial instruments mentioned herein. The information, data, and analytical opinions contained in this document have been compiled from publicly available sources believed to be reliable and accurate at the time of publication. However, no representation or warranty, express or implied, is made by the author as to its completeness, accuracy, or fitness for any particular purpose. Market conditions are subject to rapid change, and the opinions, forecasts, or projections expressed in this report are subject to change without prior notice. Analyst Certification & Conflict of Interest: The author hereby certifies that all views expressed in this report accurately reflect their personal views about the subject company and its securities. The author further declares that they do not hold any financial interest, directorship, or long/short positions in the securities of the subject company, and no part of their compensation or academic evaluation was, is, or will be directly or indirectly related to the specific recommendations or views expressed in this research. Limitation of Liability: Investment in equities involves substantial risks, including the potential loss of principal. Past performance is not indicative of future results. Readers must conduct their own independent investigation, financial assessment, and consult with a licensed financial advisor before making any investment decisions. The author accepts no liability whatsoever for any direct, indirect, or consequential loss or damage arising from the use of or reliance upon any material contained in this report. _________________________________________________________________________________________________________________________________ Portfolio Analysis Portfolio Analysis Prepared by: Nguyen Na Uy
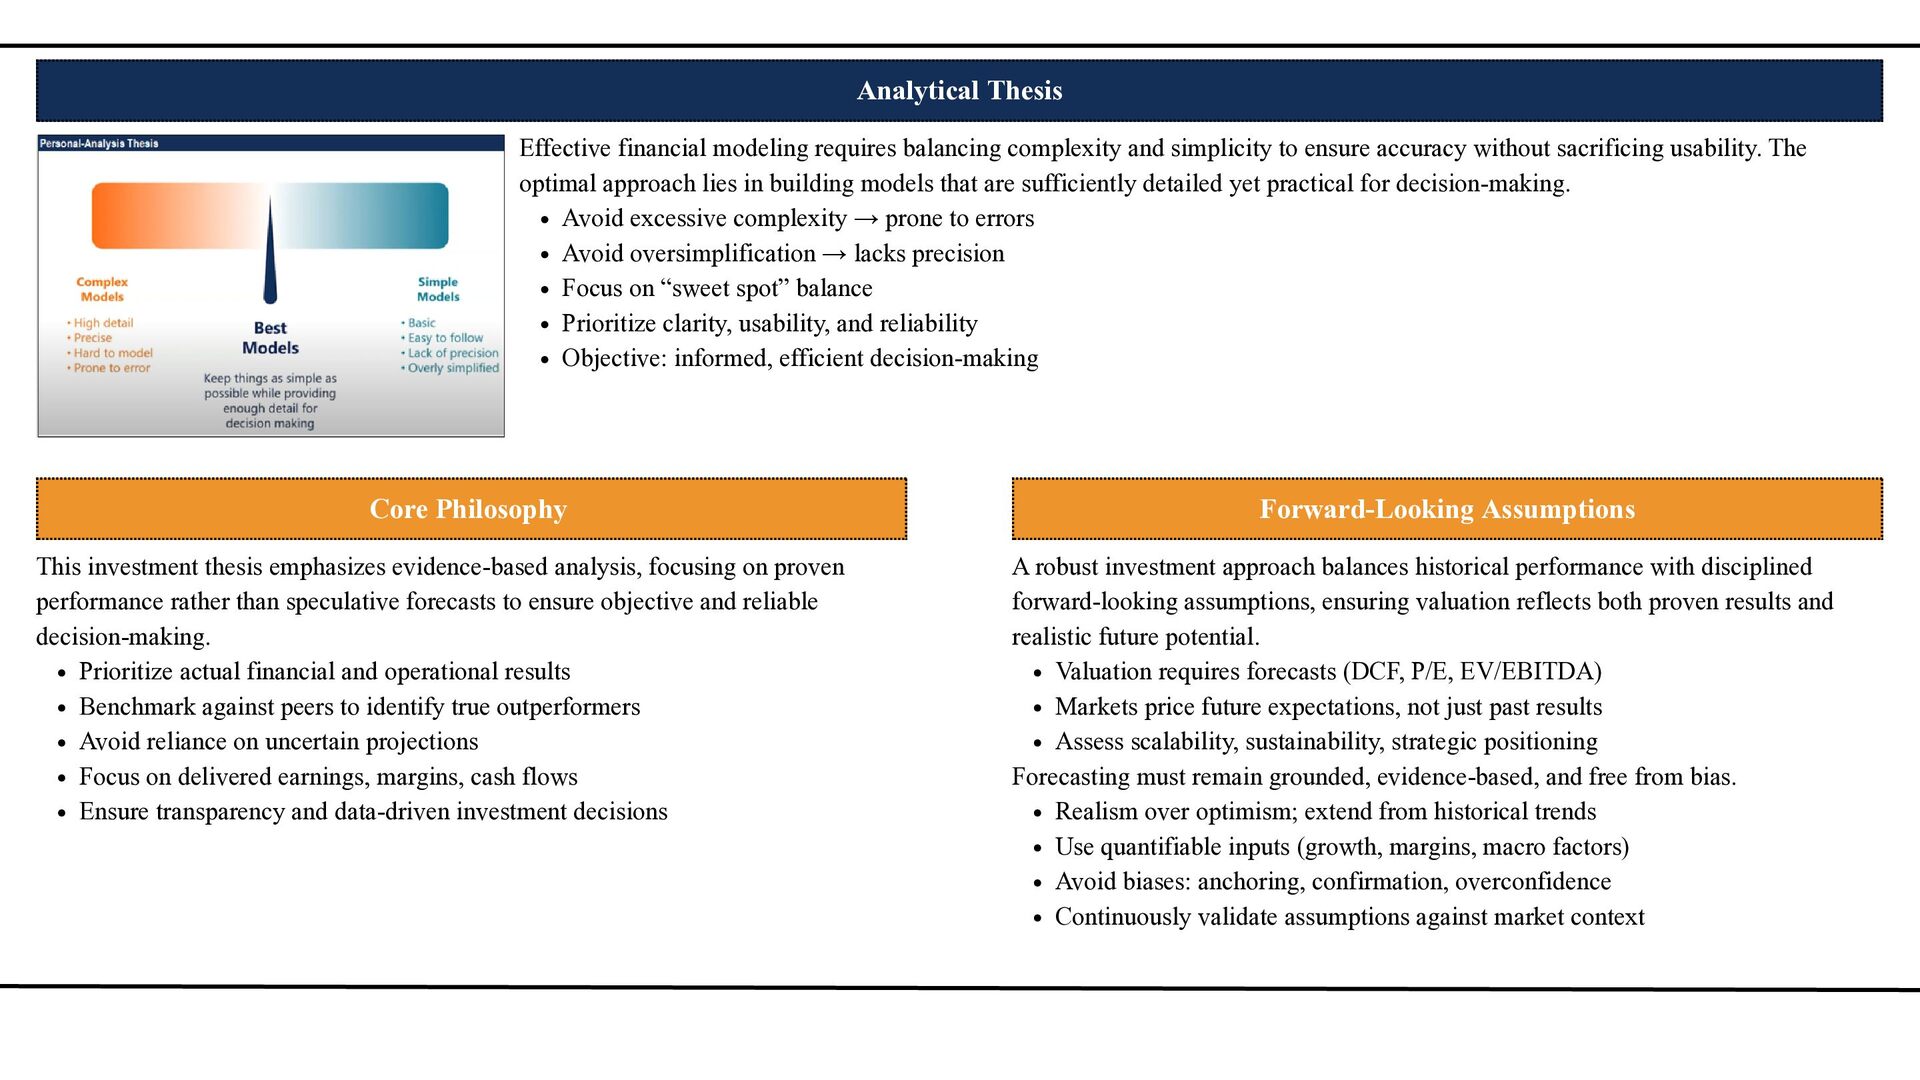
  2. Analytical Thesis Effective financial modeling requires balancing complexity and simplicity

    to ensure accuracy without sacrificing usability. The optimal approach lies in building models that are sufficiently detailed yet practical for decision-making. Avoid excessive complexity → prone to errors Avoid oversimplification → lacks precision Focus on “sweet spot” balance Prioritize clarity, usability, and reliability Objective: informed, efficient decision-making Core Philosophy Forward-Looking Assumptions This investment thesis emphasizes evidence-based analysis, focusing on proven performance rather than speculative forecasts to ensure objective and reliable decision-making. Prioritize actual financial and operational results Benchmark against peers to identify true outperformers Avoid reliance on uncertain projections Focus on delivered earnings, margins, cash flows Ensure transparency and data-driven investment decisions A robust investment approach balances historical performance with disciplined forward-looking assumptions, ensuring valuation reflects both proven results and realistic future potential. Valuation requires forecasts (DCF, P/E, EV/EBITDA) Markets price future expectations, not just past results Assess scalability, sustainability, strategic positioning Forecasting must remain grounded, evidence-based, and free from bias. Realism over optimism; extend from historical trends Use quantifiable inputs (growth, margins, macro factors) Avoid biases: anchoring, confirmation, overconfidence Continuously validate assumptions against market context
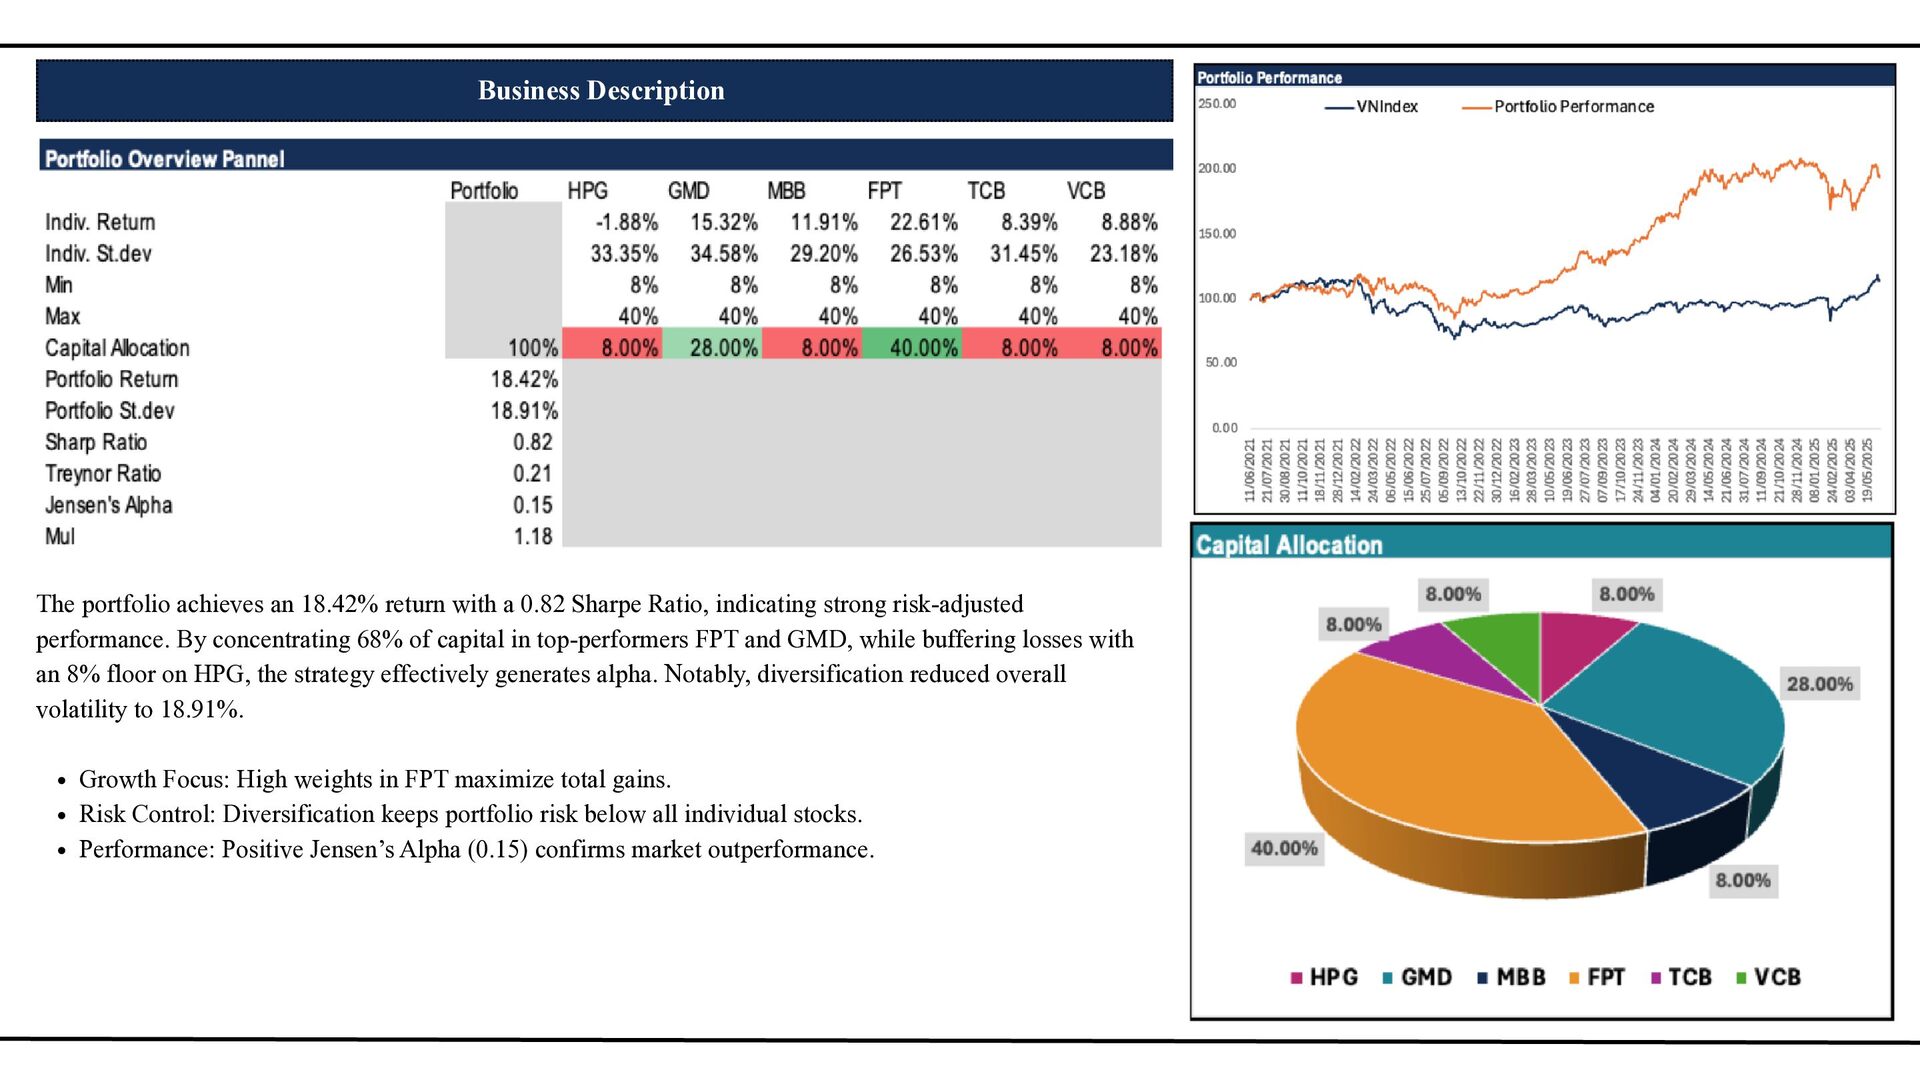
  3. Business Description The portfolio achieves an 18.42% return with a

    0.82 Sharpe Ratio, indicating strong risk-adjusted performance. By concentrating 68% of capital in top-performers FPT and GMD, while buffering losses with an 8% floor on HPG, the strategy effectively generates alpha. Notably, diversification reduced overall volatility to 18.91%. Growth Focus: High weights in FPT maximize total gains. Risk Control: Diversification keeps portfolio risk below all individual stocks. Performance: Positive Jensen’s Alpha (0.15) confirms market outperformance.
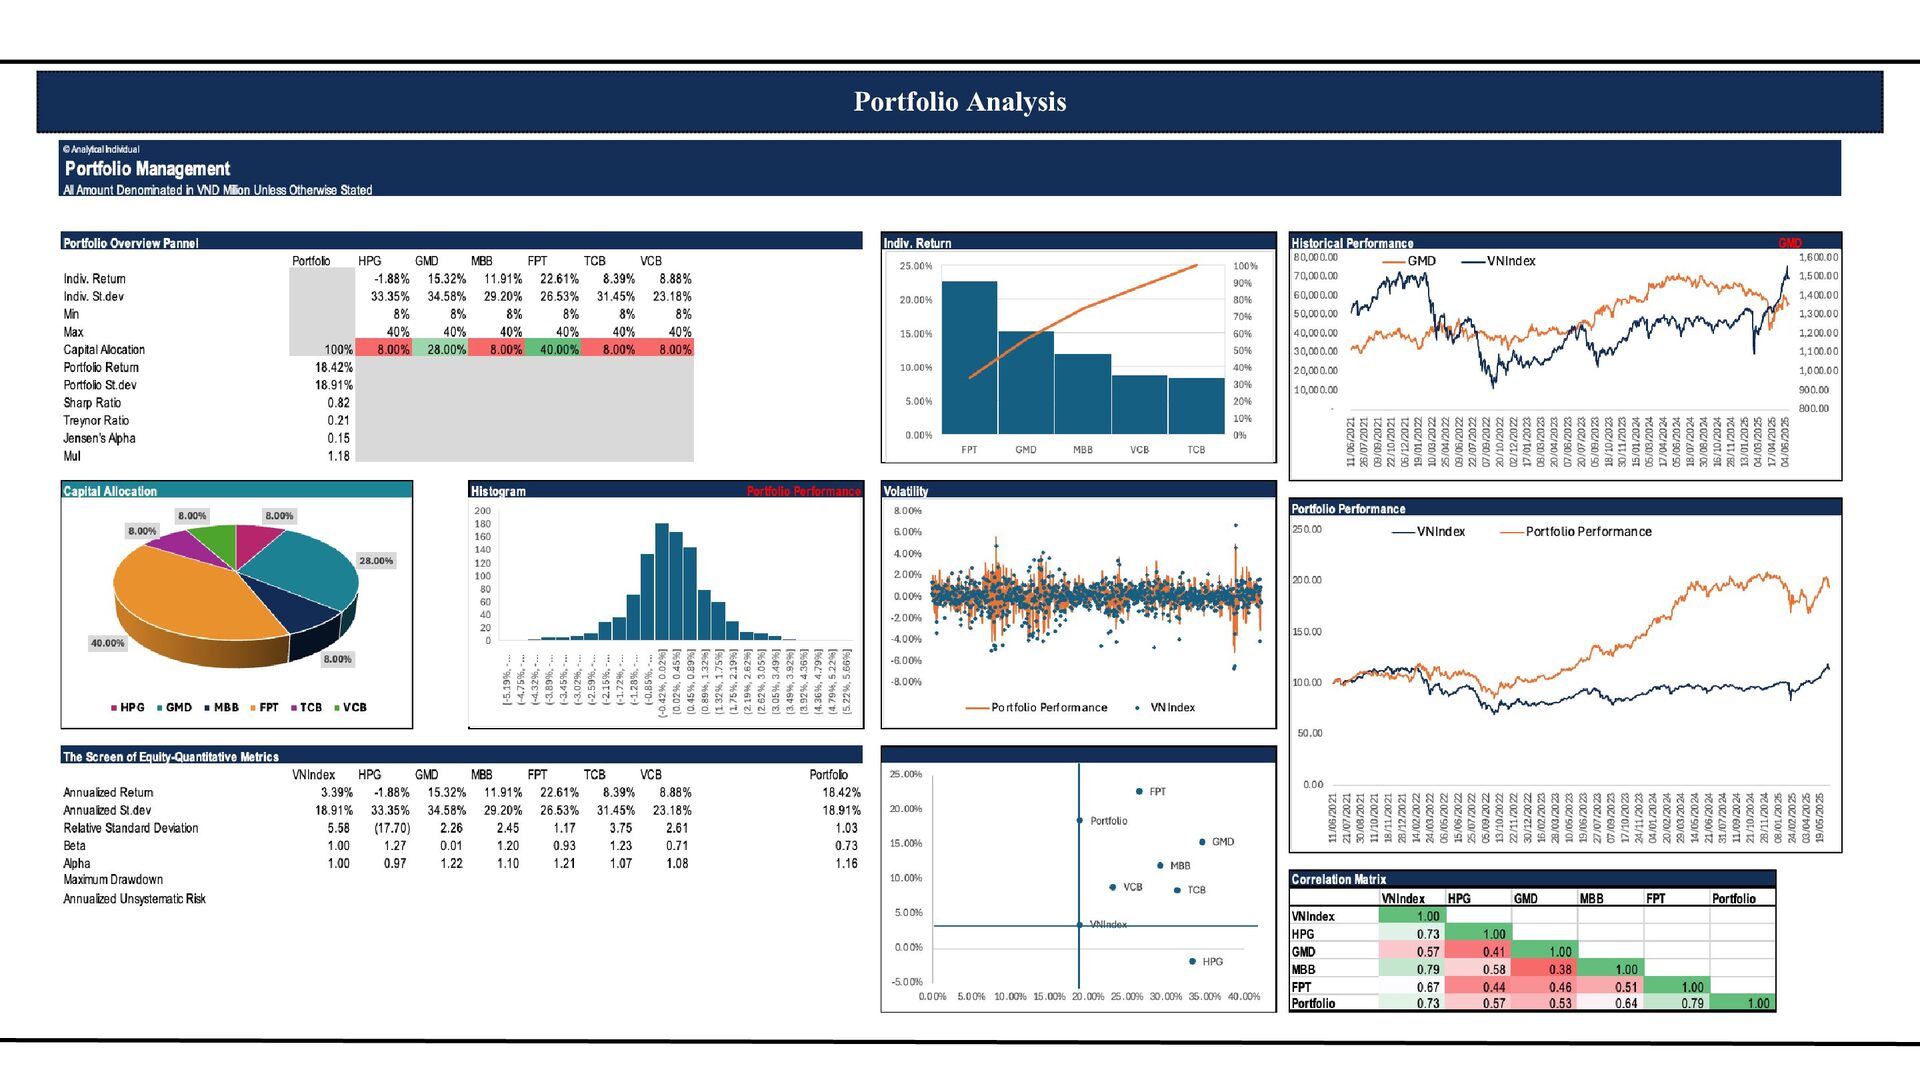
  4. Risk-Return Scatter Plot This risk-return scatter plot highlights the portfolio’s

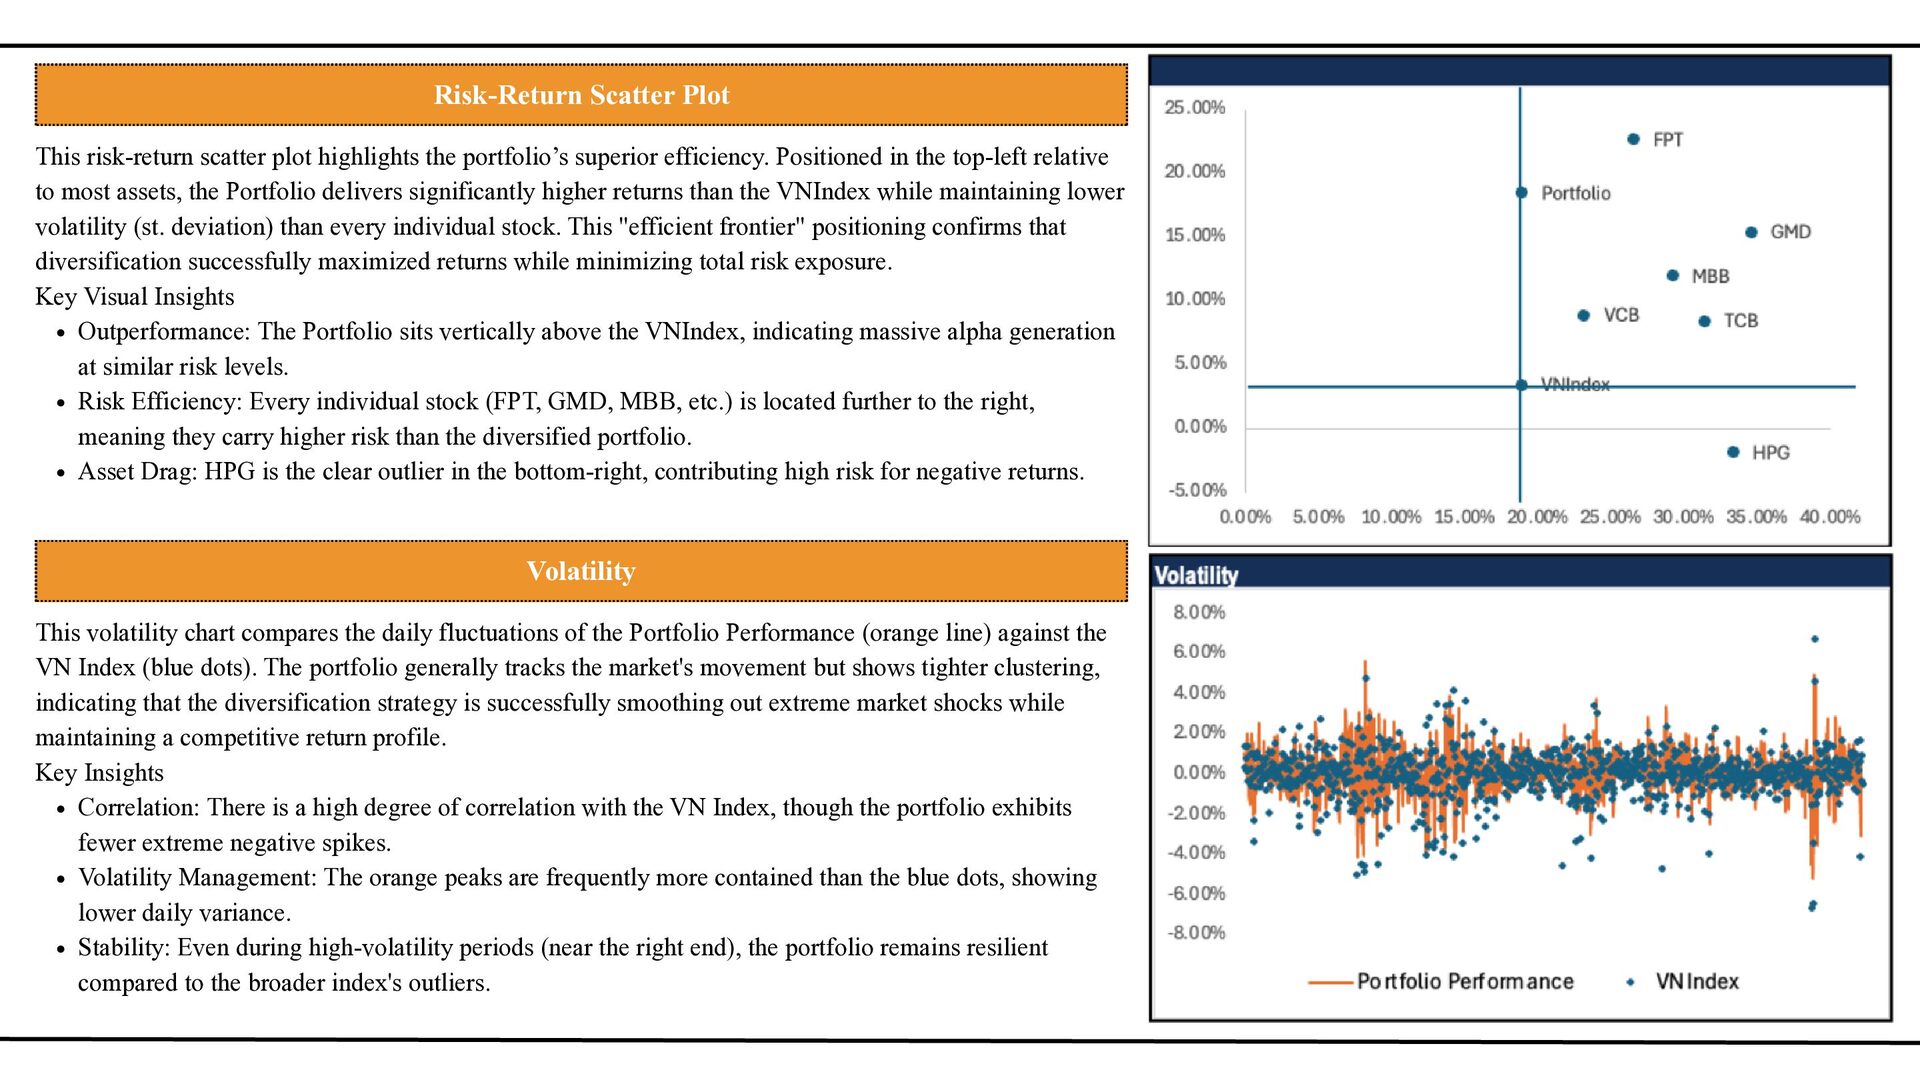
    superior efficiency. Positioned in the top-left relative to most assets, the Portfolio delivers significantly higher returns than the VNIndex while maintaining lower volatility (st. deviation) than every individual stock. This "efficient frontier" positioning confirms that diversification successfully maximized returns while minimizing total risk exposure. Key Visual Insights Outperformance: The Portfolio sits vertically above the VNIndex, indicating massive alpha generation at similar risk levels. Risk Efficiency: Every individual stock (FPT, GMD, MBB, etc.) is located further to the right, meaning they carry higher risk than the diversified portfolio. Asset Drag: HPG is the clear outlier in the bottom-right, contributing high risk for negative returns. Volatility This volatility chart compares the daily fluctuations of the Portfolio Performance (orange line) against the VN Index (blue dots). The portfolio generally tracks the market's movement but shows tighter clustering, indicating that the diversification strategy is successfully smoothing out extreme market shocks while maintaining a competitive return profile. Key Insights Correlation: There is a high degree of correlation with the VN Index, though the portfolio exhibits fewer extreme negative spikes. Volatility Management: The orange peaks are frequently more contained than the blue dots, showing lower daily variance. Stability: Even during high-volatility periods (near the right end), the portfolio remains resilient compared to the broader index's outliers.
  5. Individual Equity The Correlation Matrix reveals a well-structured portfolio where

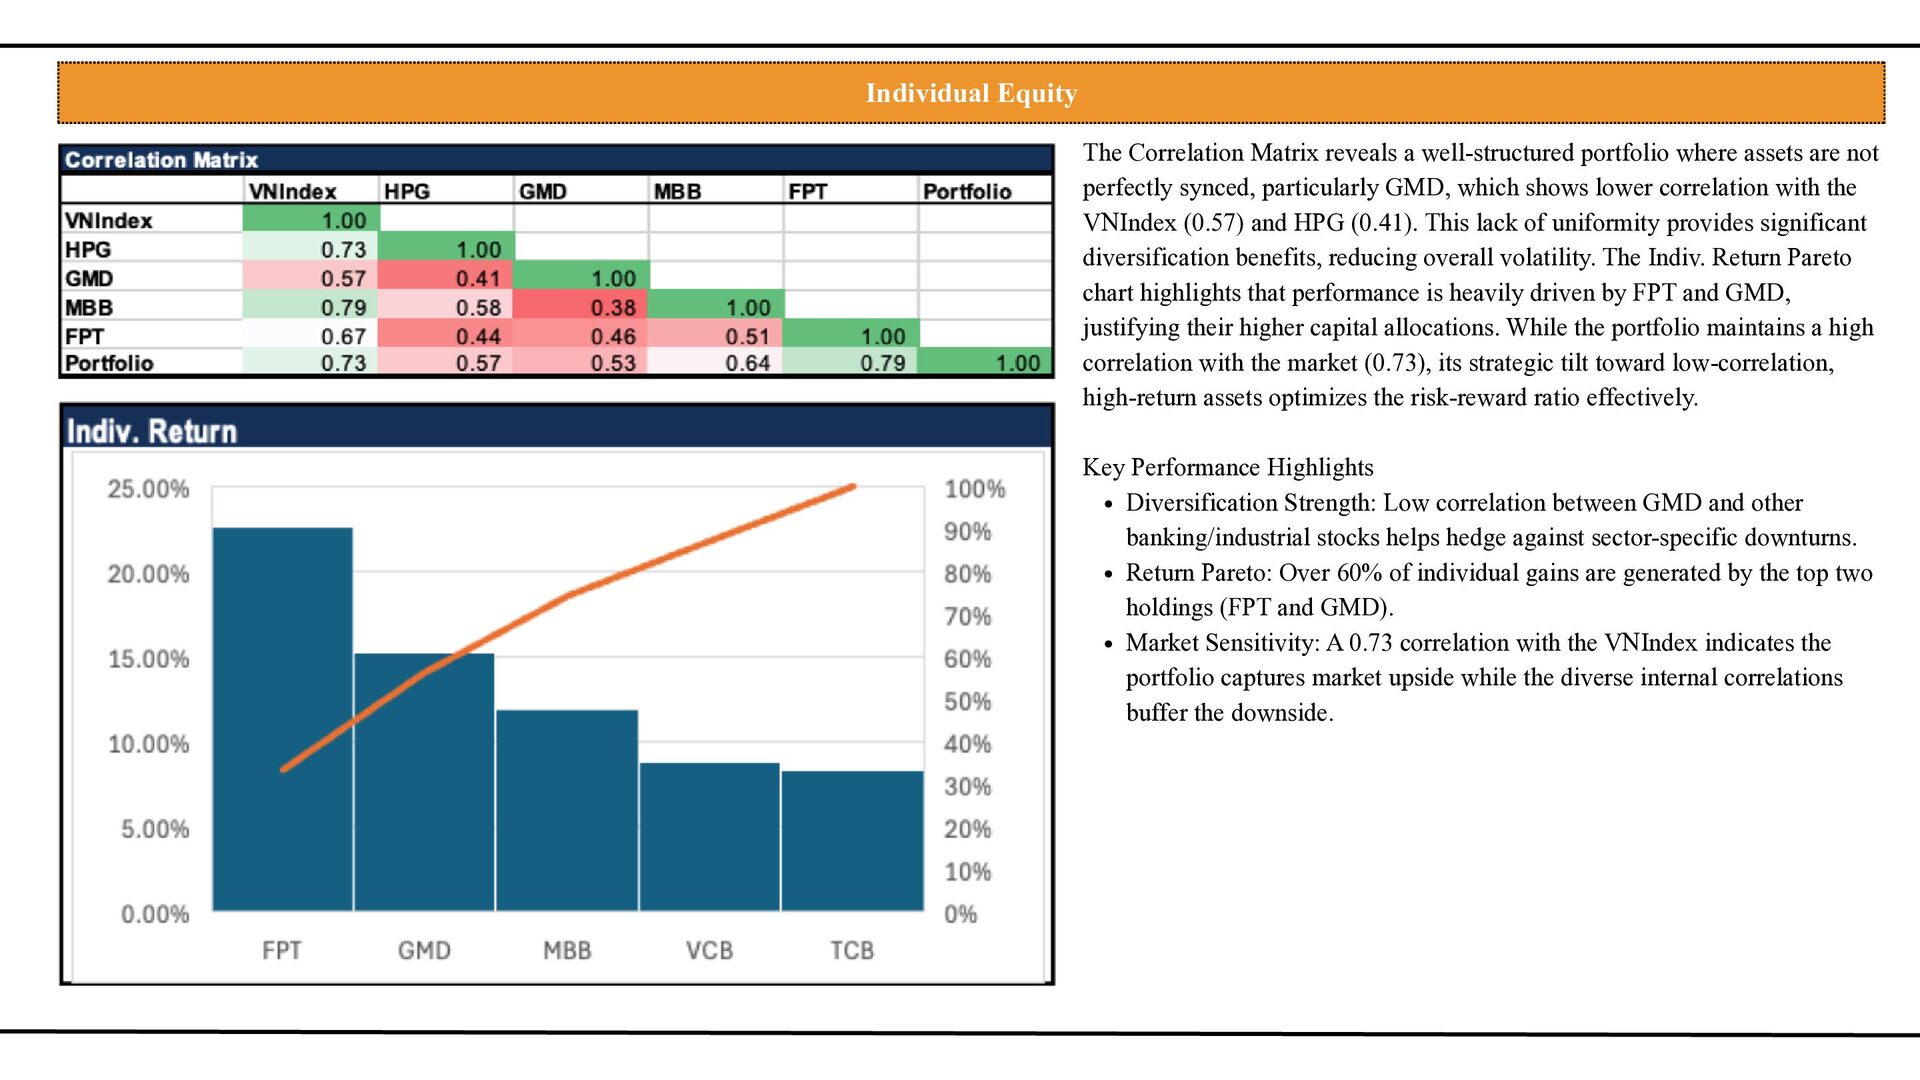
    assets are not perfectly synced, particularly GMD, which shows lower correlation with the VNIndex (0.57) and HPG (0.41). This lack of uniformity provides significant diversification benefits, reducing overall volatility. The Indiv. Return Pareto chart highlights that performance is heavily driven by FPT and GMD, justifying their higher capital allocations. While the portfolio maintains a high correlation with the market (0.73), its strategic tilt toward low-correlation, high-return assets optimizes the risk-reward ratio effectively. Key Performance Highlights Diversification Strength: Low correlation between GMD and other banking/industrial stocks helps hedge against sector-specific downturns. Return Pareto: Over 60% of individual gains are generated by the top two holdings (FPT and GMD). Market Sensitivity: A 0.73 correlation with the VNIndex indicates the portfolio captures market upside while the diverse internal correlations buffer the downside.