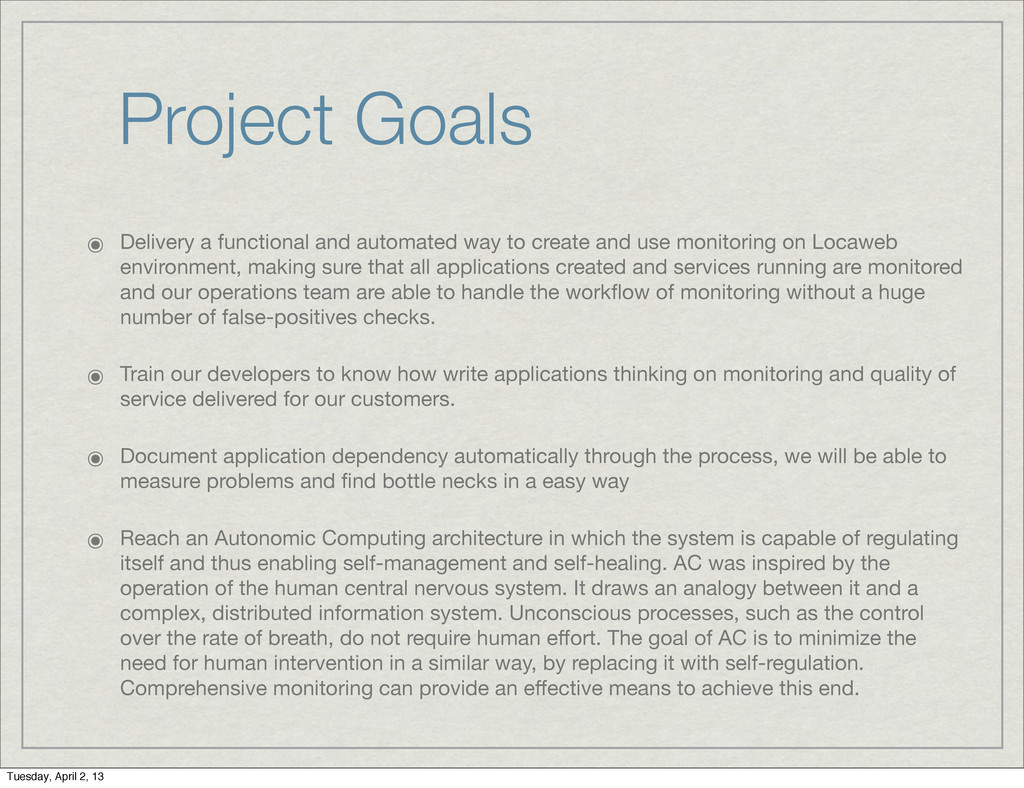
create and use monitoring on Locaweb environment, making sure that all applications created and services running are monitored and our operations team are able to handle the workflow of monitoring without a huge number of false-positives checks. ๏ Train our developers to know how write applications thinking on monitoring and quality of service delivered for our customers. ๏ Document application dependency automatically through the process, we will be able to measure problems and find bottle necks in a easy way ๏ Reach an Autonomic Computing architecture in which the system is capable of regulating itself and thus enabling self-management and self-healing. AC was inspired by the operation of the human central nervous system. It draws an analogy between it and a complex, distributed information system. Unconscious processes, such as the control over the rate of breath, do not require human effort. The goal of AC is to minimize the need for human intervention in a similar way, by replacing it with self-regulation. Comprehensive monitoring can provide an effective means to achieve this end. Tuesday, April 2, 13
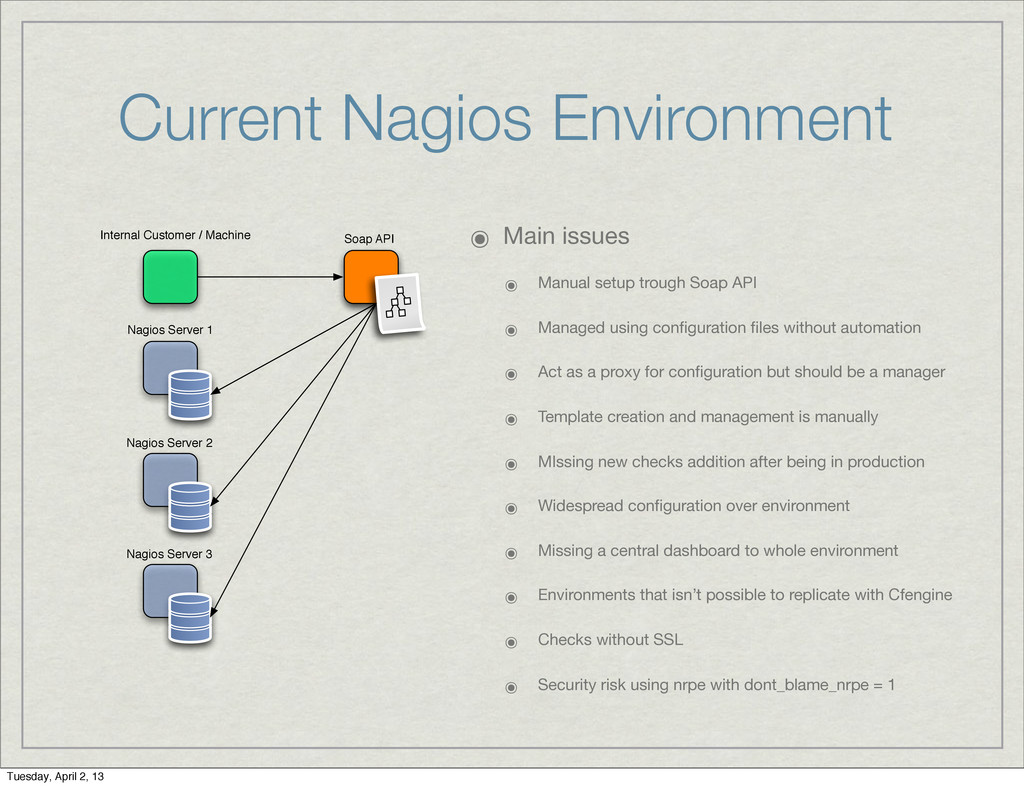
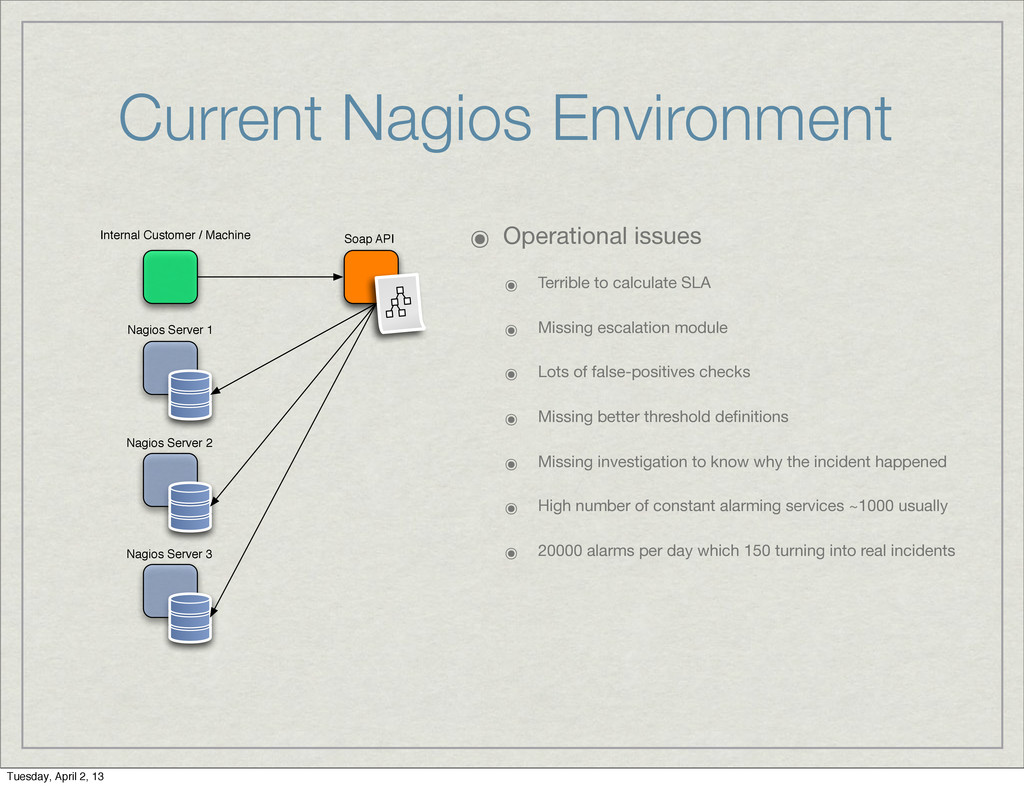
Soap API ๏ Managed using configuration files without automation ๏ Act as a proxy for configuration but should be a manager ๏ Template creation and management is manually ๏ MIssing new checks addition after being in production ๏ Widespread configuration over environment ๏ Missing a central dashboard to whole environment ๏ Environments that isn’t possible to replicate with Cfengine ๏ Checks without SSL ๏ Security risk using nrpe with dont_blame_nrpe = 1 Internal Customer / Machine Nagios Server 1 Nagios Server 2 Nagios Server 3 Soap API Tuesday, April 2, 13
SLA ๏ Missing escalation module ๏ Lots of false-positives checks ๏ Missing better threshold definitions ๏ Missing investigation to know why the incident happened ๏ High number of constant alarming services ~1000 usually ๏ 20000 alarms per day which 150 turning into real incidents Internal Customer / Machine Nagios Server 1 Nagios Server 2 Nagios Server 3 Soap API Tuesday, April 2, 13
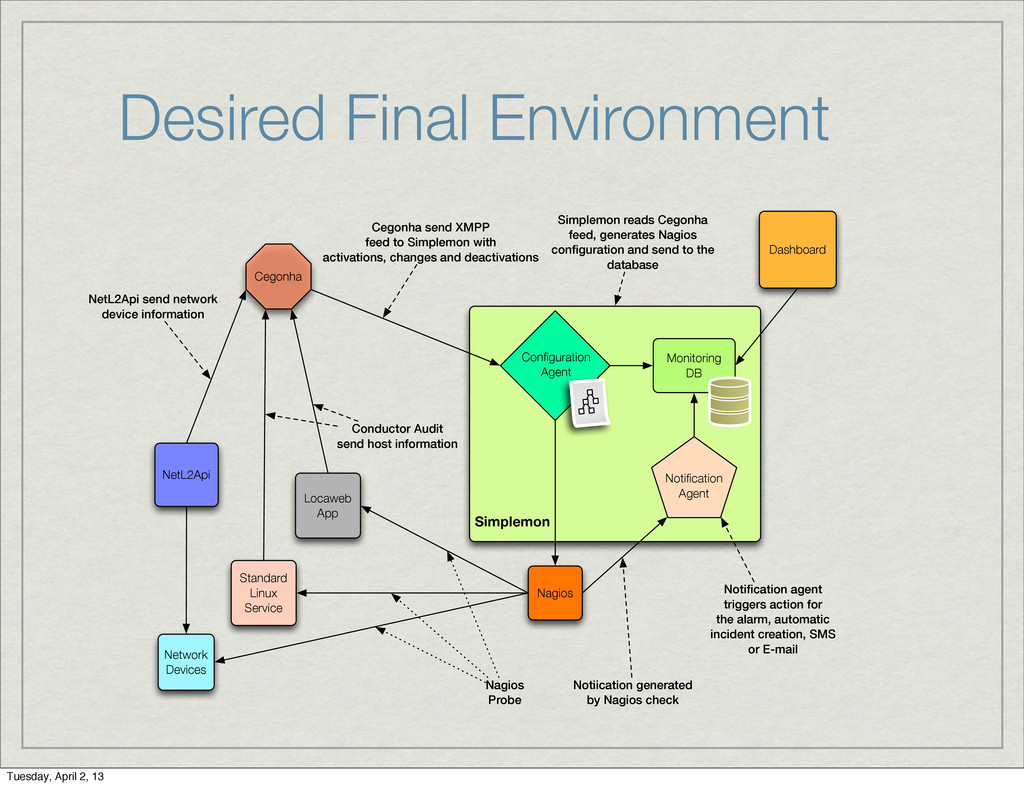
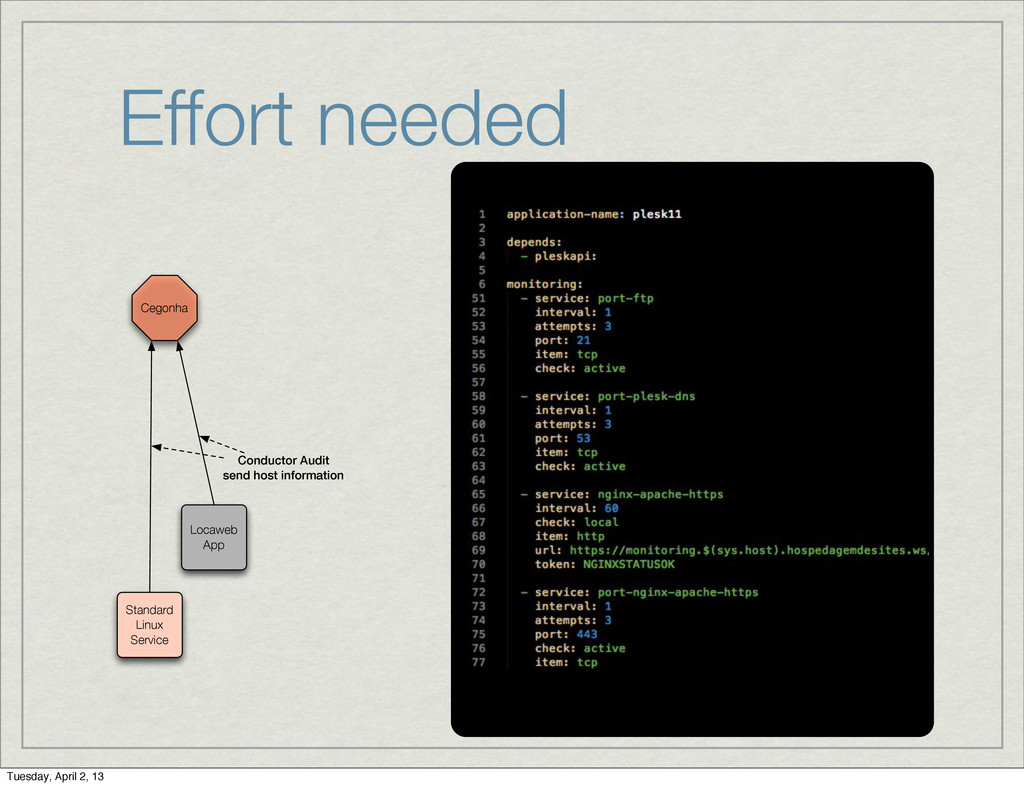
DB Configuration Agent Cegonha Dashboard Notification Agent Network Devices NetL2Api Simplemon Nagios Probe Notiication generated by Nagios check NetL2Api send network device information Conductor Audit send host information Cegonha send XMPP feed to Simplemon with activations, changes and deactivations Simplemon reads Cegonha feed, generates Nagios configuration and send to the database Notification agent triggers action for the alarm, automatic incident creation, SMS or E-mail Tuesday, April 2, 13
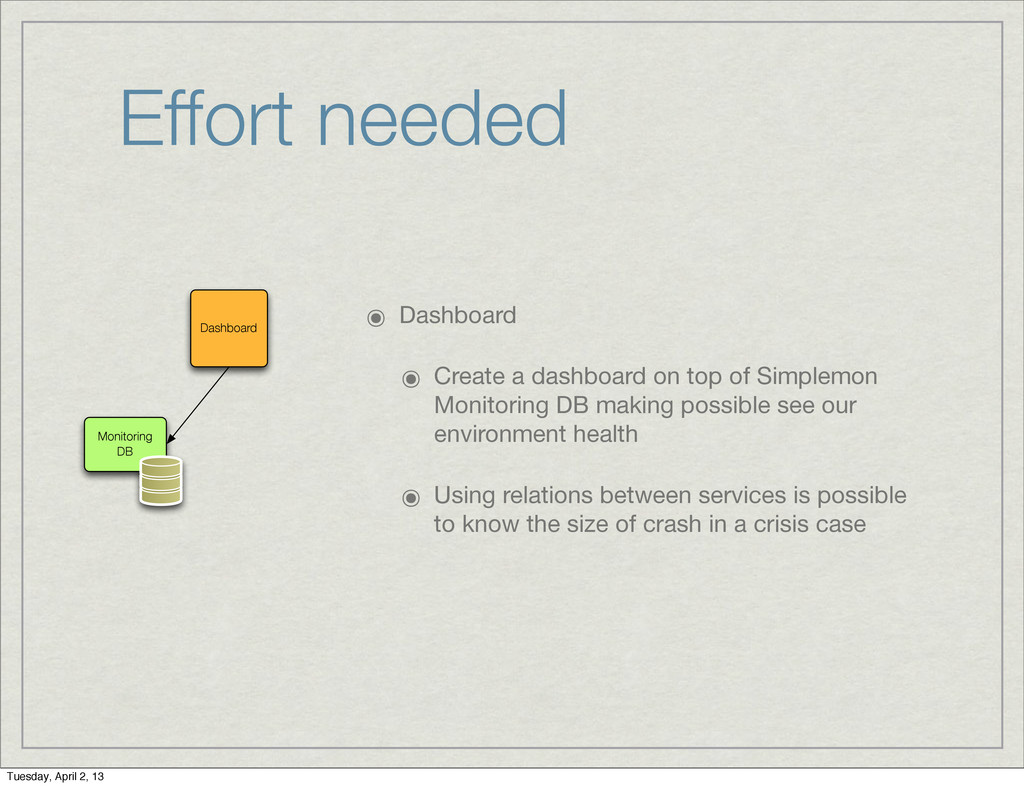
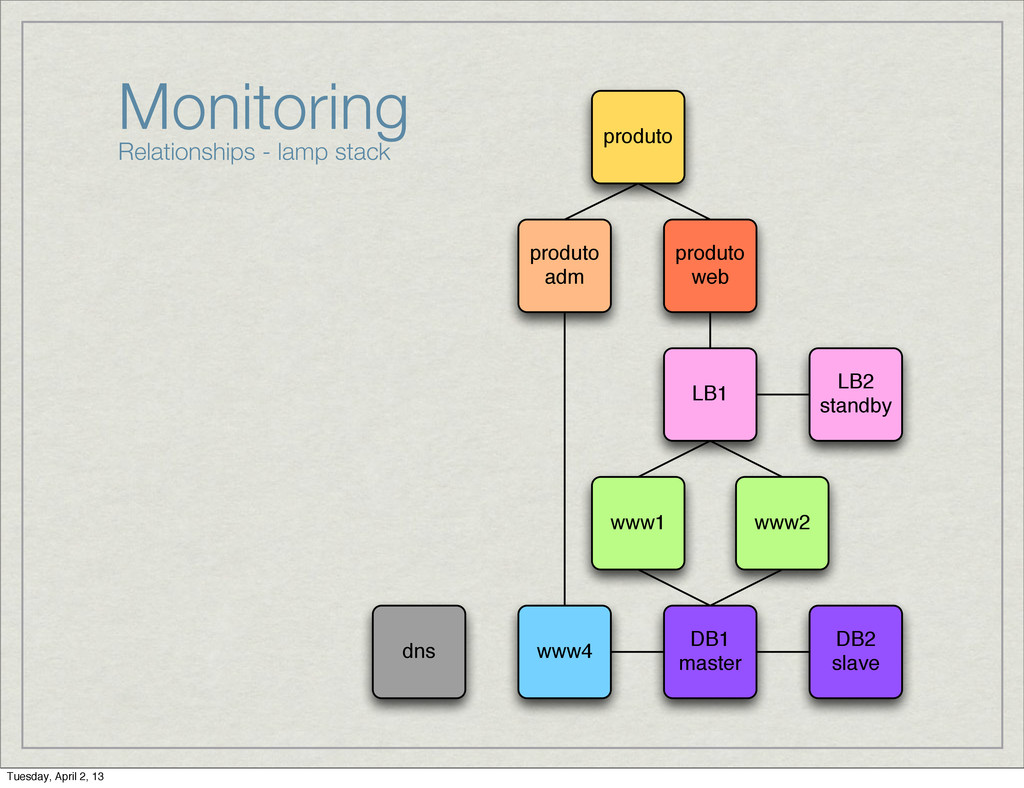
of Simplemon Monitoring DB making possible see our environment health ๏ Using relations between services is possible to know the size of crash in a crisis case Monitoring DB Dashboard Tuesday, April 2, 13
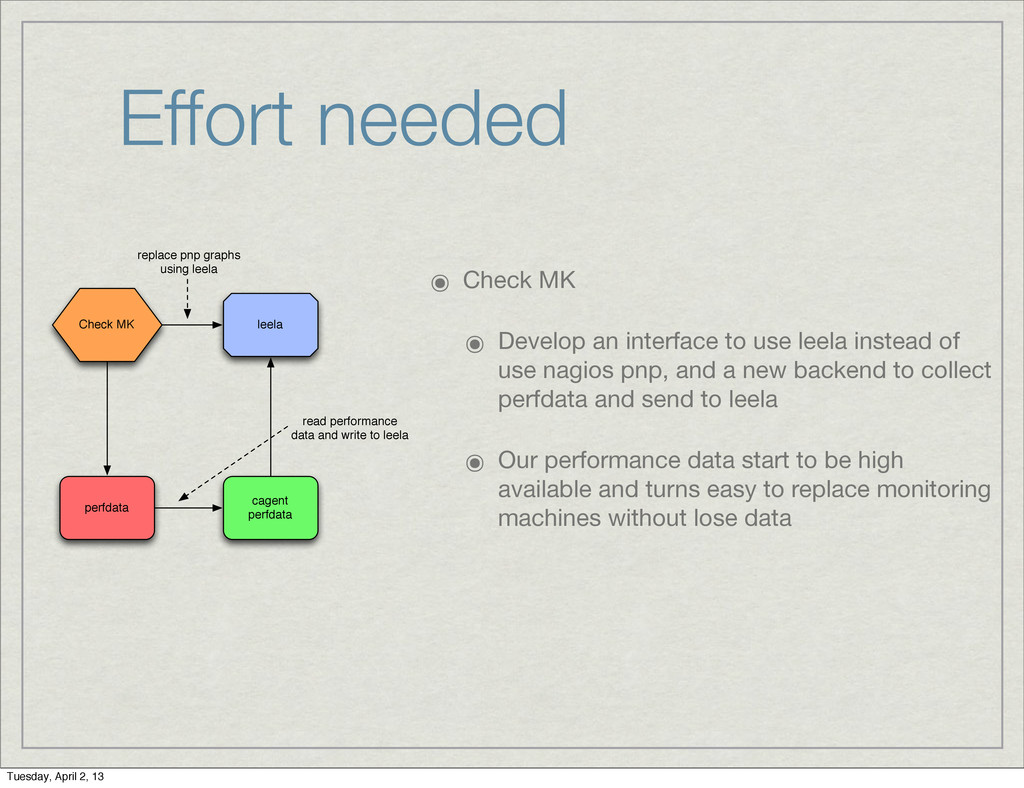
use leela instead of use nagios pnp, and a new backend to collect perfdata and send to leela ๏ Our performance data start to be high available and turns easy to replace monitoring machines without lose data Check MK perfdata cagent perfdata leela read performance data and write to leela replace pnp graphs using leela Tuesday, April 2, 13
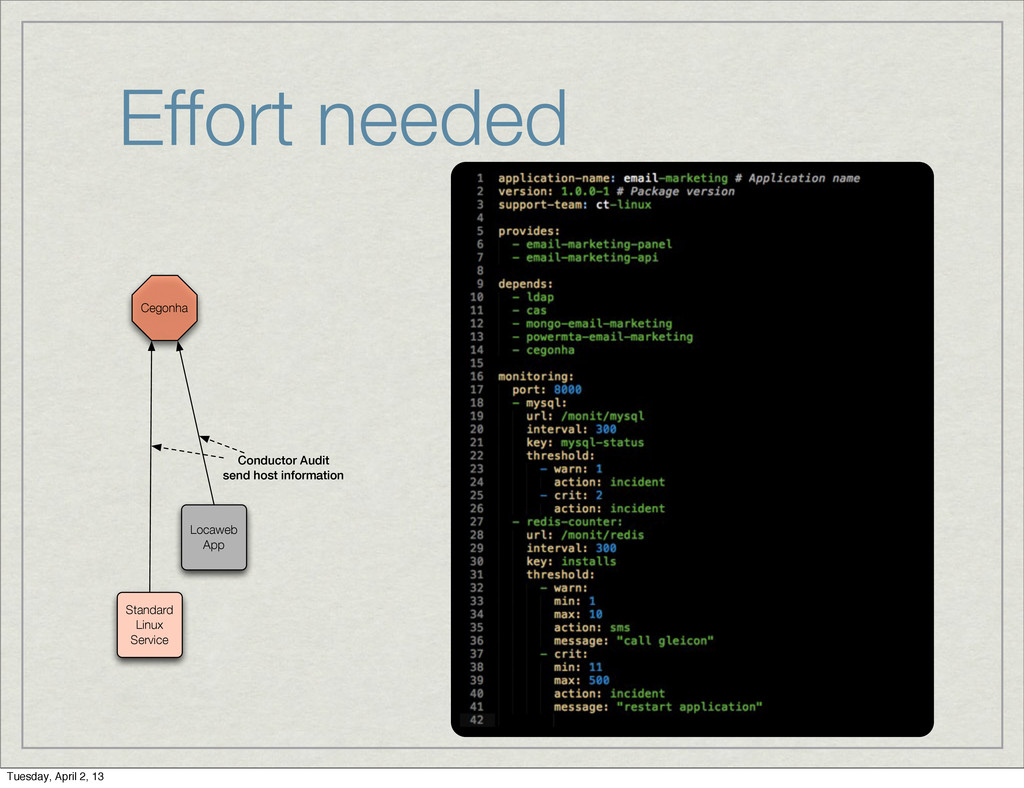
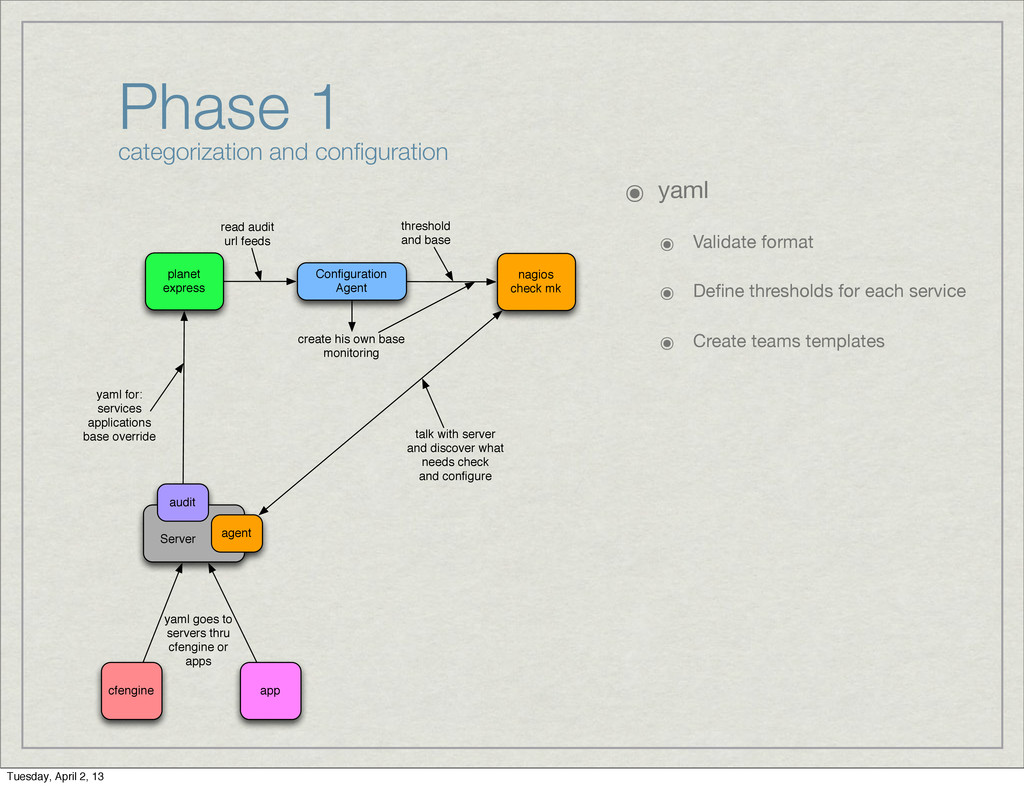
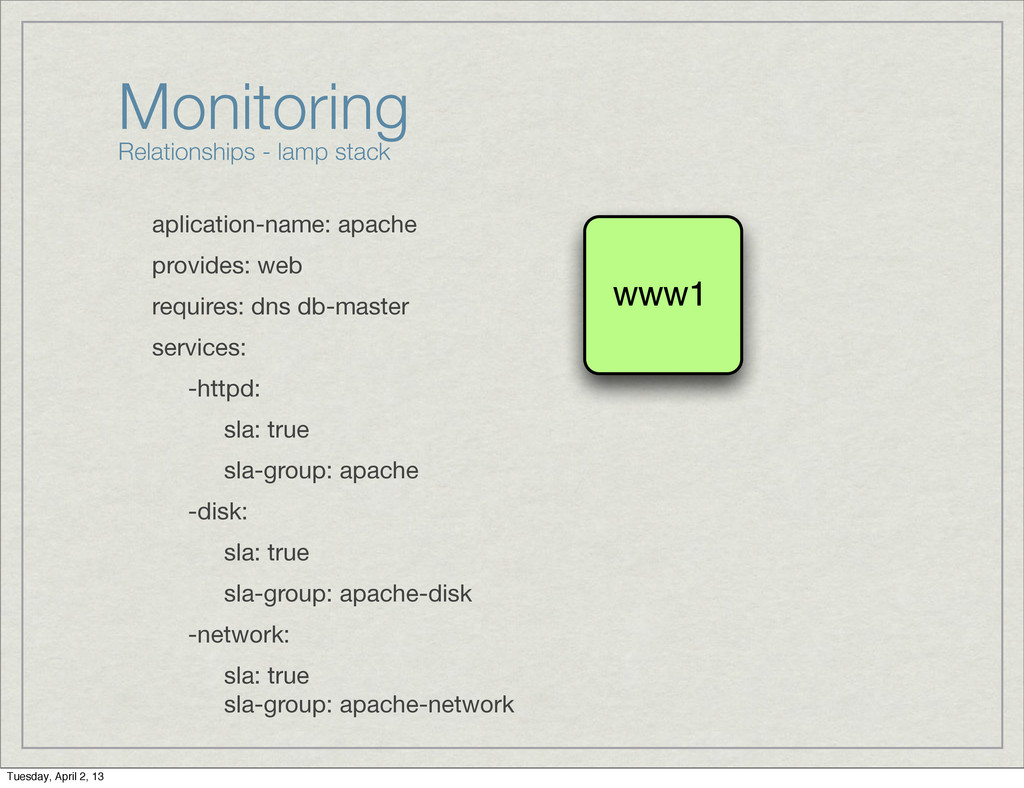
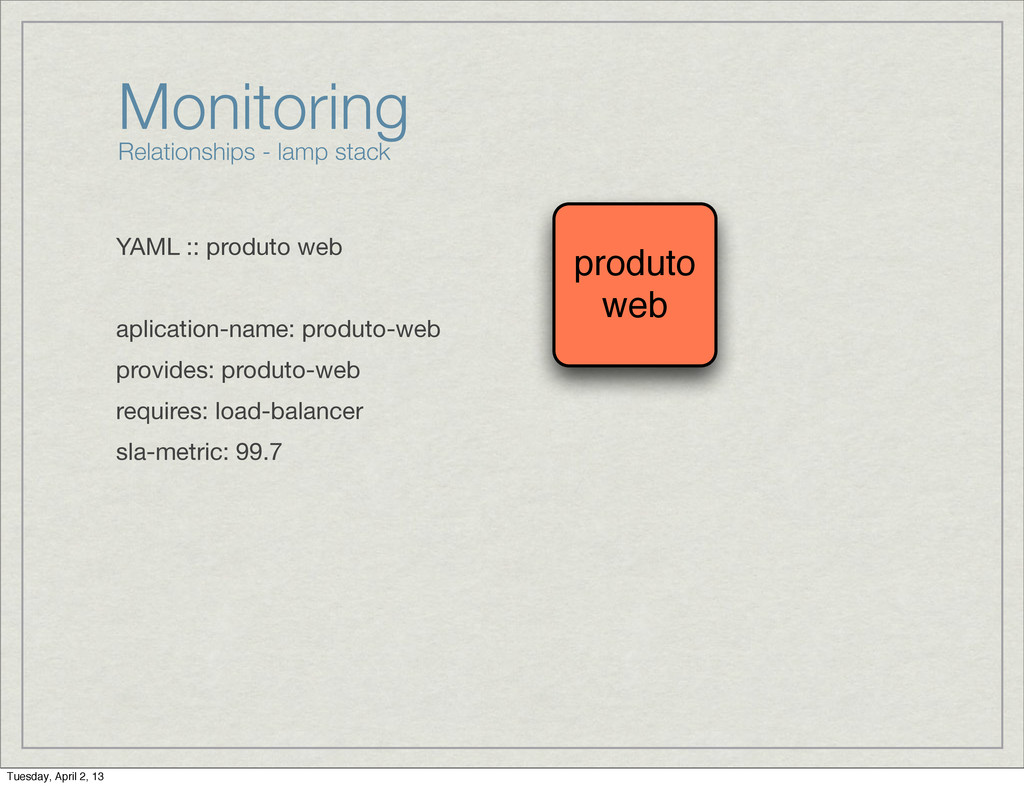
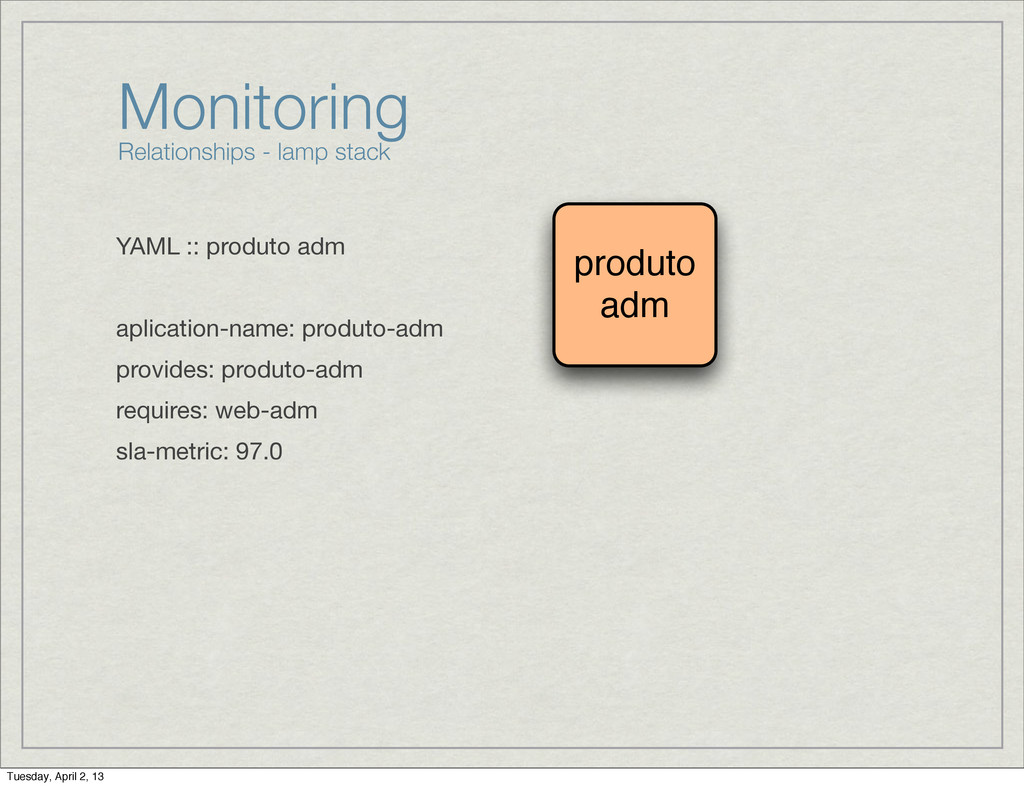
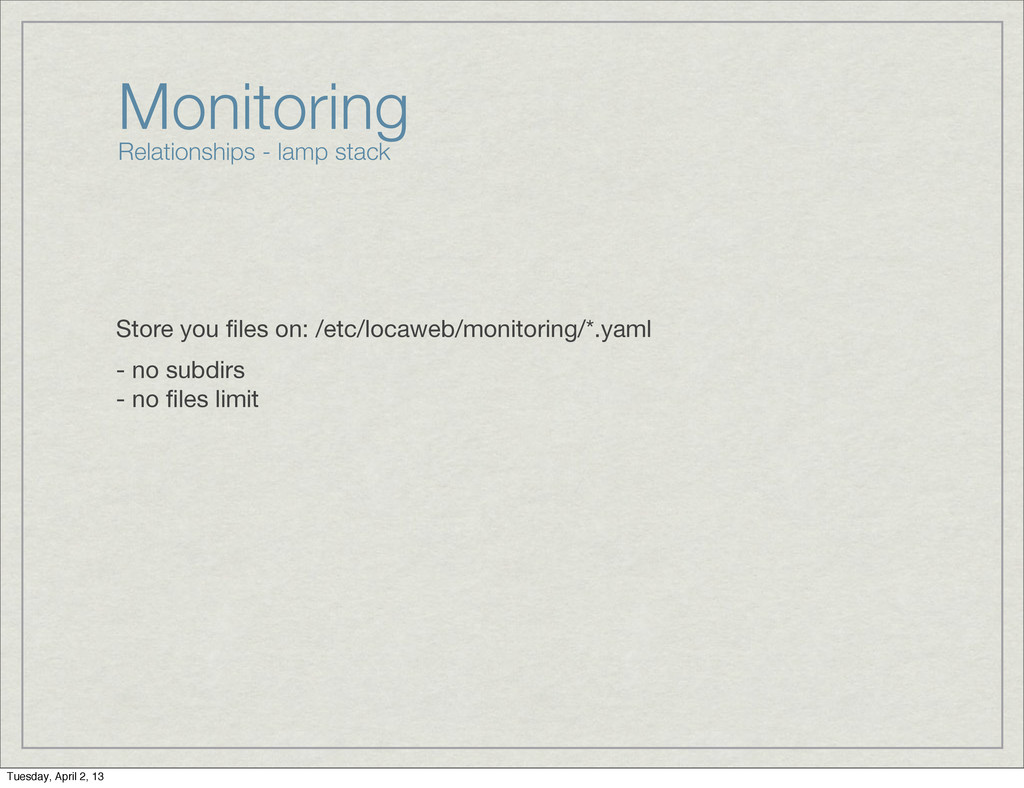
๏ Define thresholds for each service ๏ Create teams templates audit Server planet express yaml for: services applications base override nagios check mk threshold and base talk with server and discover what needs check and configure agent Configuration Agent read audit url feeds cfengine app yaml goes to servers thru cfengine or apps create his own base monitoring Tuesday, April 2, 13