Upgrade to Pro — share decks privately, control downloads, hide ads and more …

Improve_Monitoring_And_Observability_for_Kubernetes_with_OSS_tools.pdf

 Improve_Monitoring_And_Observability_for_Kubernetes_with_OSS_tools.pdf

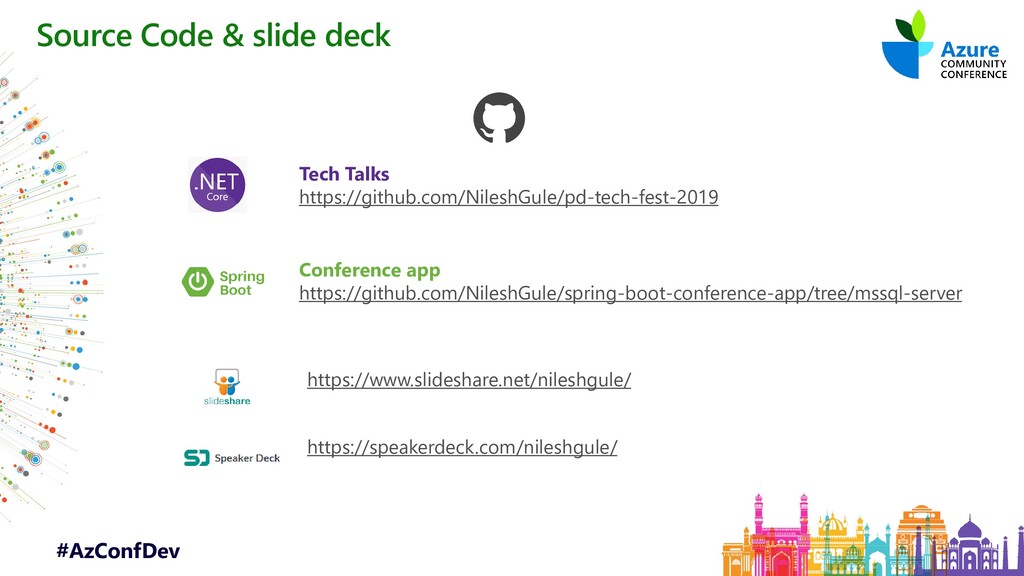
Slide deck from the Azure Community Conference (https://azconf.dev/) presented on 29th October 2021. The session covered following topics
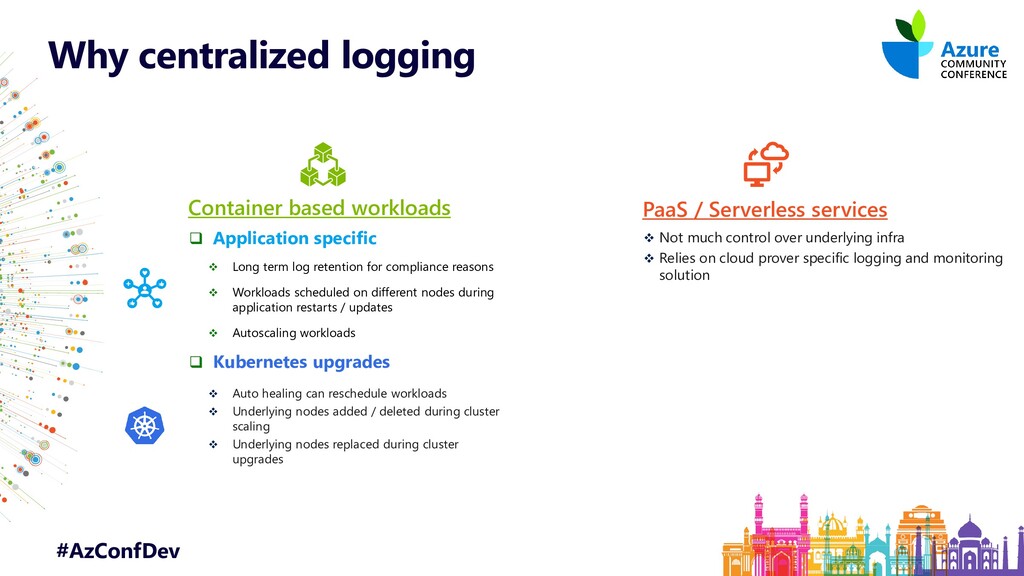
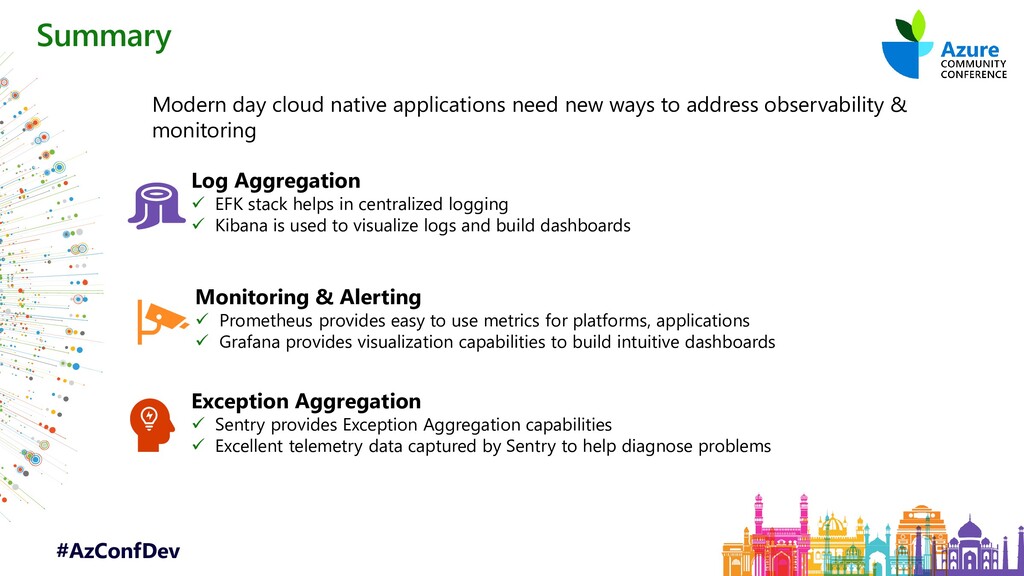
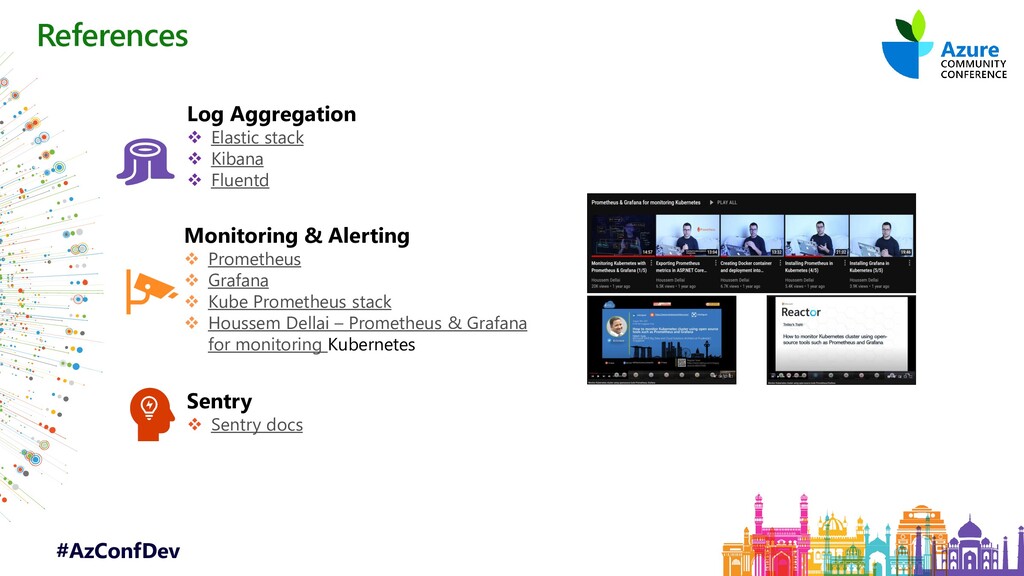
- Need for centralized logging
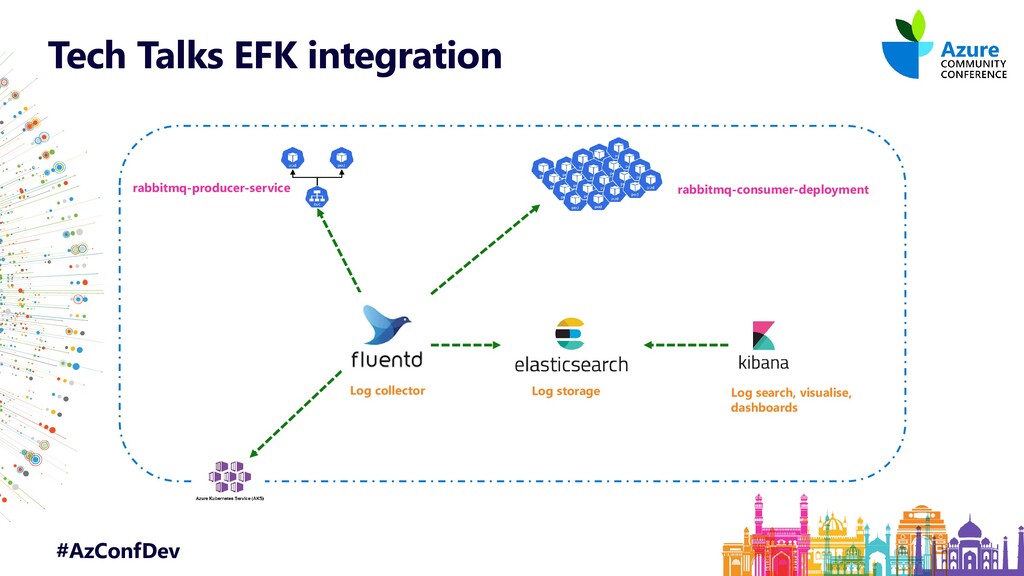
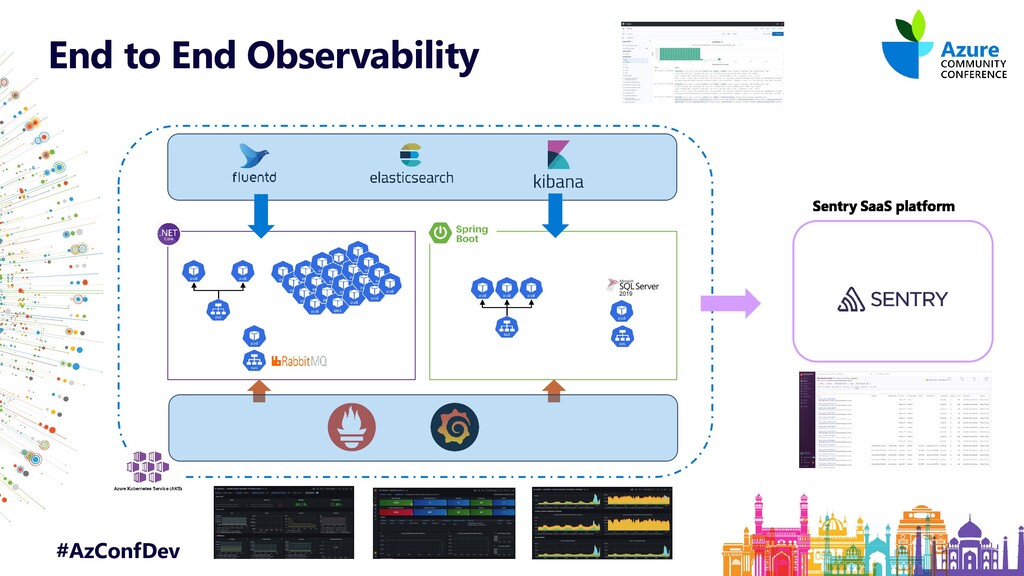
- Using ElasticSearch, Fluentd and Kibana (EFK) with Kubernetes
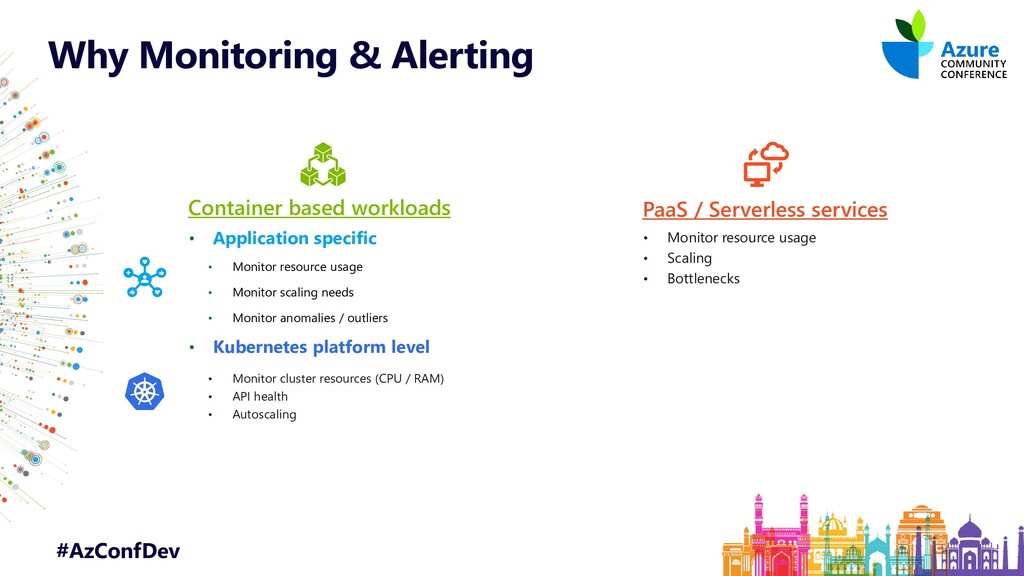
- Need for monitoring
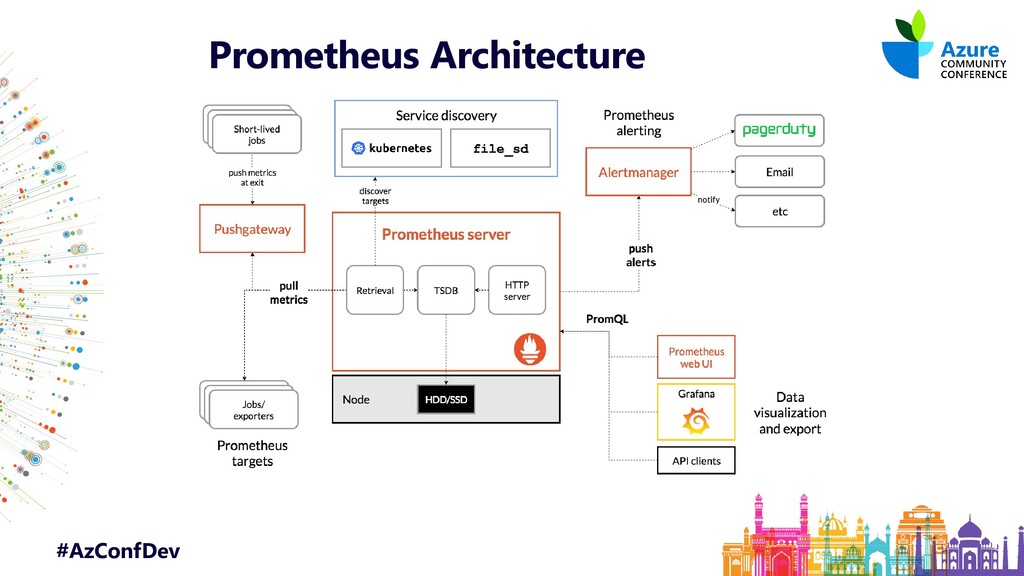
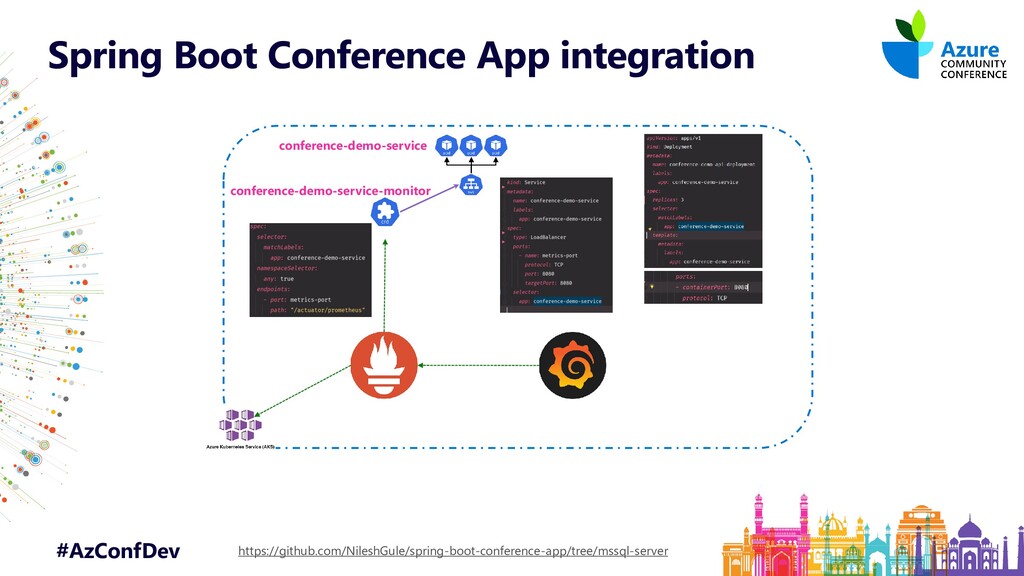
- Using Prometheus & Grafana for infrastructure, application and third party services
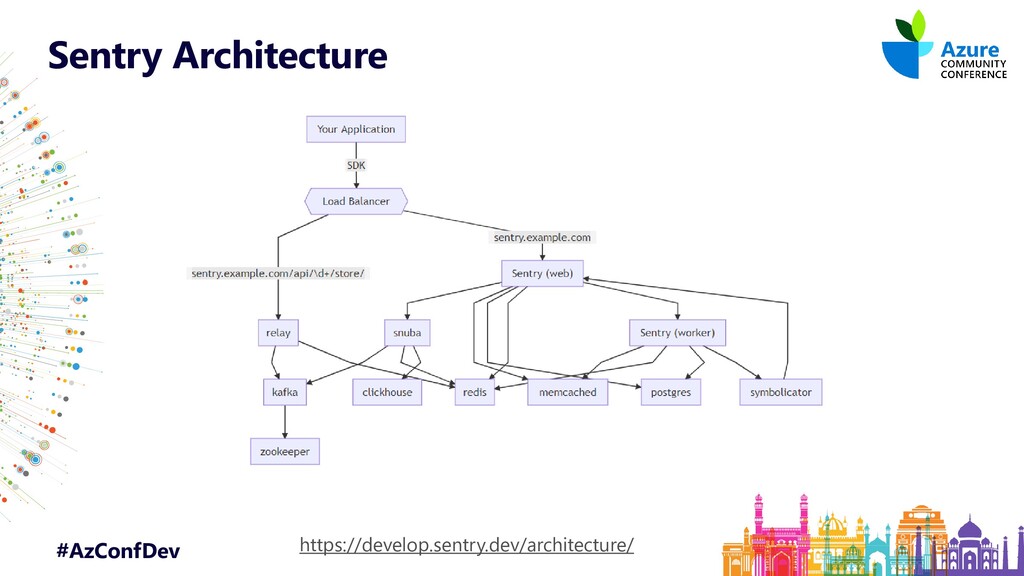
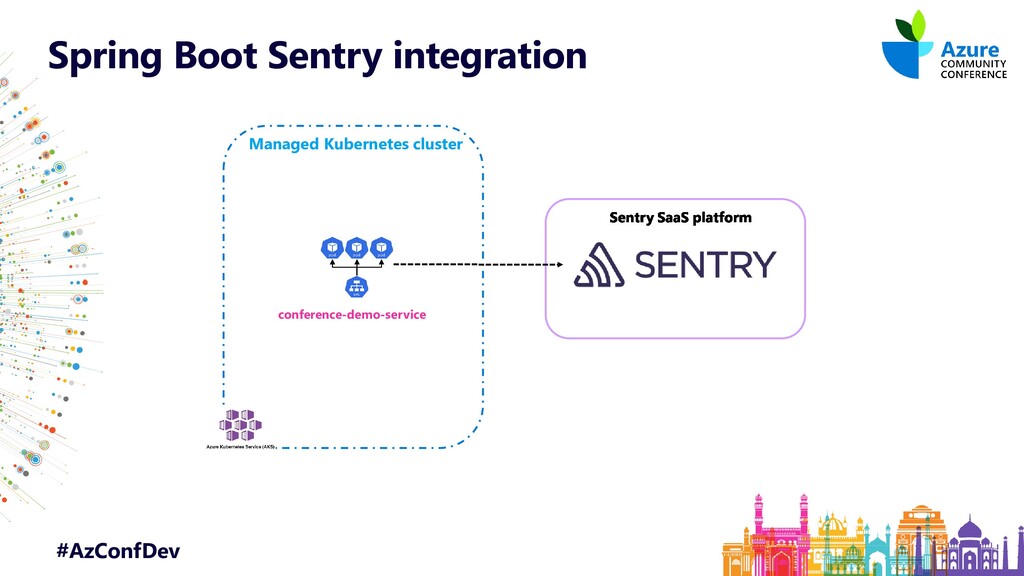
- Integration of application with Sentry for Exception aggregation

Nilesh Gule

October 29, 2021
Tweet

More Decks by Nilesh Gule

Other Decks in Technology

Transcript

  1. #AzConfDev Pre-requisites Self contained application with all its dependencies Docker

    ❖ Orchestrates containers ❖ Self healing ❖ Service discovery ❖ Scaling Kubernetes ❖ Scalable apps in dynamic environments (public / private / hybrid clouds) ❖ Exemplified by Containers, service meshes, microservices, immutable infrastructure & declarative APIs ❖ Loosely coupled systems, resilient, observable & manageable ❖ Robust automation Cloud Native Applications
  2. #AzConfDev ❑ Application specific ❖ Long term log retention for

    compliance reasons ❖ Workloads scheduled on different nodes during application restarts / updates ❖ Autoscaling workloads ❑ Kubernetes upgrades ❖ Auto healing can reschedule workloads ❖ Underlying nodes added / deleted during cluster scaling ❖ Underlying nodes replaced during cluster upgrades Container based workloads Why centralized logging ❖ Not much control over underlying infra ❖ Relies on cloud prover specific logging and monitoring solution PaaS / Serverless services
  3. #AzConfDev Tech Talks EFK integration Log collector Log storage Log

    search, visualise, dashboards rabbitmq-producer-service rabbitmq-consumer-deployment
  4. #AzConfDev • Application specific • Monitor resource usage • Monitor

    scaling needs • Monitor anomalies / outliers • Kubernetes platform level • Monitor cluster resources (CPU / RAM) • API health • Autoscaling Container based workloads Why Monitoring & Alerting • Monitor resource usage • Scaling • Bottlenecks PaaS / Serverless services
  5. #AzConfDev Summary Modern day cloud native applications need new ways

    to address observability & monitoring Log Aggregation ✓ EFK stack helps in centralized logging ✓ Kibana is used to visualize logs and build dashboards Monitoring & Alerting ✓ Prometheus provides easy to use metrics for platforms, applications ✓ Grafana provides visualization capabilities to build intuitive dashboards Exception Aggregation ✓ Sentry provides Exception Aggregation capabilities ✓ Excellent telemetry data captured by Sentry to help diagnose problems
  6. #AzConfDev References Log Aggregation ❖ Elastic stack ❖ Kibana ❖

    Fluentd Monitoring & Alerting ❖ Prometheus ❖ Grafana ❖ Kube Prometheus stack ❖ Houssem Dellai – Prometheus & Grafana for monitoring Kubernetes Sentry ❖ Sentry docs
  7. #AzConfDev Source Code & slide deck Tech Talks https://github.com/NileshGule/pd-tech-fest-2019 Conference

    app https://github.com/NileshGule/spring-boot-conference-app/tree/mssql-server https://speakerdeck.com/nileshgule/ https://www.slideshare.net/nileshgule/
  8. Nilesh Gule ARCHITECT | MICROSOFT MVP “Code with Passion and

    Strive for Excellence” nileshgule @nileshgule Nilesh Gule NileshGule www.handsonarchitect.com https://bit.ly/youtube-nileshgule