Upgrade to Pro — share decks privately, control downloads, hide ads and more …

Monitoring Kubernetes with Prometheus and Grafana

Monitoring Kubernetes with Prometheus and Grafana

Slidedeck is related to the presentation done for Microsoft Reactor Bengaluru about Monitoring Kubernetes with Prometheus and Grafana on 14 August 2021.
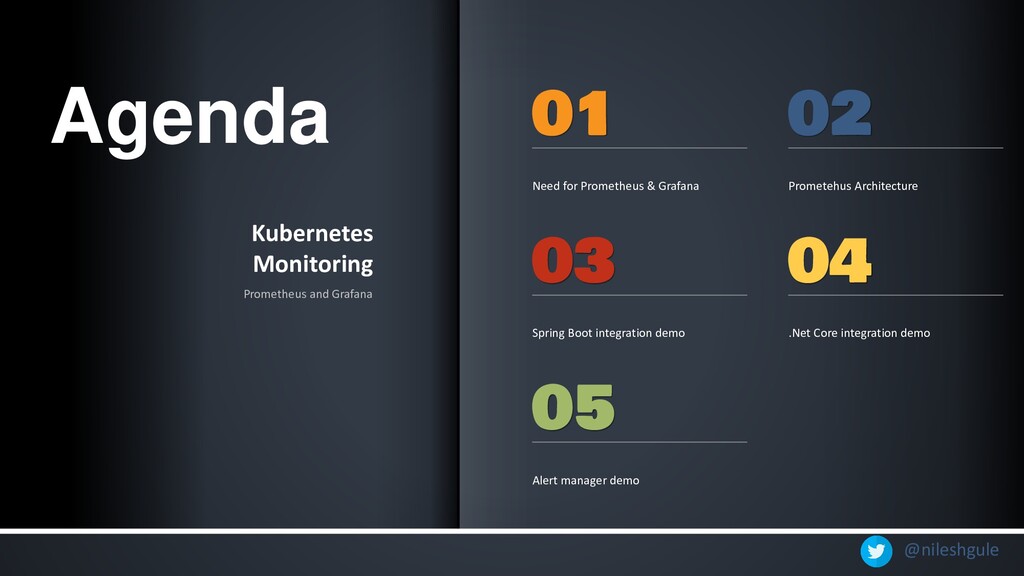
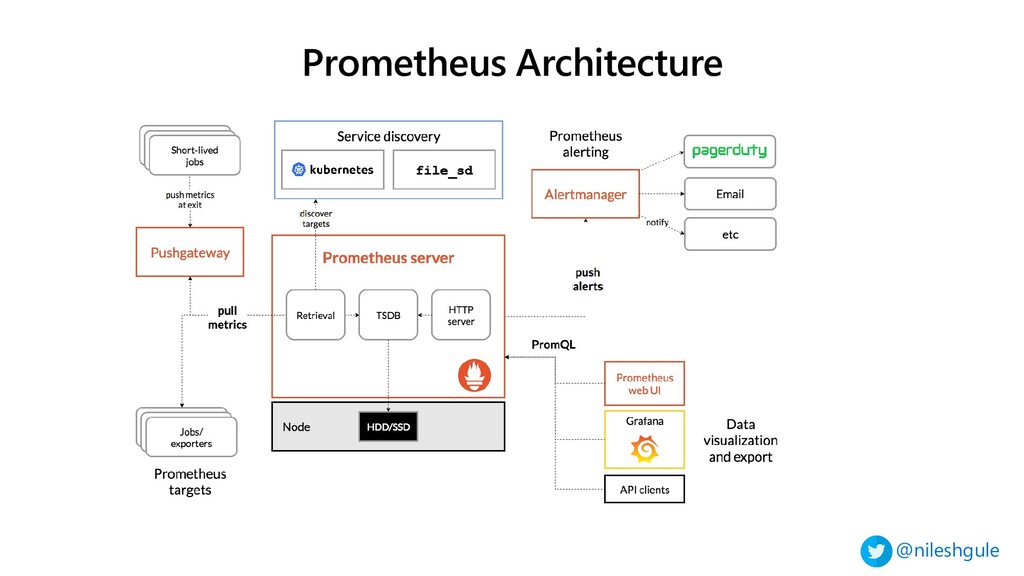
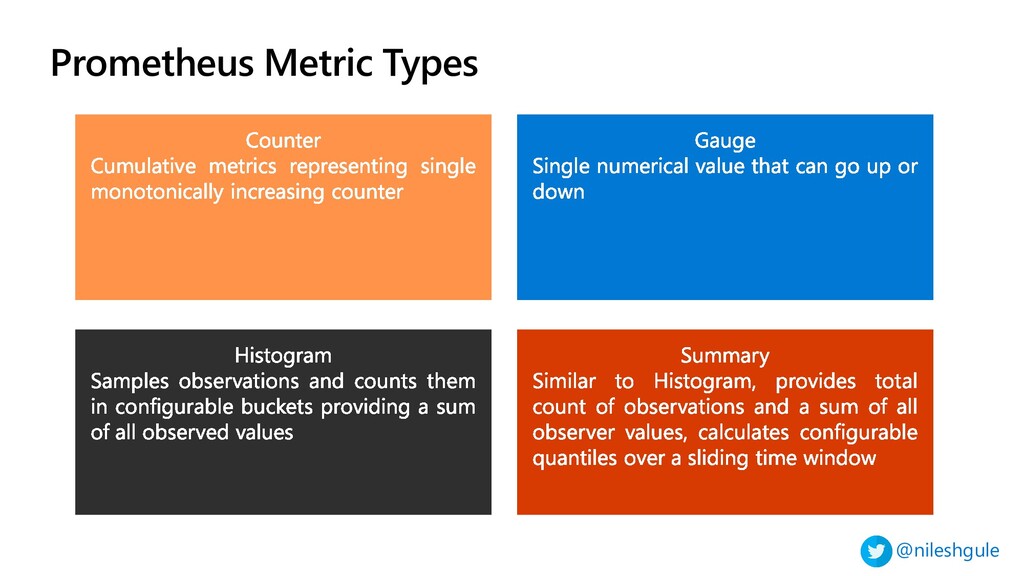
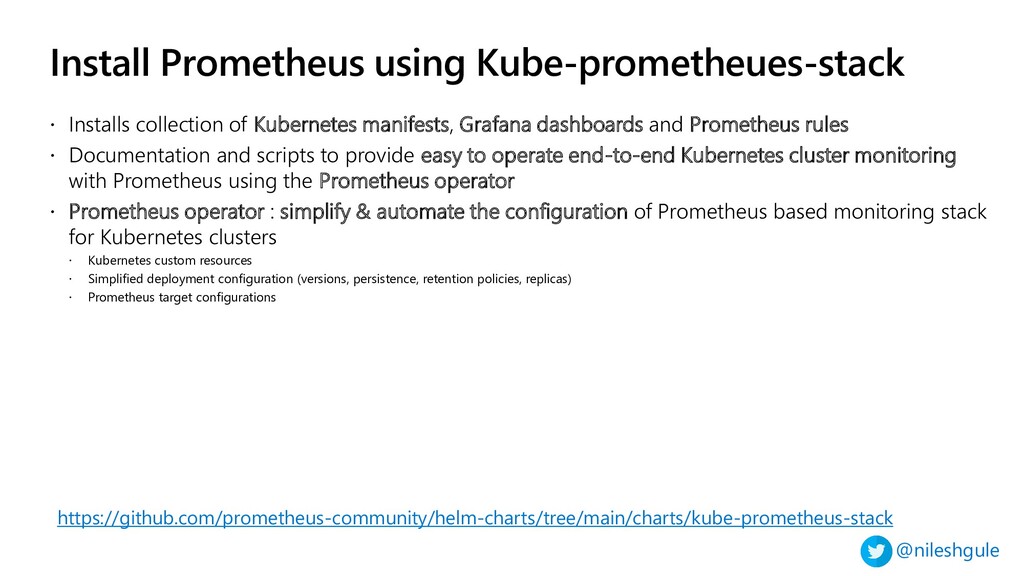
Covered Prometheus Architecture, installation using Prometheus operator, Service Monitor, Pod Monitor, Alert rules.

Youtube video link : https://youtu.be/Lv0D3fdwJhU

Nilesh Gule

August 14, 2021
Tweet

More Decks by Nilesh Gule

Other Decks in Technology

Transcript

  1. $whoami { “name” : “Nilesh Gule”, “website” : “https://www.HandsOnArchitect.com", “github”

    : “https://GitHub.com/NileshGule" “twitter” : “@nileshgule”, “linkedin” : “https://www.linkedin.com/in/nileshgule”, “likes” : “Technical Evangelism, Cricket”, “co-organizer” : “Azure Singapore UG” }
  2. @nileshgule Kubernetes Monitoring Prometheus and Grafana Need for Prometheus &

    Grafana Prometehus Architecture Spring Boot integration demo .Net Core integration demo Alert manager demo Agenda
  3. Pre-requisites • Self contained application with all its dependencies Docker

    • Orchestrates containers • Self healing • Service discovery • Scaling Kubernetes • Dockerhub / private container registry • Repository for storing container images Container Registry • Managed Kubernetes service on Azure • Native integration with other Azure services like Azure Active Directory (AAD), Azure Container registry (ACR), Azure Container Instances (ACI), Azure Monitor etc. Azure Kubernetes Service (AKS)
  4. @nileshgule Install Prometheus using Kube-prometheues-stack https://github.com/prometheus-community/helm-charts/tree/main/charts/kube-prometheus-stack  Installs collection of

    Kubernetes manifests, Grafana dashboards and Prometheus rules  Documentation and scripts to provide easy to operate end-to-end Kubernetes cluster monitoring with Prometheus using the Prometheus operator  Prometheus operator : simplify & automate the configuration of Prometheus based monitoring stack for Kubernetes clusters  Kubernetes custom resources  Simplified deployment configuration (versions, persistence, retention policies, replicas)  Prometheus target configurations
  5. @nileshgule TechTalks Demo setup 1000 (configurable) messages Batch of 50

    (configurable) messages https://github.com/NileshGule/pd-tech-fest-2019
  6. Summary • Modern day cloud native applications need new ways

    of monitoring • Prometheus provides easy to use metrics for platforms, applications • Use service monitor to scrape metrics for Kubernetes service • Use pod monitor to scrape metrics for Kubernetes pods • Grafana provides visualization capabilities to build intuitive dashboards • Alert Manager provides alerting capabilities based on Prometheus queries / expressions
  7. Prometheus.io Grafana.com Kube Prometheus Stack Prometheus operator Houssem Dellai –

    Prometheus & Grafana for monitoring Kubernetes Tech world with Nana Prometheus debugging
  8. Thank you very much Code with Passion and Strive for

    Excellence https://www.slideshare.net/nileshgule/presentations https://speakerdeck.com/nileshgule/
  9. Nilesh Gule ARCHITECT | MICROSOFT MVP “Code with Passion and

    Strive for Excellence” nileshgule @nileshgule Nilesh Gule NileshGule www.handsonarchitect.com
  10. Q&A