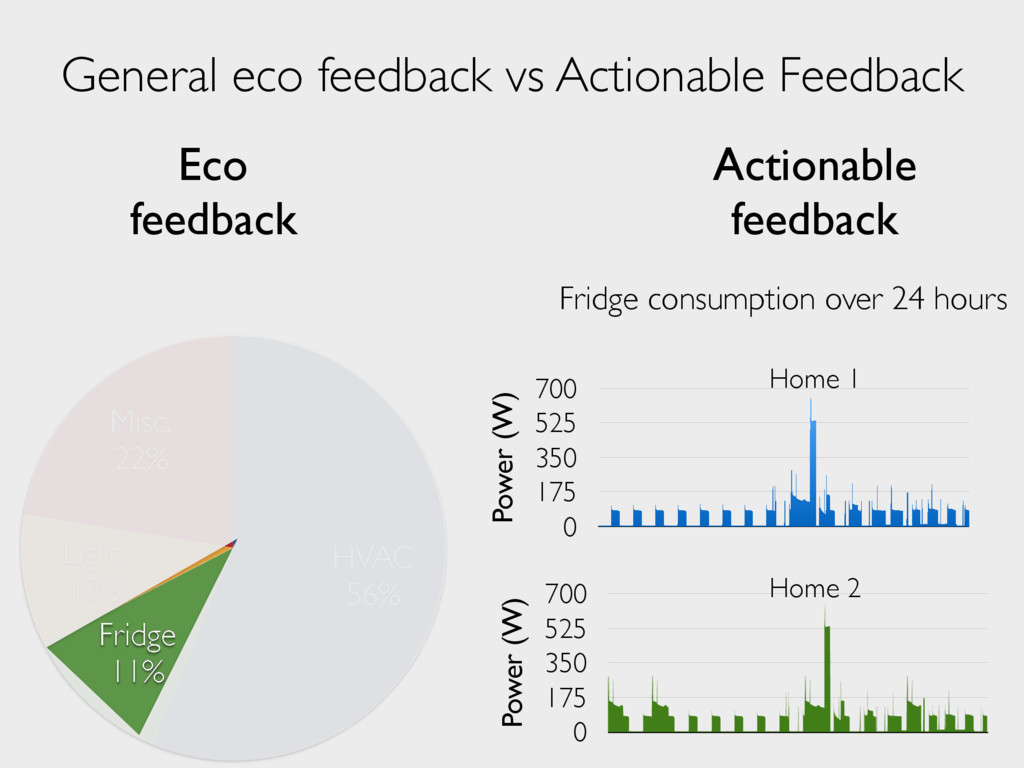
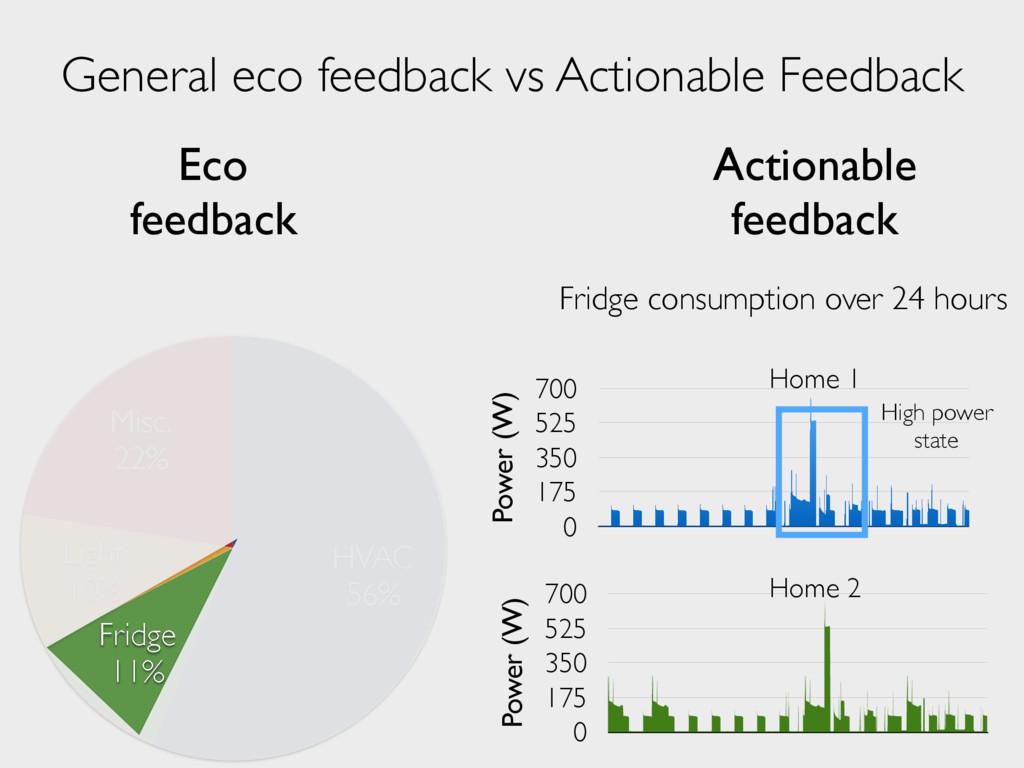
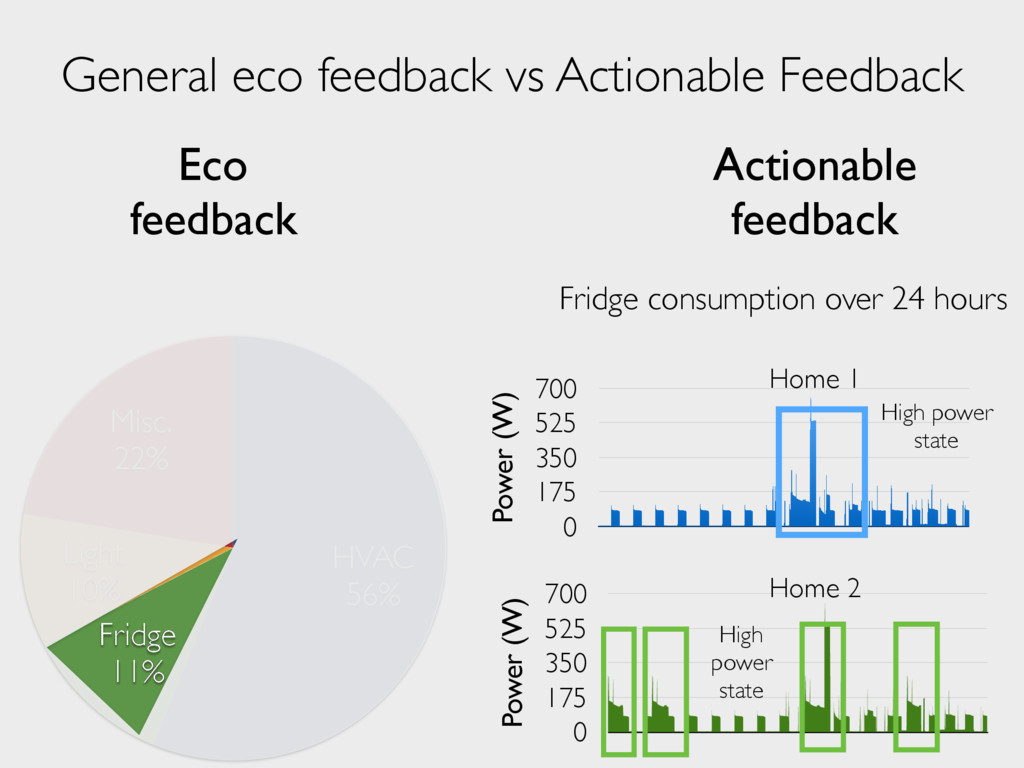
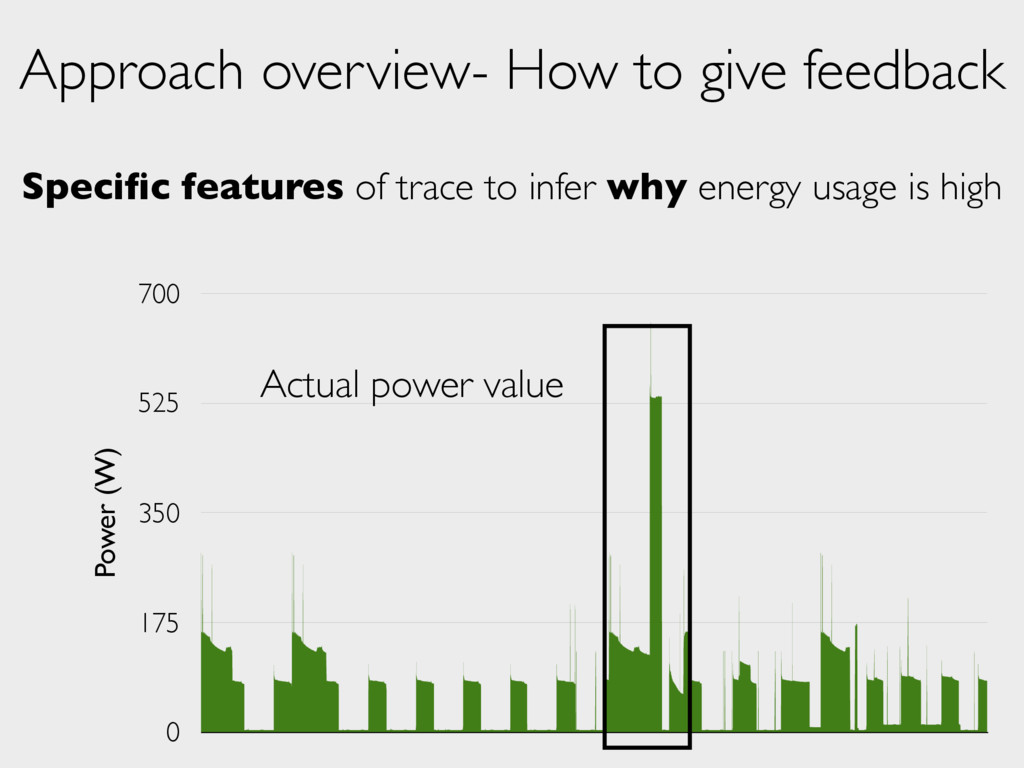
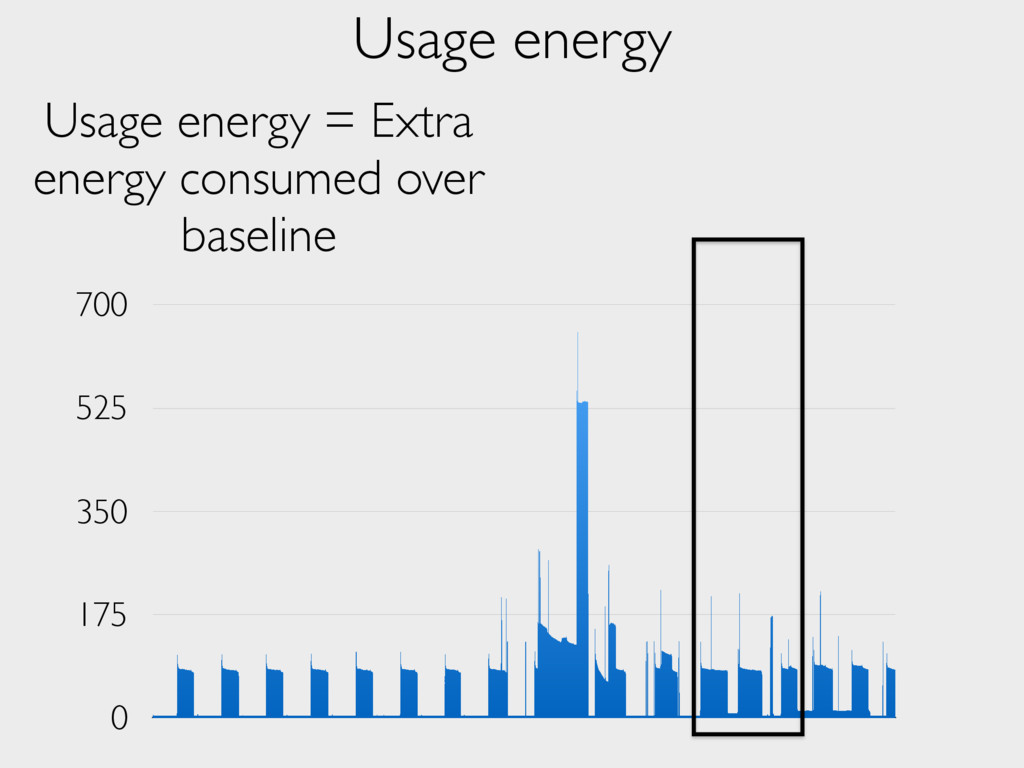
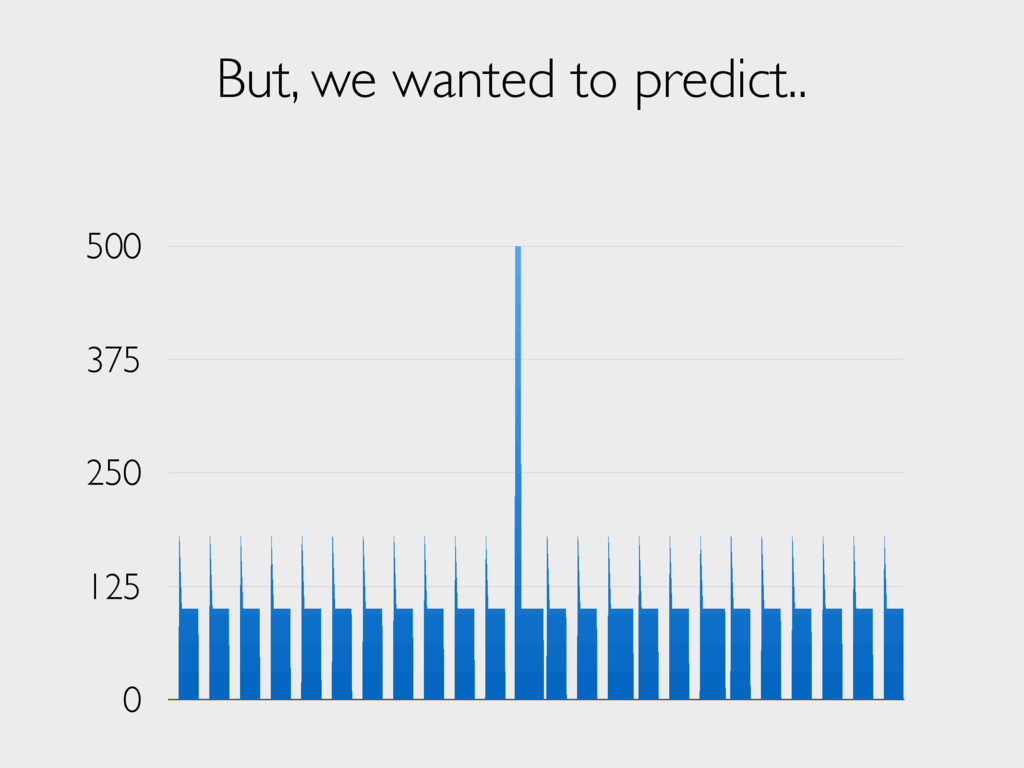
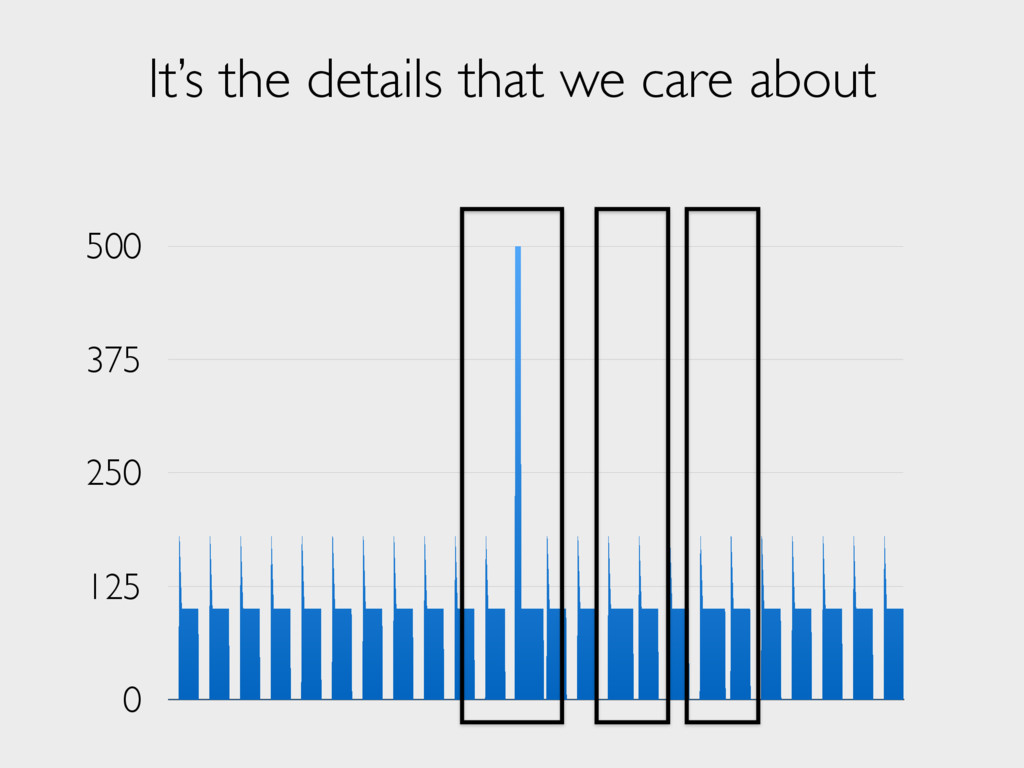
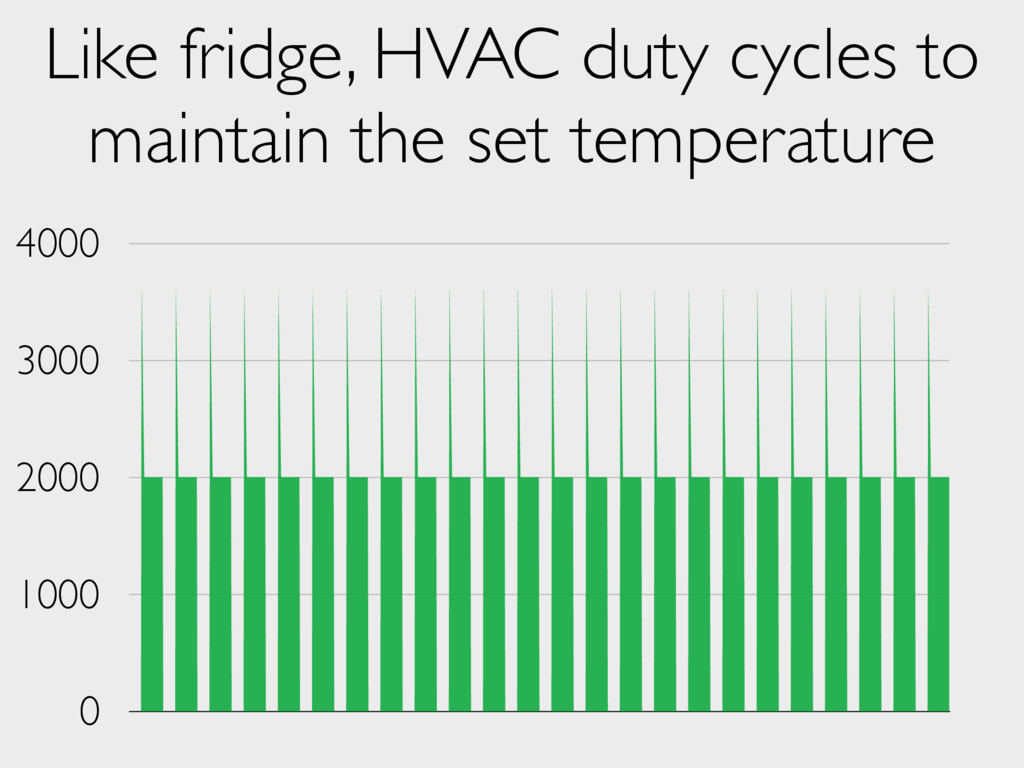
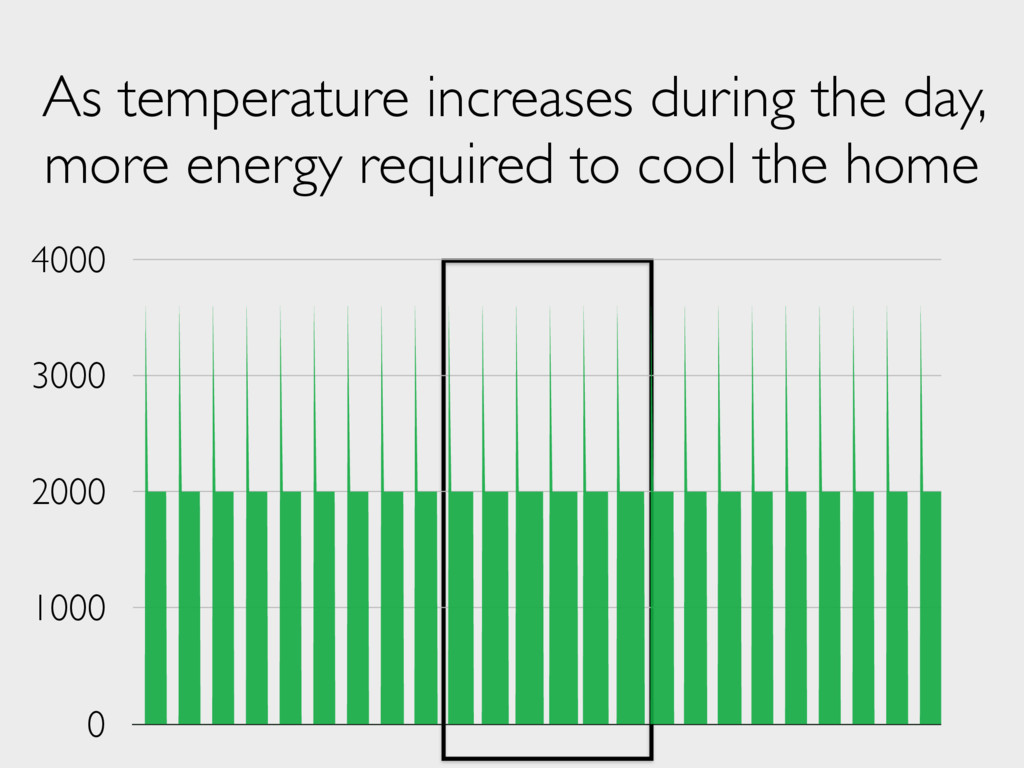
Light 10% Fridge 11% HVAC 56% Power (W) 0 175 350 525 700 Power (W) 0 175 350 525 700 Home 1 Home 2 Actionable feedback Fridge consumption over 24 hours Misc. 22% Light 10% Fridge 11% HVAC 56% High power state High power state
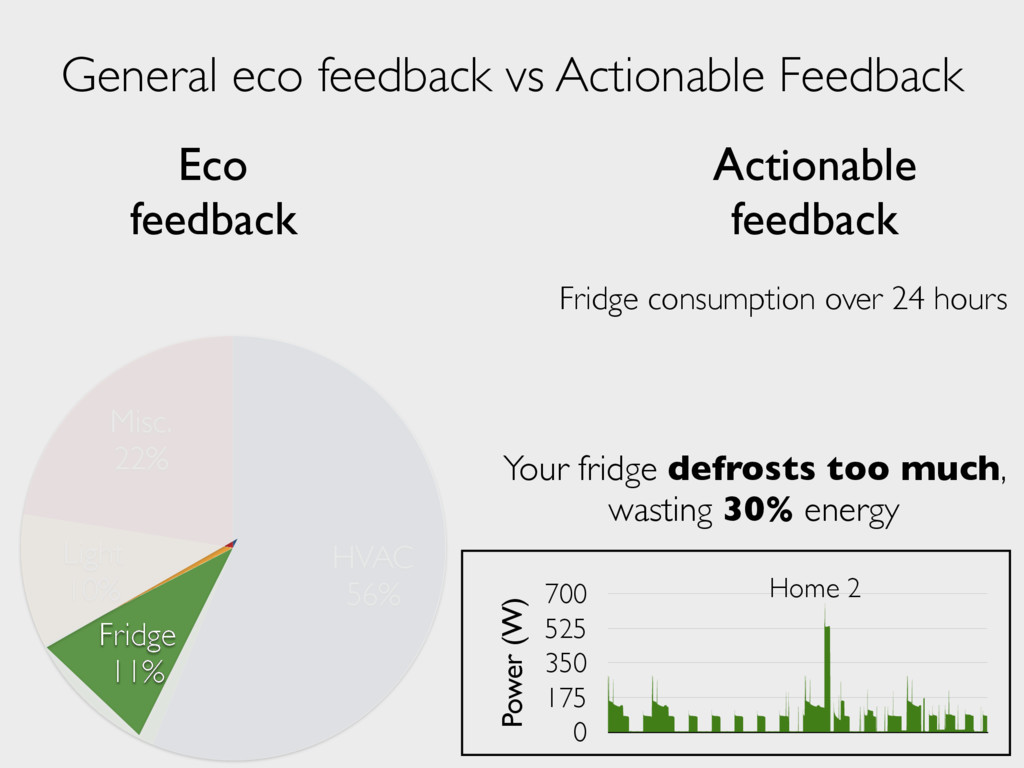
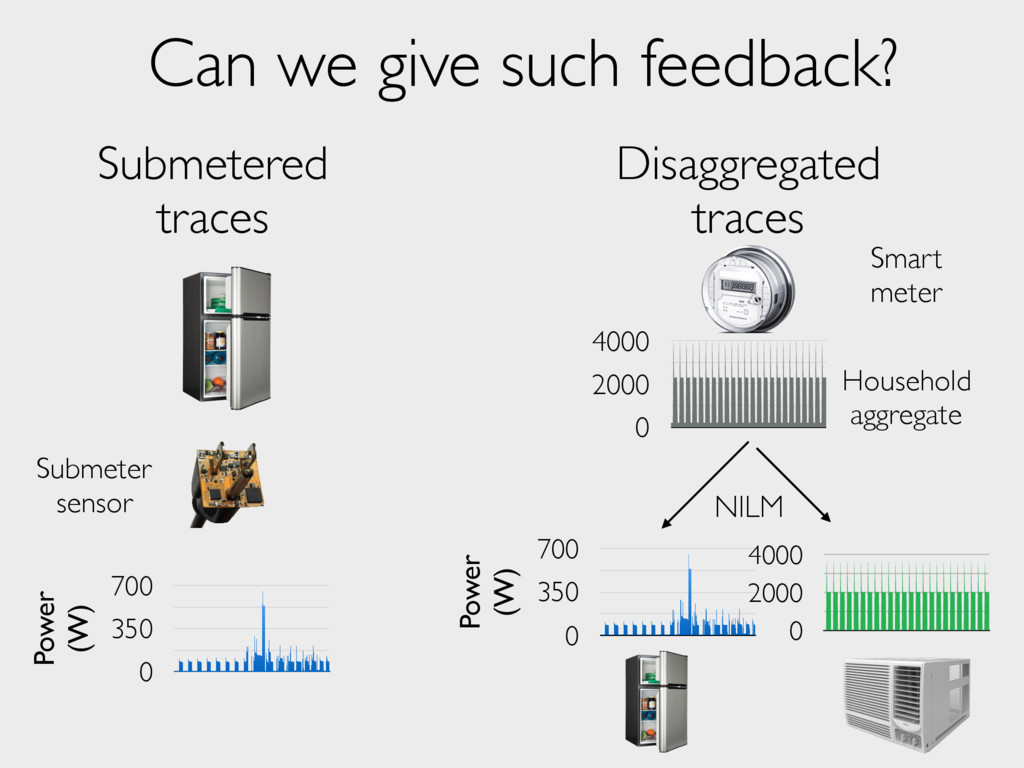
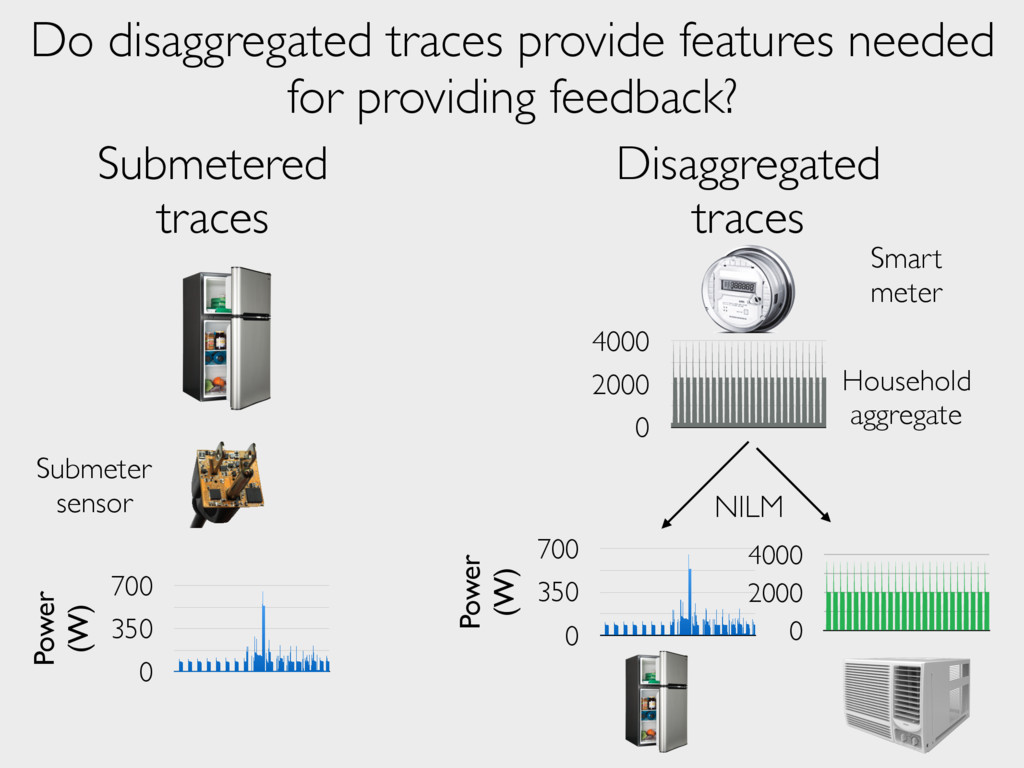
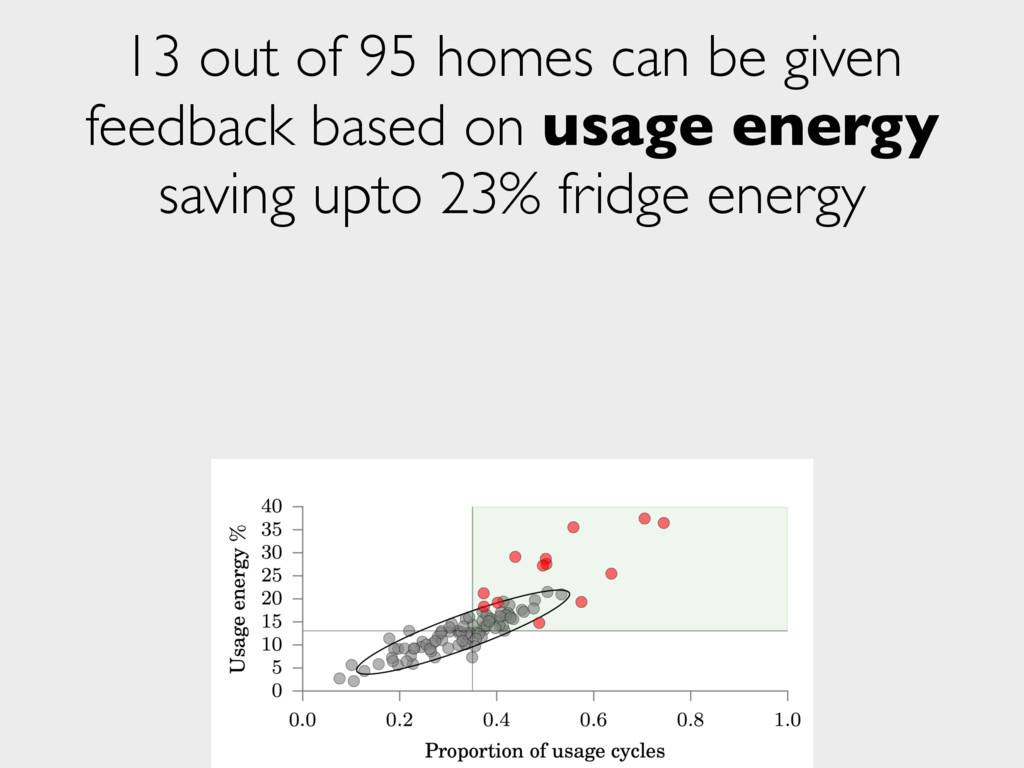
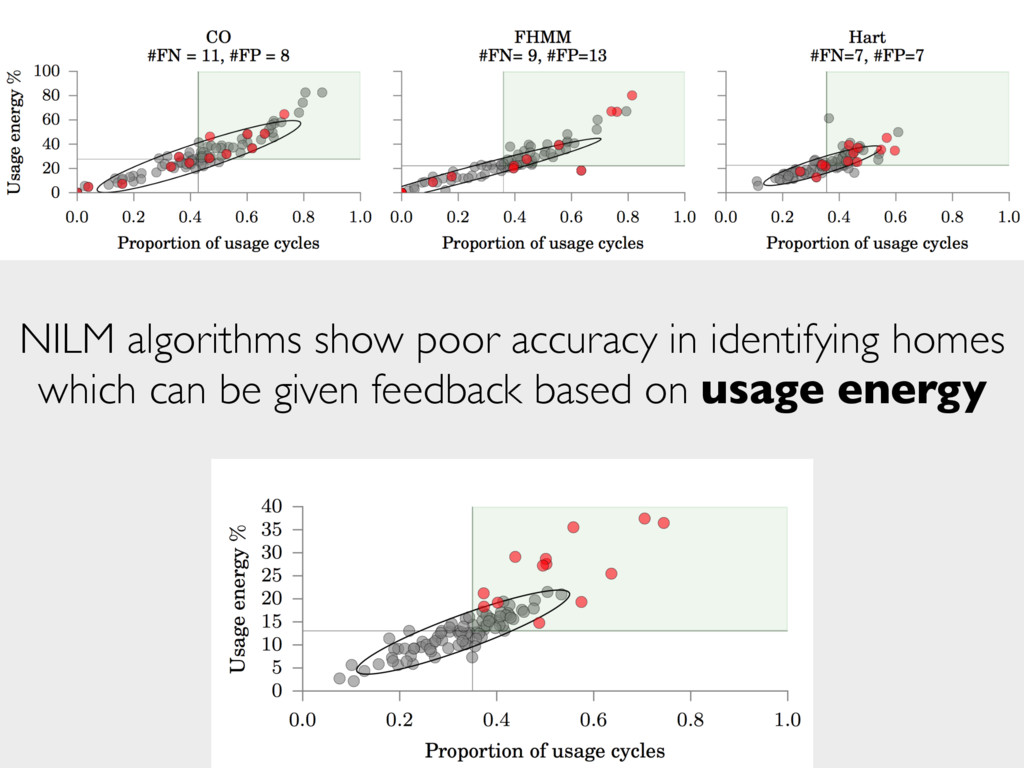
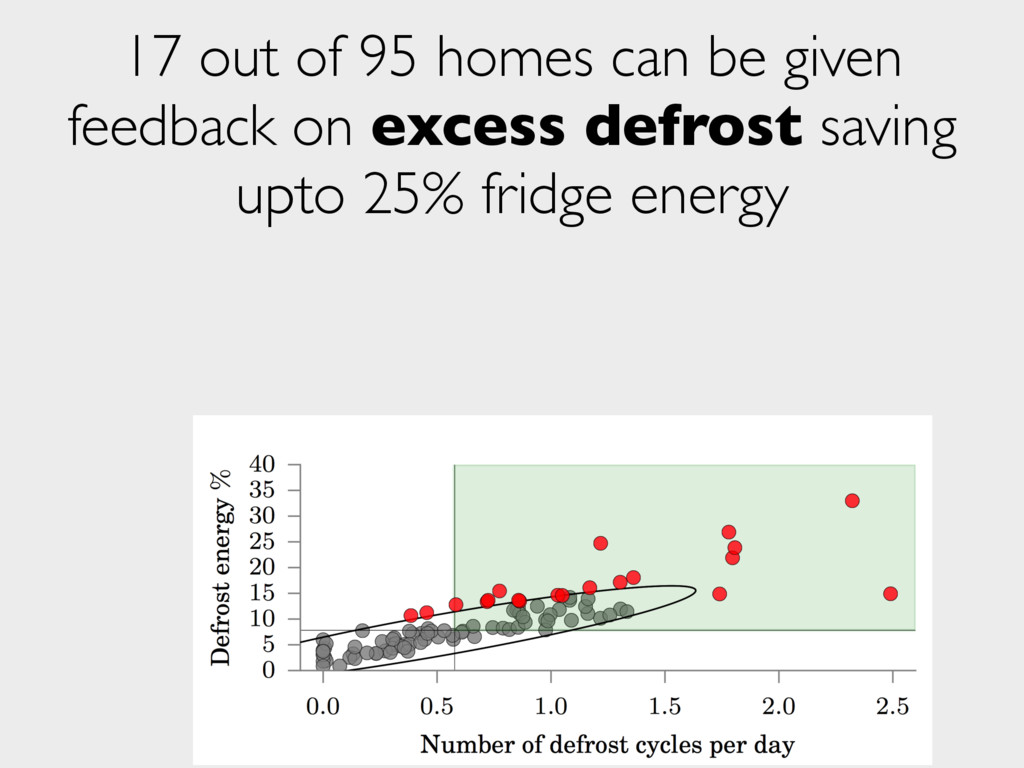
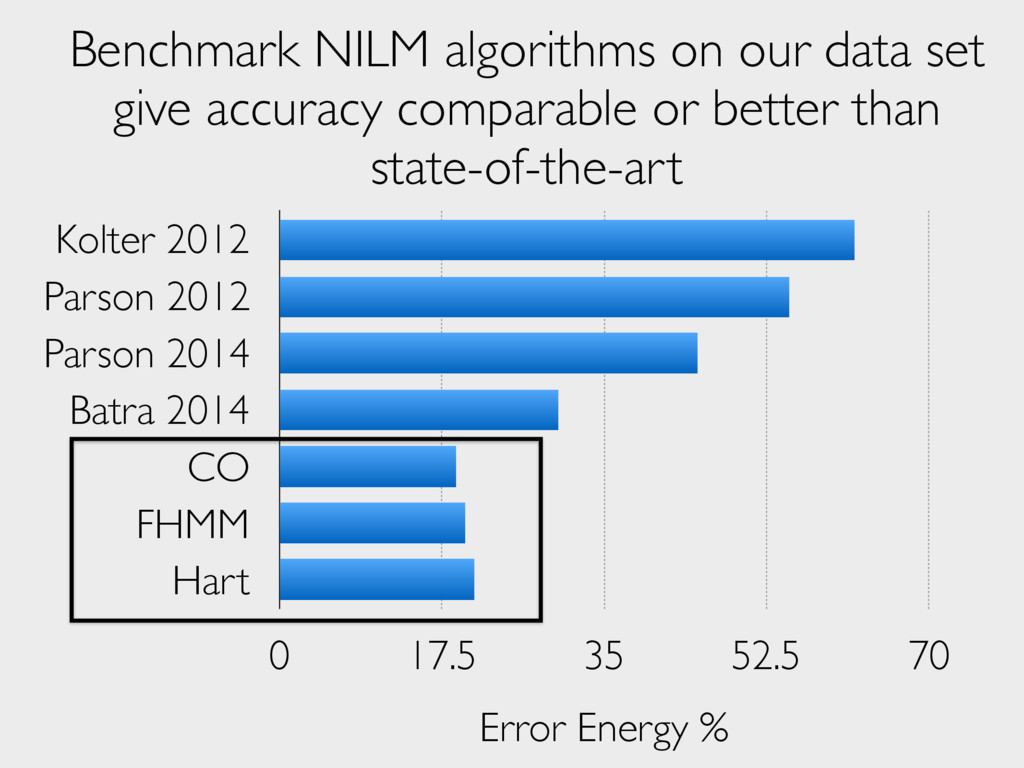
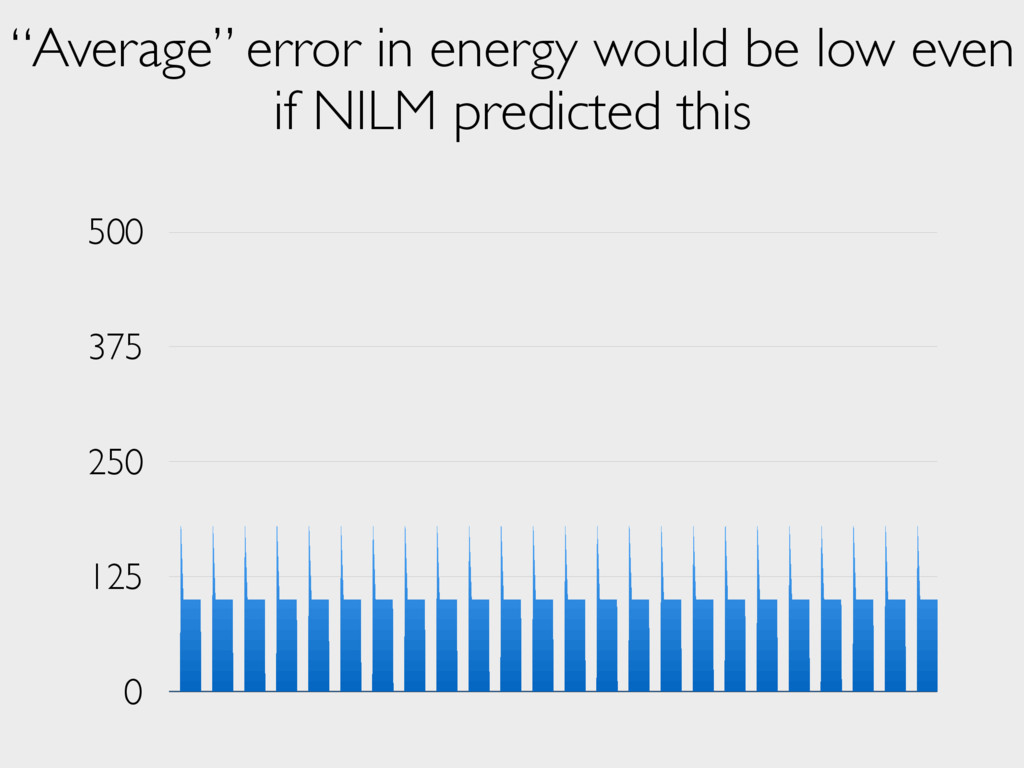
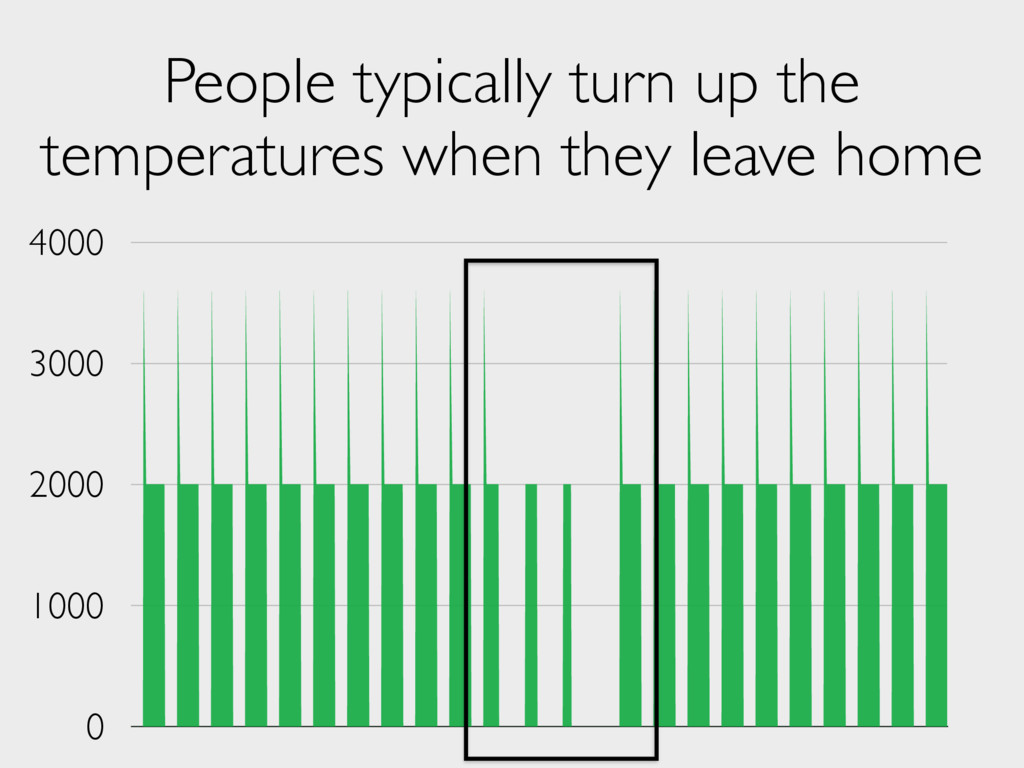
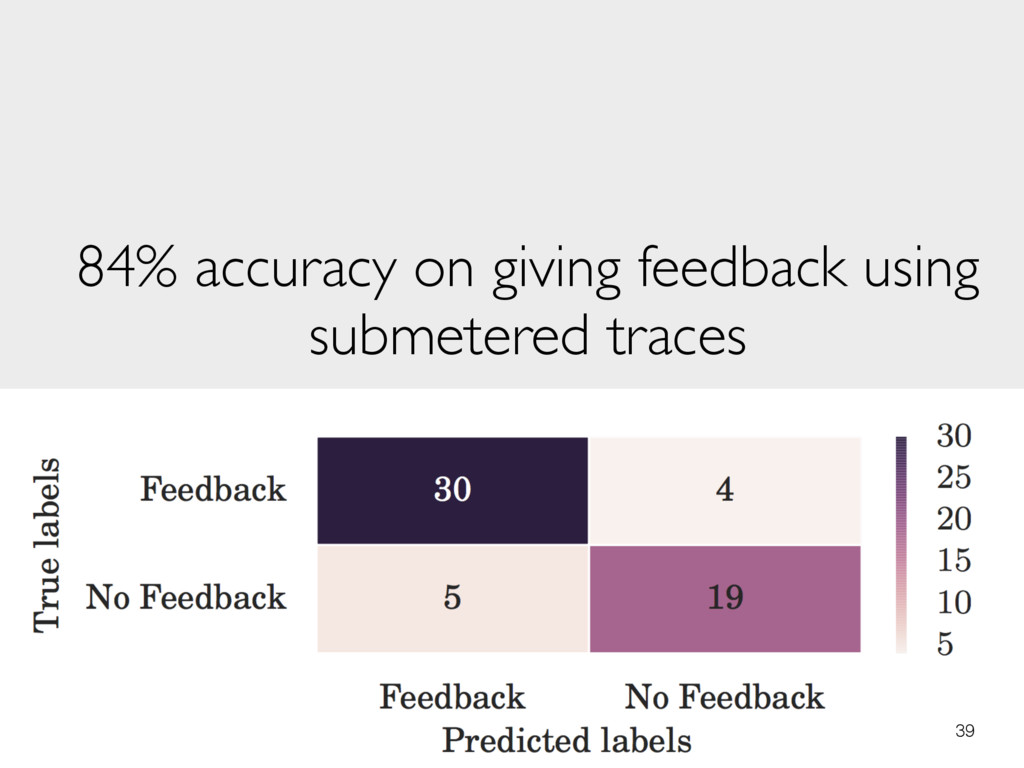
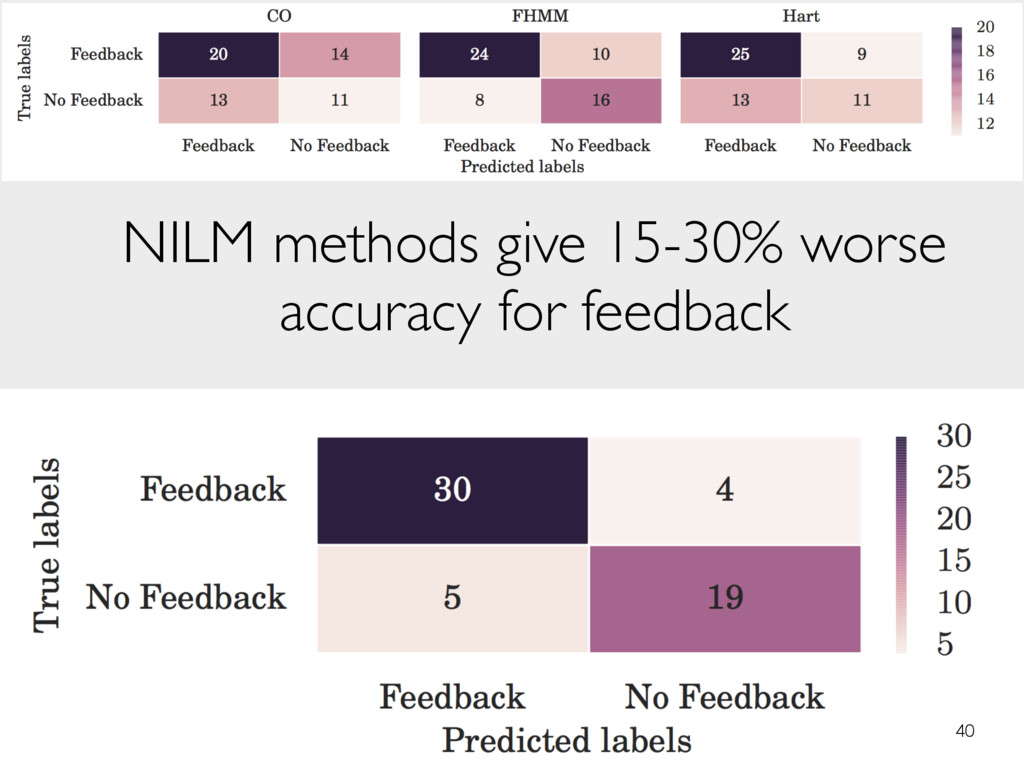
on usage energy saving upto 23% fridge energy NILM algorithms show poor accuracy in identifying homes which can be given feedback based on usage energy