Upgrade to Pro — share decks privately, control downloads, hide ads and more …

How to add D3.js visualization to your Ext JS application

Olga
October 12, 2016

How to add D3.js visualization to your Ext JS application

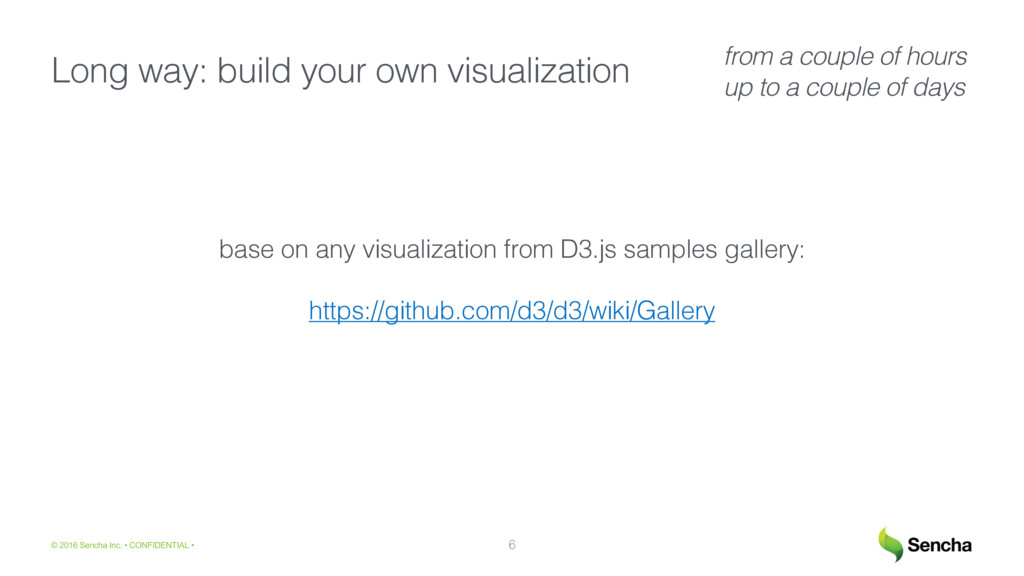
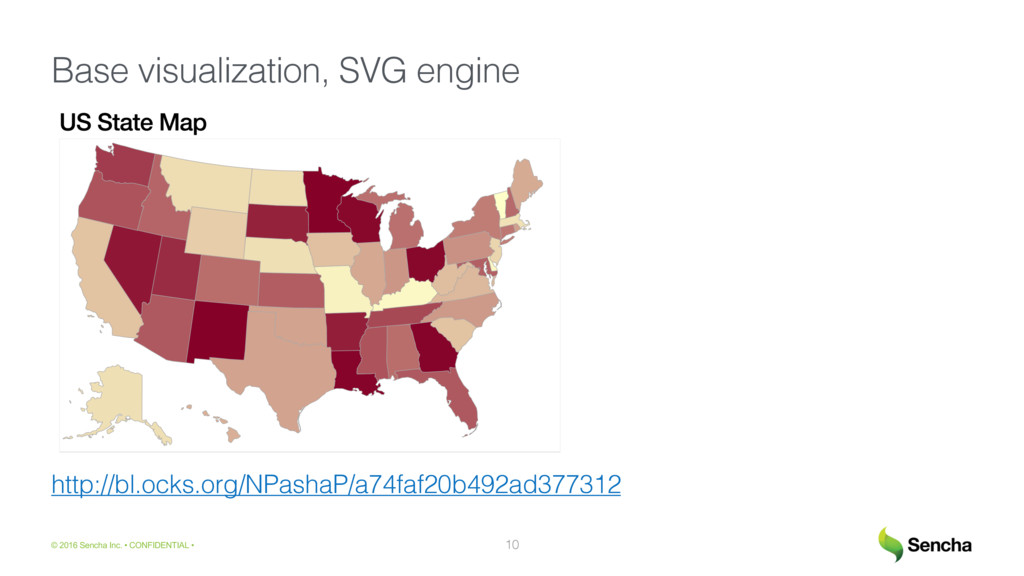
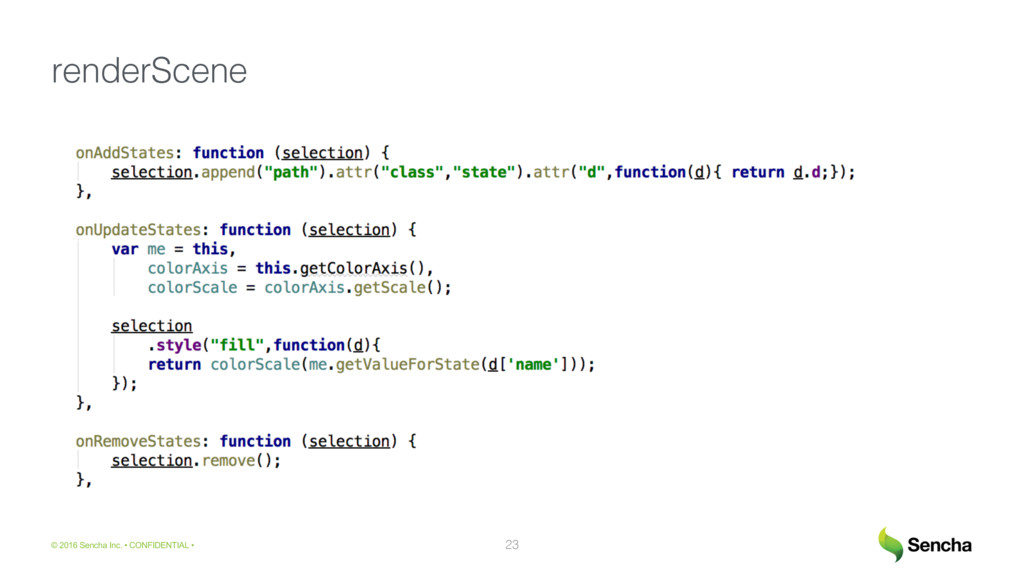
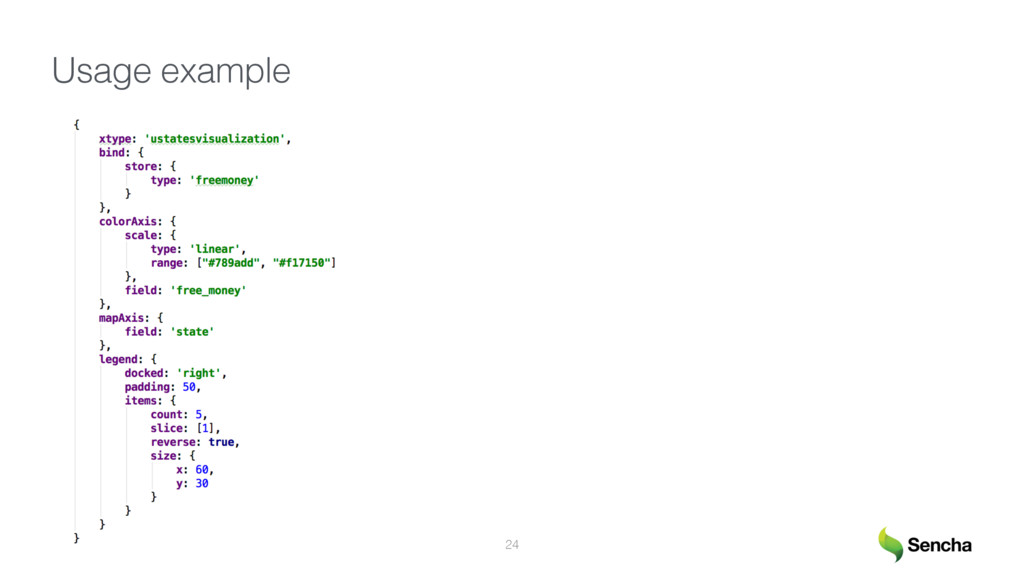
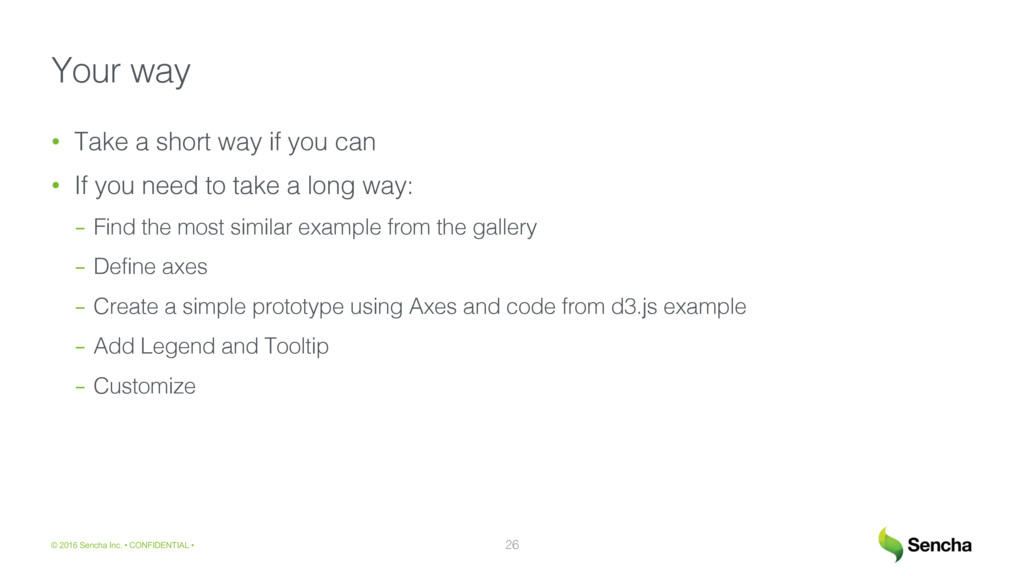
In my session I cover technical details of integration of D3.js visualization into Ext JS application using D3.js adapter. I will show how you could easily customize visualizations available out-of-box as well as integrate a custom visualization from D3.js sample gallery

Olga

October 12, 2016
Tweet

More Decks by Olga

Other Decks in Programming

Transcript

  1. ©  2016  Sencha  Inc.  • CONFIDENTIAL  • How to add

    D3.js visualization to your Ext JS application Olga Petrova Sales Engineer @ Sencha
  2. ©  2016  Sencha  Inc.  • CONFIDENTIAL  • Short way: use

    build-in visualizations • Tree • Treemap • Pack • Sunburst • Heatmap 5 from 10 minutes
  3. ©  2016  Sencha  Inc.  • CONFIDENTIAL  • Long way: build

    your own visualization base on any visualization from D3.js samples gallery: https://github.com/d3/d3/wiki/Gallery 6 from a couple of hours up to a couple of days
  4. ©  2016  Sencha  Inc.  • CONFIDENTIAL  • Build-in visualization: Tree

    7 Component “xtype” Store width & height Styling Interactions Tooltip Platform-specific Styling
  5. ©  2016  Sencha  Inc.  • CONFIDENTIAL  • Custom visualization: steps

    8 • Choose the base visualization • Choose an engine: SVG or Canvas • Define data requirements: flat or hierarchical data, fields • Define axes: xAxis, yAxis, colorAxis, customAxis... • Define Legend requirements • Define Tooltip
  6. ©  2016  Sencha  Inc.  • CONFIDENTIAL  • Base visualization, SVG

    engine http://bl.ocks.org/NPashaP/a74faf20b492ad377312 10
  7. ©  2016  Sencha  Inc.  • CONFIDENTIAL  • Data requirements 11

    • Flat Store: Ext.data.Store • “state” field and “value” field
  8. ©  2016  Sencha  Inc.  • CONFIDENTIAL  • Axes 12 •

    mapAxis: “state” field • colorAxis: “value” field
  9. ©  2016  Sencha  Inc.  • CONFIDENTIAL  • Legend 13 •

    Color ticks • Associated values with formatting
  10. ©  2016  Sencha  Inc.  • CONFIDENTIAL  • Visualization config 16

    • get • set • apply • update Provided Methods:
  11. ©  2016  Sencha  Inc.  • CONFIDENTIAL  • renderScene 22 property

    contains SVG paths for states states SVG elements render states SVG elements position Legend
  12. ©  2016  Sencha  Inc.  • CONFIDENTIAL  • Your way 26

    • Take a short way if you can • If you need to take a long way: - Find the most similar example from the gallery - Define axes - Create a simple prototype using Axes and code from d3.js example - Add Legend and Tooltip - Customize
  13. ©  2016  Sencha  Inc.  • CONFIDENTIAL  • D3.js adapter offers

    27 • Ready-to-use visualization components • Base and utility classes (Axis, Legend, Tooltip) to create your of custom visualization
  14. ©  2016  Sencha  Inc.  • CONFIDENTIAL  • Source code 28

    https://github.com/olga-petrova/SenchaMeetup