Upgrade to Pro — share decks privately, control downloads, hide ads and more …

Turbo-charged Data Analysis and Visualization using Ext JS 6.2

Olga
September 20, 2016

Turbo-charged Data Analysis and Visualization using Ext JS 6.2

The presentation shows how to visualize and analyze large datasets using Ext JS Grid, Pivot Grid, Charts, and D3 adapter.

Olga

September 20, 2016
Tweet

More Decks by Olga

Other Decks in Programming

Transcript

  1. View Slide

  2. ©  2016  Sencha  Inc.  • CONFIDENTIAL  •
    Turbo-charged Data Analysis
    and Visualization using Ext JS 6.2
    Olga Petrova
    Sales Engineer

    View Slide

  3. ©  2016  Sencha  Inc.  • CONFIDENTIAL  •
    “Without data you’re just
    another person with an opinion.”
    W. Edwards Deming

    View Slide

  4. ©  2016  Sencha  Inc.  • CONFIDENTIAL  •
    Data Science is a top trend

    View Slide

  5. ©  2016  Sencha  Inc.  • CONFIDENTIAL  •
    Best job in USA
    5

    View Slide

  6. ©  2016  Sencha  Inc.  • CONFIDENTIAL  •
    Huge demand for Data Scientists
    6

    View Slide

  7. ©  2016  Sencha  Inc.  • CONFIDENTIAL  •
    Huge amount for Data Science courses
    7

    View Slide

  8. ©  2016  Sencha  Inc.  • CONFIDENTIAL  •
    UI disadvantages of popular solutions
    • Performance problems by visualization of huge datasets
    • Pure user interactions
    • Difficult customization
    • Difficult integration with current applications
    8

    View Slide

  9. ©  2016  Sencha  Inc.  • CONFIDENTIAL  •
    Advantages of Ext JS UI
    • Robust out-of-box components for visualization of data analysis results
    • Optimized for huge datasets, extreme performance
    • Easy customization and integration with current applications
    9

    View Slide

  10. ©  2016  Sencha  Inc.  • CONFIDENTIAL  •
    Sample application

    View Slide

  11. ©  2016  Sencha  Inc.  • CONFIDENTIAL  •
    Use case data
    American Community Survey 2013
    www.census.gov/programs-surveys/acs
    11

    View Slide

  12. ©  2016  Sencha  Inc.  • CONFIDENTIAL  •
    Use case data
    • 2.276.839 people and 1.476.313 houses
    • People: state, sex, incomes, education, industry, occupation, working hours, etc.
    • Houses: state, type of house, property value, total household’s income, rent,
    owner costs, etc.
    12

    View Slide

  13. ©  2016  Sencha  Inc.  • CONFIDENTIAL  •
    Main question:
    “Where should I live?”

    View Slide

  14. ©  2016  Sencha  Inc.  • CONFIDENTIAL  •
    “Income after housing” concept
    [Income after housing] =
    [Total income] - [Expenses for a house]

    View Slide

  15. ©  2016  Sencha  Inc.  • CONFIDENTIAL  •
    Application functionality
    • Display of original data sources
    • Display of data analysis results: highlight hidden trends and insides
    • Data visualization
    15

    View Slide

  16. ©  2016  Sencha  Inc.  • CONFIDENTIAL  •
    Data sources
    Problem
    How to show a grid with more than 1 Million rows?
    16

    View Slide

  17. ©  2016  Sencha  Inc.  • CONFIDENTIAL  •
    Data sources
    Possible solutions
    • Load dataset in a browser: at least 6 Million DOM elements (for 5 columns)
    • Use pagination: 1000 pages if page size is 1000
    17

    View Slide

  18. ©  2016  Sencha  Inc.  • CONFIDENTIAL  •
    Data sources
    Ext JS Solution
    • Ext JS Grid with buffered rendering: only part of the dataset is rendered at a time
    • Ext Speeder backend: server-side smart cache
    18

    View Slide

  19. ©  2016  Sencha  Inc.  • CONFIDENTIAL  •
    Data Sources: Houses Grid
    19

    View Slide

  20. ©  2016  Sencha  Inc.  • CONFIDENTIAL  •
    Data sources
    Result
    • Extreme performance
    • Real-time Big Data
    • Filtering and sorting are supported
    20

    View Slide

  21. ©  2016  Sencha  Inc.  • CONFIDENTIAL  •
    Data analysis
    Problem
    How to aggregate data to highlight hidden trends and insides?
    21

    View Slide

  22. ©  2016  Sencha  Inc.  • CONFIDENTIAL  •
    Data analysis
    Possible 
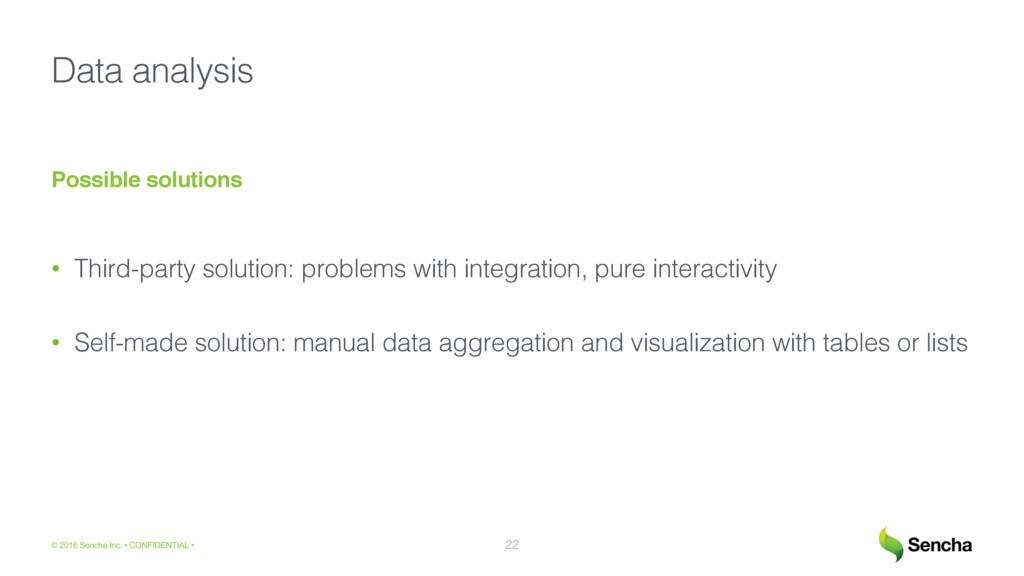
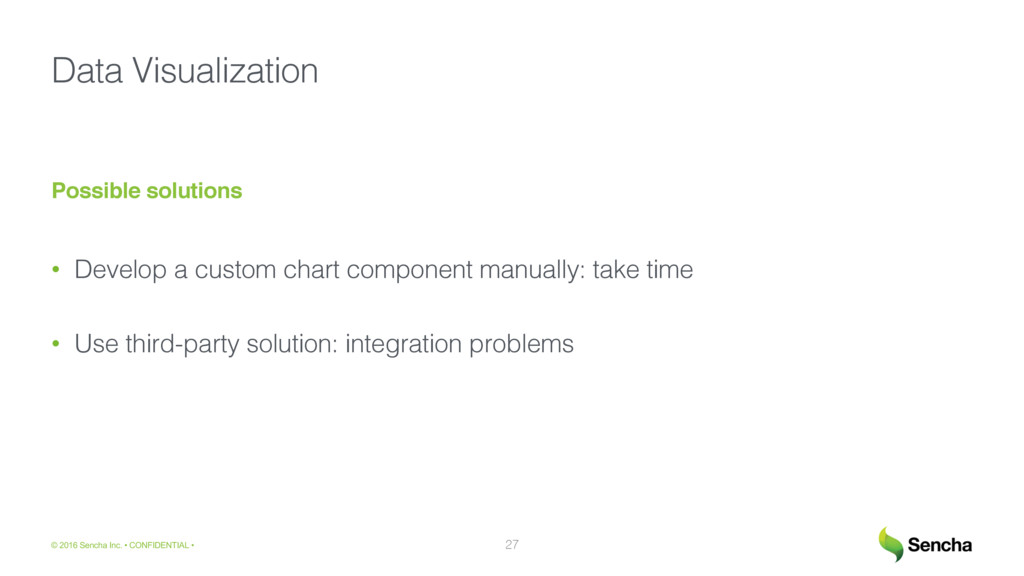
solutions
    • Third-party solution: problems with integration, pure interactivity
    • Self-made solution: manual data aggregation and visualization with tables or lists
    22

    View Slide

  23. ©  2016  Sencha  Inc.  • CONFIDENTIAL  •
    Ext JS Solution
    Sencha Pivot Grid: aggregate data per several dimensions and highlight hidden
    trends and insides
    23
    Data analysis

    View Slide

  24. ©  2016  Sencha  Inc.  • CONFIDENTIAL  •
    “Income after housing” Pivot Grid
    24

    View Slide

  25. ©  2016  Sencha  Inc.  • CONFIDENTIAL  •
    Data analysis
    Result
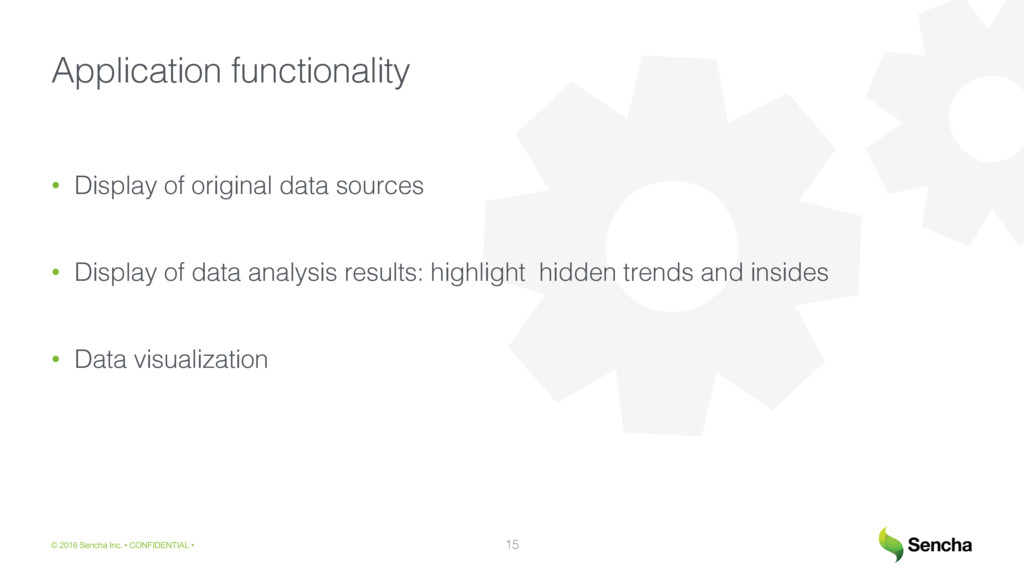
    • Out-of-box solution for display of data analysis results
    • Easy highlighting of hidden trends and insides
    • Custom data aggregation
    • Local and remote calculations
    25

    View Slide

  26. ©  2016  Sencha  Inc.  • CONFIDENTIAL  •
    Data Visualization
    Problem
    How to create a custom high-performance visualization
    with rich user interactions?
    26

    View Slide

  27. ©  2016  Sencha  Inc.  • CONFIDENTIAL  •
    Data Visualization
    Possible solutions
    • Develop a custom chart component manually: take time
    • Use third-party solution: integration problems
    27

    View Slide

  28. ©  2016  Sencha  Inc.  • CONFIDENTIAL  •
    Data Visualization
    Ext JS Solution
    • D3.js adapter
    • Sencha Charts
    28

    View Slide

  29. ©  2016  Sencha  Inc.  • CONFIDENTIAL  •
    Data Visualization: out-of-box visualization
    29

    View Slide

  30. ©  2016  Sencha  Inc.  • CONFIDENTIAL  •
    Data Visualization: custom visualization
    30

    View Slide

  31. ©  2016  Sencha  Inc.  • CONFIDENTIAL  •
    Data Visualization: custom visualization
    31

    View Slide

  32. ©  2016  Sencha  Inc.  • CONFIDENTIAL  •
    Data Visualization
    Result
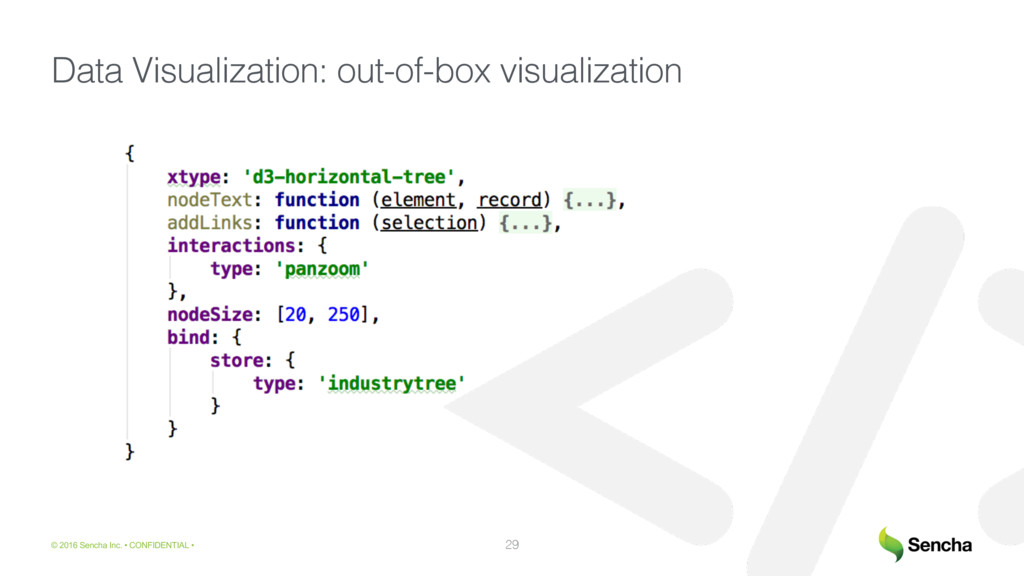
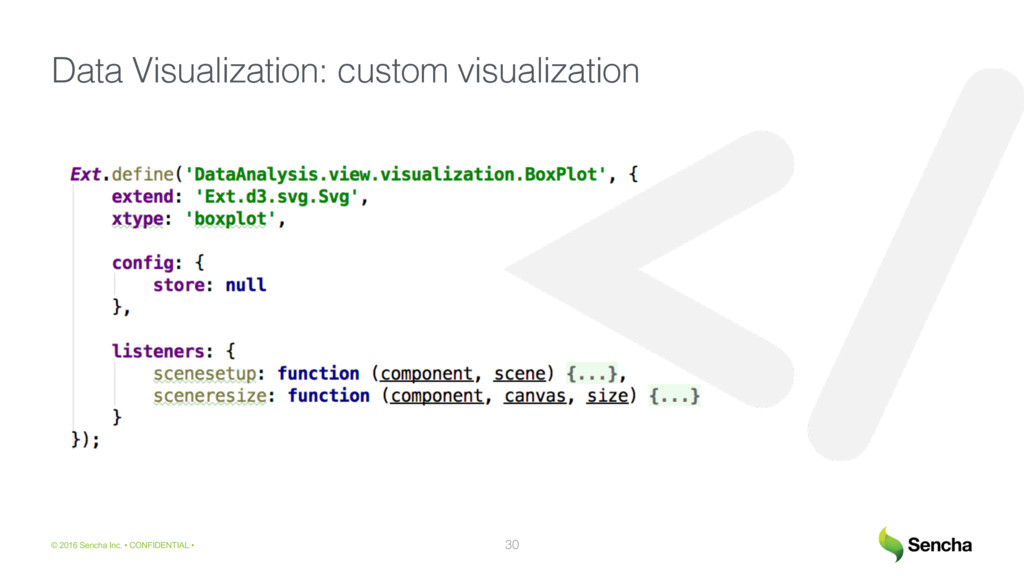
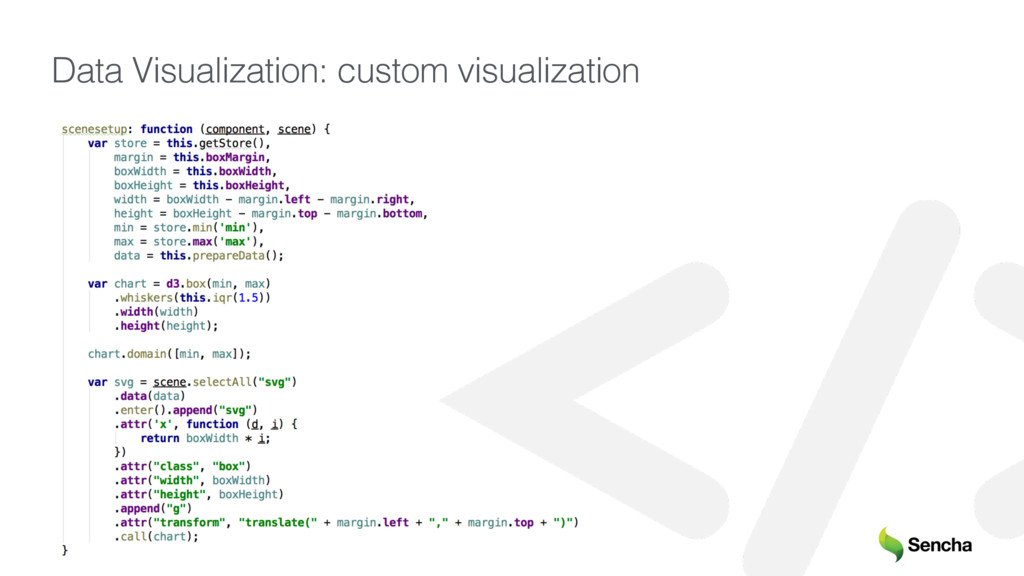
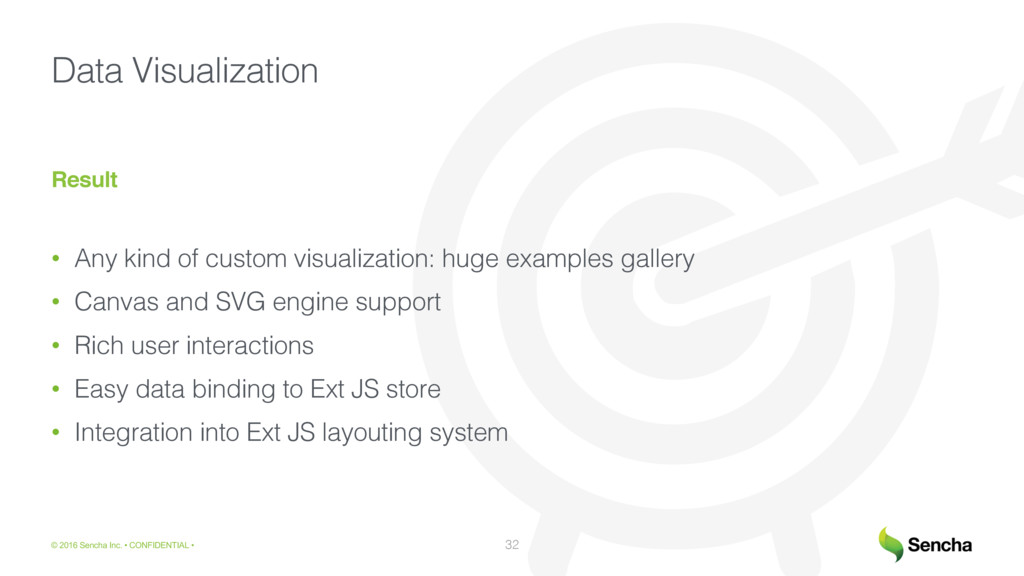
    • Any kind of custom visualization: huge examples gallery
    • Canvas and SVG engine support
    • Rich user interactions
    • Easy data binding to Ext JS store
    • Integration into Ext JS layouting system
    32

    View Slide

  33. ©  2016  Sencha  Inc.  • CONFIDENTIAL  •
    Used Ext JS components
    • Ext JS Buffered Grid
    • Ext Speeder back-end
    • Ext JS Pivot Grid
    • D3.js Adapter

    View Slide

  34. ©  2016  Sencha  Inc.  • CONFIDENTIAL  •
    Conclusion
    Ext JS offers a robust and flexible UI for enterprise data analysis applications,
    visualize big datasets in grids and charts with high performance
    34

    View Slide

  35. ©  2016  Sencha  Inc.  • CONFIDENTIAL  •
    Thank you!
    Questions?

    View Slide