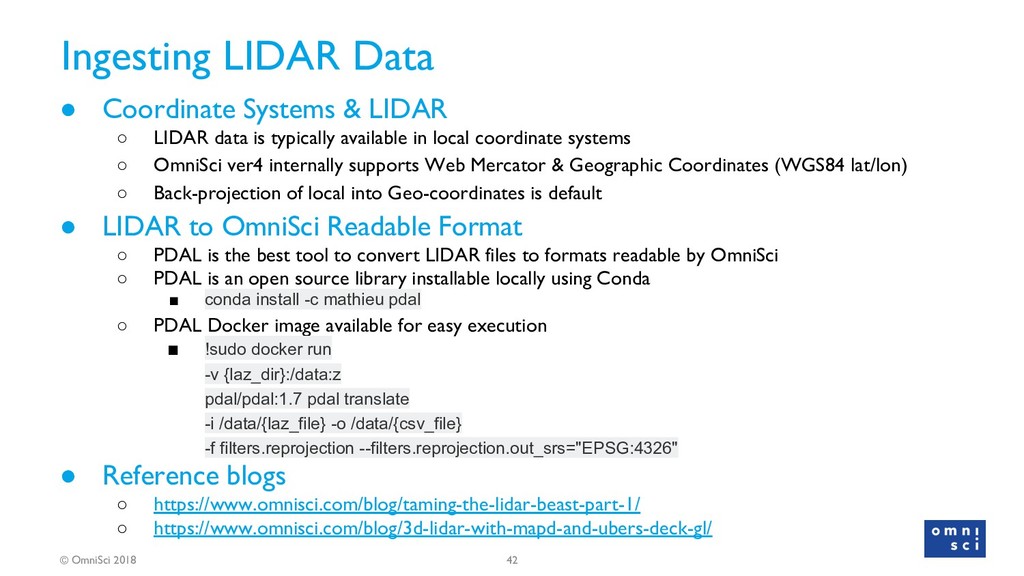
& LIDAR ◦ LIDAR data is typically available in local coordinate systems ◦ OmniSci ver4 internally supports Web Mercator & Geographic Coordinates (WGS84 lat/lon) ◦ Back-projection of local into Geo-coordinates is default • LIDAR to OmniSci Readable Format ◦ PDAL is the best tool to convert LIDAR files to formats readable by OmniSci ◦ PDAL is an open source library installable locally using Conda ▪ conda install -c mathieu pdal ◦ PDAL Docker image available for easy execution ▪ !sudo docker run -v {laz_dir}:/data:z pdal/pdal:1.7 pdal translate -i /data/{laz_file} -o /data/{csv_file} -f filters.reprojection --filters.reprojection.out_srs="EPSG:4326" • Reference blogs ◦ https://www.omnisci.com/blog/taming-the-lidar-beast-part-1/ ◦ https://www.omnisci.com/blog/3d-lidar-with-mapd-and-ubers-deck-gl/
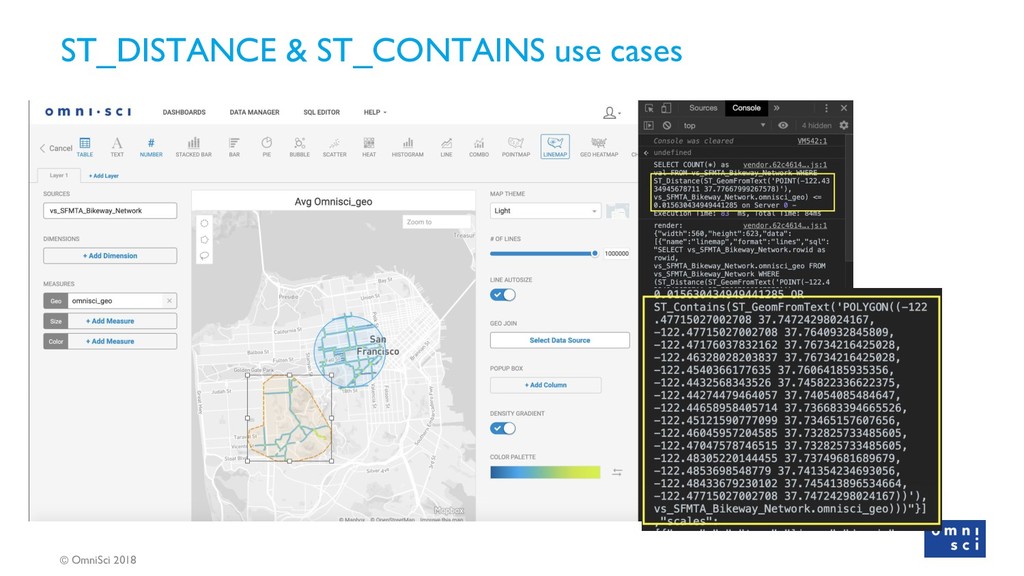
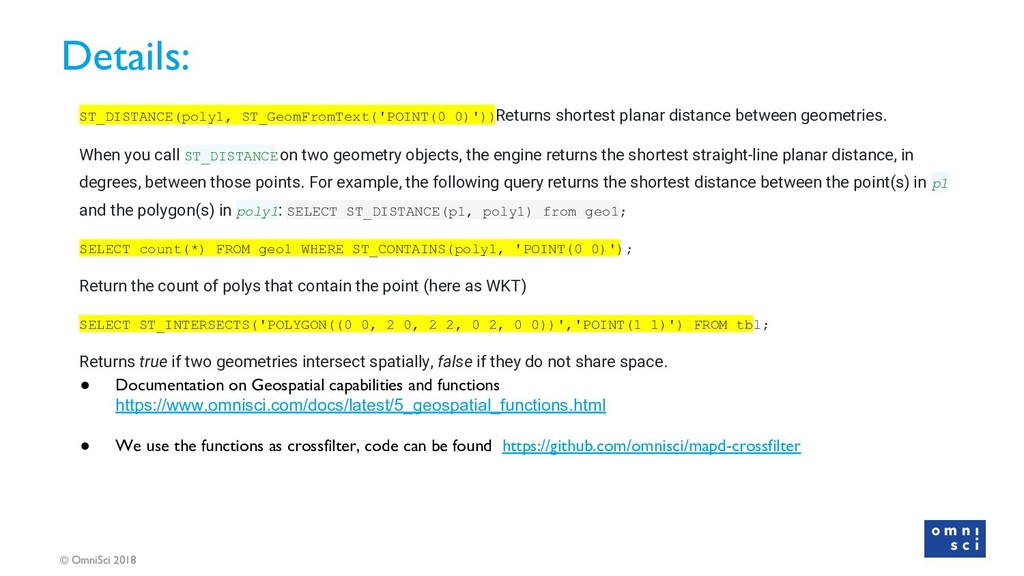
functions https://www.omnisci.com/docs/latest/5_geospatial_functions.html • We use the functions as crossfilter, code can be found https://github.com/omnisci/mapd-crossfilter ST_DISTANCE(poly1, ST_GeomFromText('POINT(0 0)')) Returns shortest planar distance between geometries. When you call ST_DISTANCE on two geometry objects, the engine returns the shortest straight-line planar distance, in degrees, between those points. For example, the following query returns the shortest distance between the point(s) in p1 and the polygon(s) in poly1: SELECT ST_DISTANCE(p1, poly1) from geo1; SELECT count(*) FROM geo1 WHERE ST_CONTAINS(poly1, 'POINT(0 0)'); Return the count of polys that contain the point (here as WKT) SELECT ST_INTERSECTS('POLYGON((0 0, 2 0, 2 2, 0 2, 0 0))','POINT(1 1)') FROM tbl; Returns true if two geometries intersect spatially, false if they do not share space.
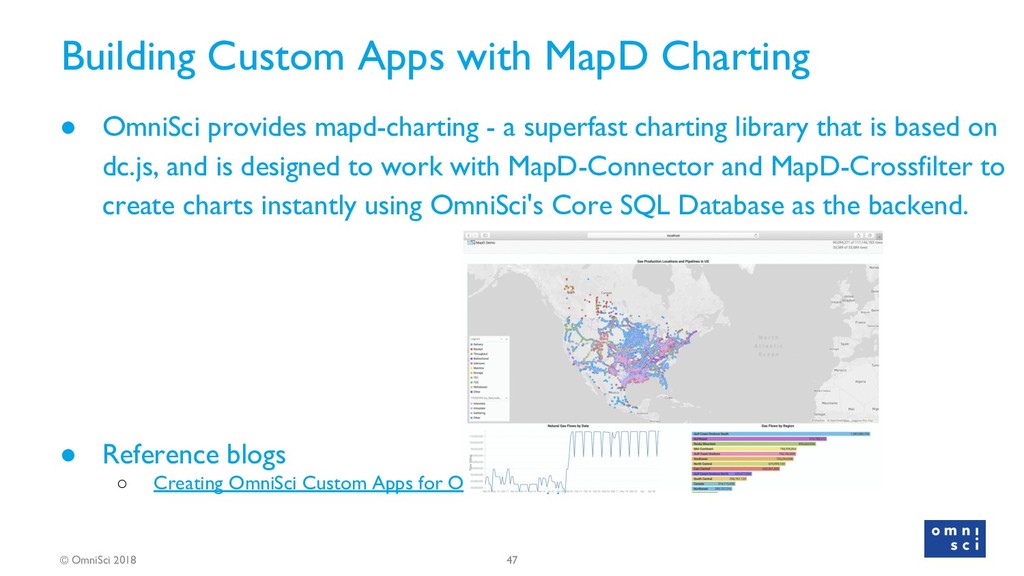
• OmniSci provides mapd-charting - a superfast charting library that is based on dc.js, and is designed to work with MapD-Connector and MapD-Crossfilter to create charts instantly using OmniSci's Core SQL Database as the backend. • Reference blogs ◦ Creating OmniSci Custom Apps for Oil & Gas Applications
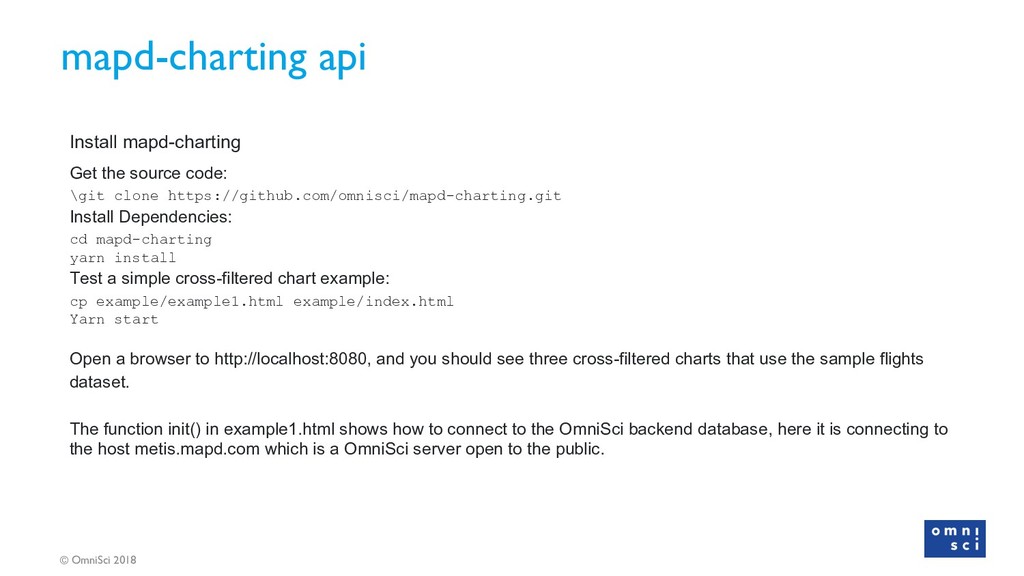
code: \git clone https://github.com/omnisci/mapd-charting.git Install Dependencies: cd mapd-charting yarn install Test a simple cross-filtered chart example: cp example/example1.html example/index.html Yarn start Open a browser to http://localhost:8080, and you should see three cross-filtered charts that use the sample flights dataset. The function init() in example1.html shows how to connect to the OmniSci backend database, here it is connecting to the host metis.mapd.com which is a OmniSci server open to the public.
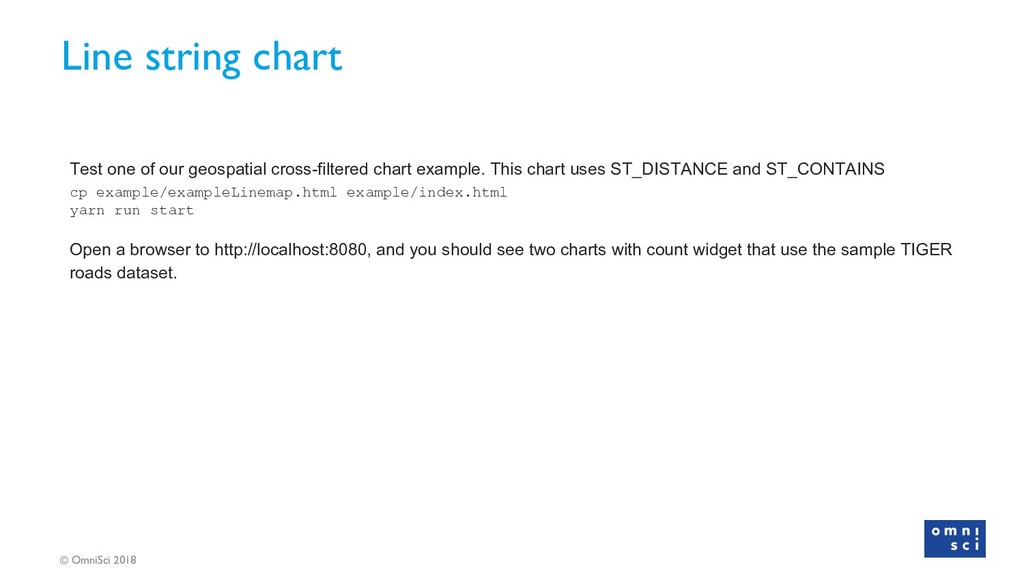
geospatial cross-filtered chart example. This chart uses ST_DISTANCE and ST_CONTAINS cp example/exampleLinemap.html example/index.html yarn run start Open a browser to http://localhost:8080, and you should see two charts with count widget that use the sample TIGER roads dataset.
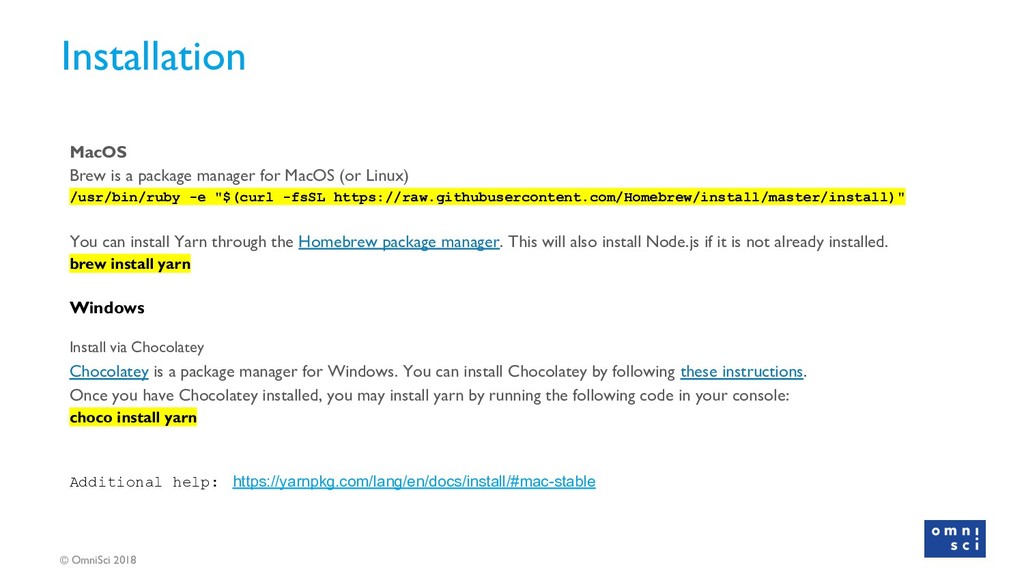
for MacOS (or Linux) /usr/bin/ruby -e "$(curl -fsSL https://raw.githubusercontent.com/Homebrew/install/master/install)" You can install Yarn through the Homebrew package manager. This will also install Node.js if it is not already installed. brew install yarn Windows Install via Chocolatey Chocolatey is a package manager for Windows. You can install Chocolatey by following these instructions. Once you have Chocolatey installed, you may install yarn by running the following code in your console: choco install yarn Additional help: https://yarnpkg.com/lang/en/docs/install/#mac-stable
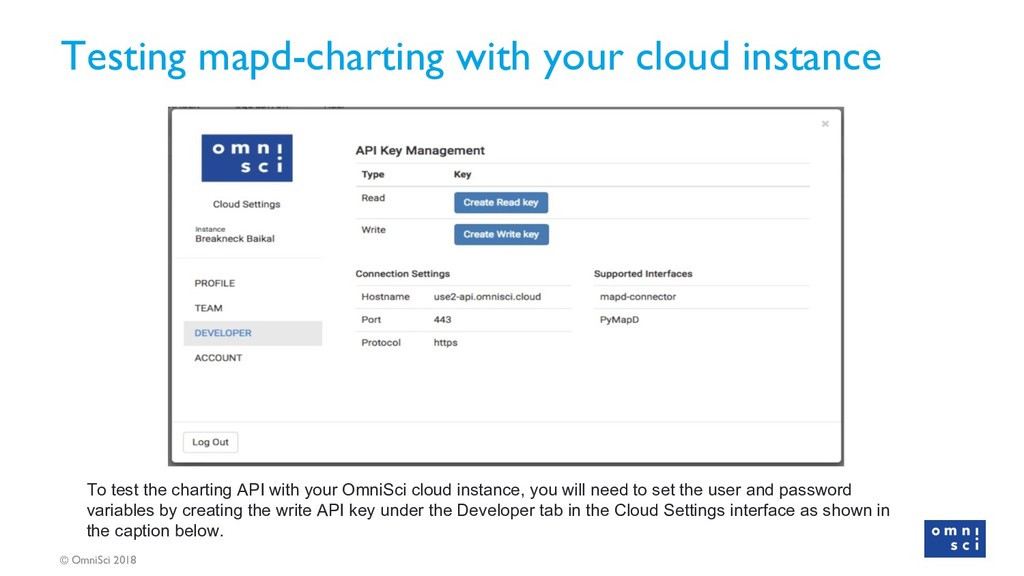
test the charting API with your OmniSci cloud instance, you will need to set the user and password variables by creating the write API key under the Developer tab in the Cloud Settings interface as shown in the caption below.
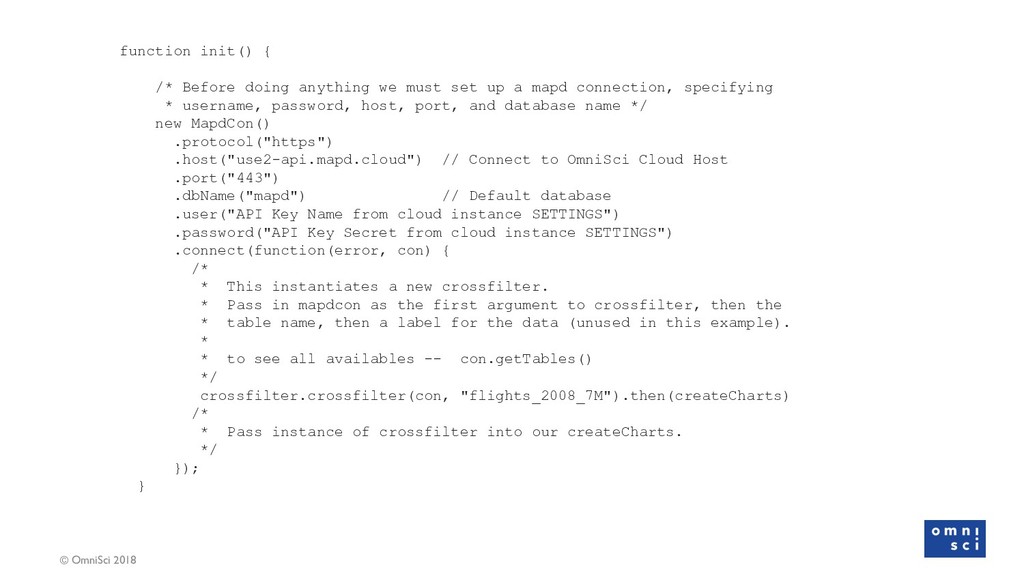
we must set up a mapd connection, specifying * username, password, host, port, and database name */ new MapdCon() .protocol("https") .host("use2-api.mapd.cloud") // Connect to OmniSci Cloud Host .port("443") .dbName("mapd") // Default database .user("API Key Name from cloud instance SETTINGS") .password("API Key Secret from cloud instance SETTINGS") .connect(function(error, con) { /* * This instantiates a new crossfilter. * Pass in mapdcon as the first argument to crossfilter, then the * table name, then a label for the data (unused in this example). * * to see all availables -- con.getTables() */ crossfilter.crossfilter(con, "flights_2008_7M").then(createCharts) /* * Pass instance of crossfilter into our createCharts. */ }); }
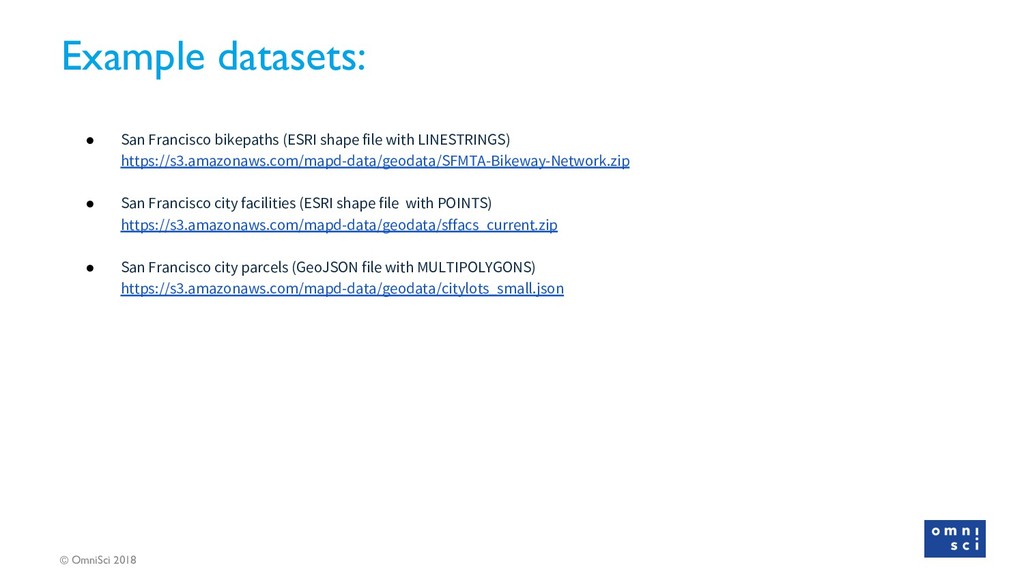
shape file with LINESTRINGS) https://s3.amazonaws.com/mapd-data/geodata/SFMTA-Bikeway-Network.zip • San Francisco city facilities (ESRI shape file with POINTS) https://s3.amazonaws.com/mapd-data/geodata/sffacs_current.zip • San Francisco city parcels (GeoJSON file with MULTIPOLYGONS) https://s3.amazonaws.com/mapd-data/geodata/citylots_small.json
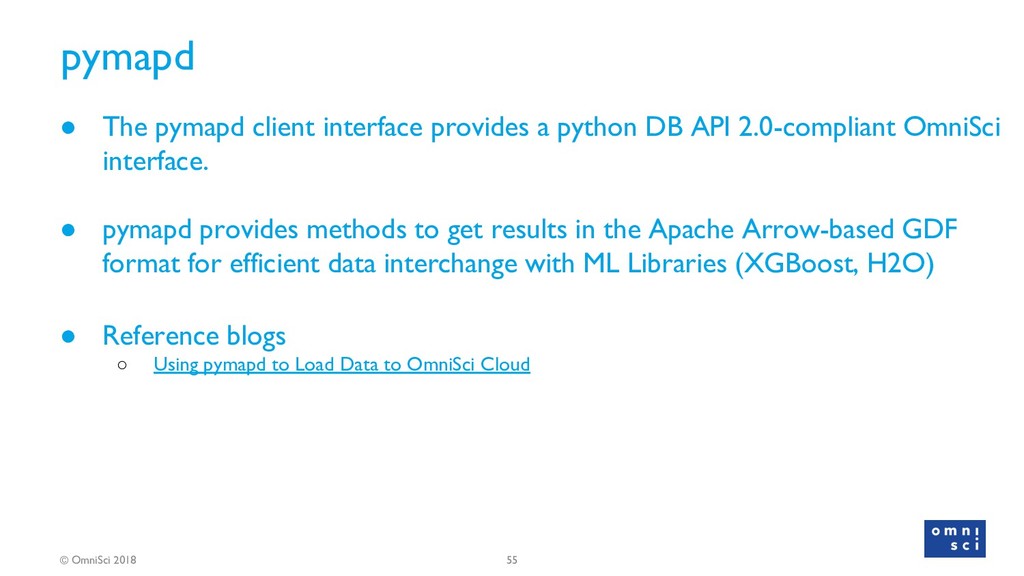
provides a python DB API 2.0-compliant OmniSci interface. • pymapd provides methods to get results in the Apache Arrow-based GDF format for efficient data interchange with ML Libraries (XGBoost, H2O) • Reference blogs ◦ Using pymapd to Load Data to OmniSci Cloud
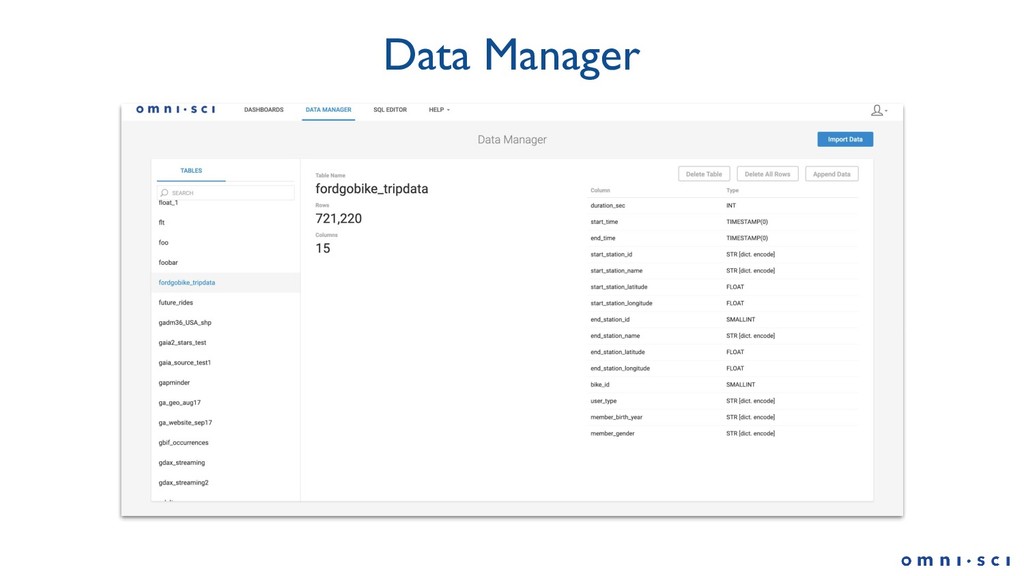
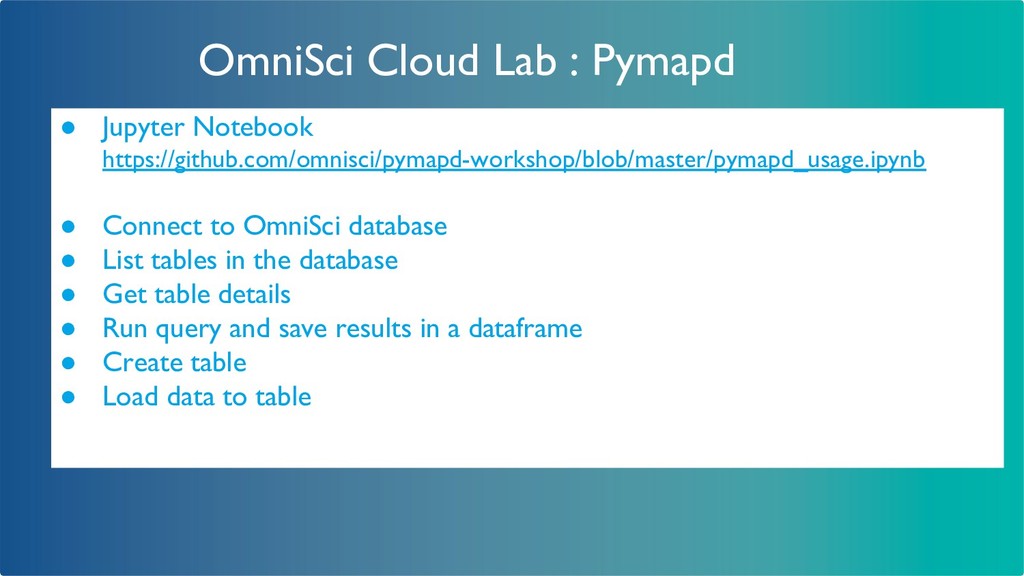
Connect to OmniSci database • List tables in the database • Get table details • Run query and save results in a dataframe • Create table • Load data to table
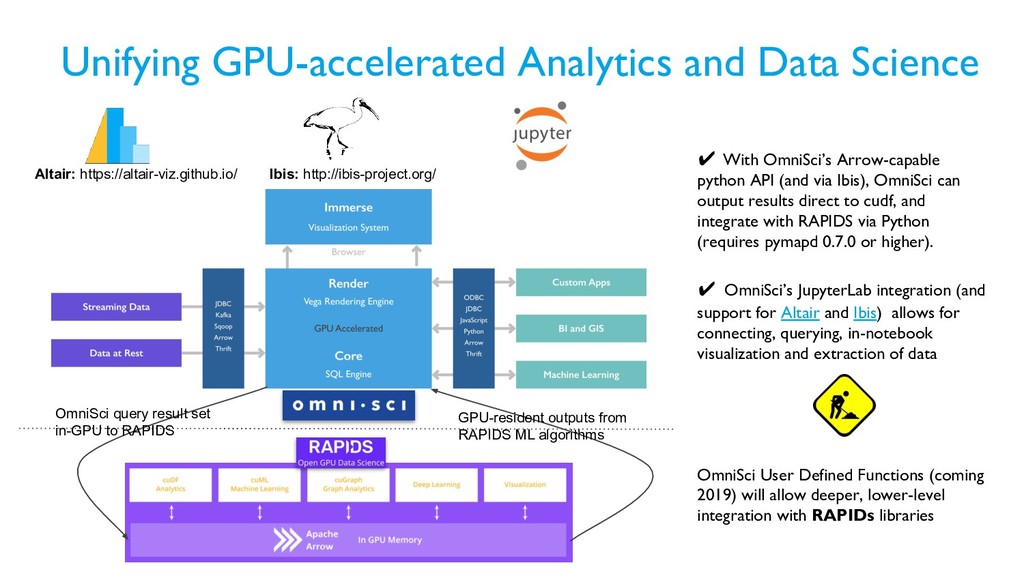
python API (and via Ibis), OmniSci can output results direct to cudf, and integrate with RAPIDS via Python (requires pymapd 0.7.0 or higher). ✔ OmniSci’s JupyterLab integration (and support for Altair and Ibis) allows for connecting, querying, in-notebook visualization and extraction of data OmniSci User Defined Functions (coming 2019) will allow deeper, lower-level integration with RAPIDs libraries Altair: https://altair-viz.github.io/ Ibis: http://ibis-project.org/ OmniSci query result set in-GPU to RAPIDS GPU-resident outputs from RAPIDS ML algorithms
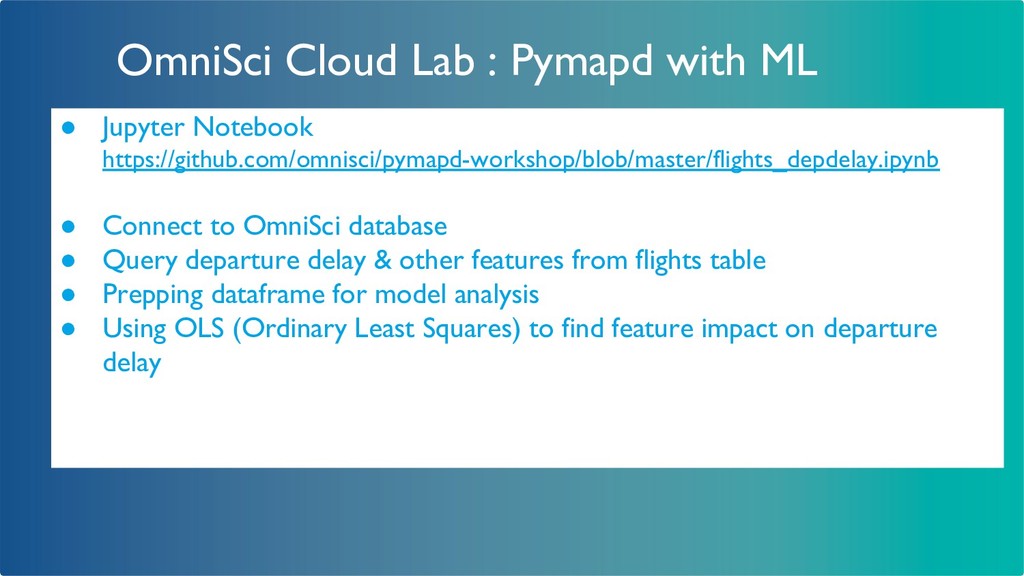
https://github.com/omnisci/pymapd-workshop/blob/master/flights_depdelay.ipynb • Connect to OmniSci database • Query departure delay & other features from flights table • Prepping dataframe for model analysis • Using OLS (Ordinary Least Squares) to find feature impact on departure delay
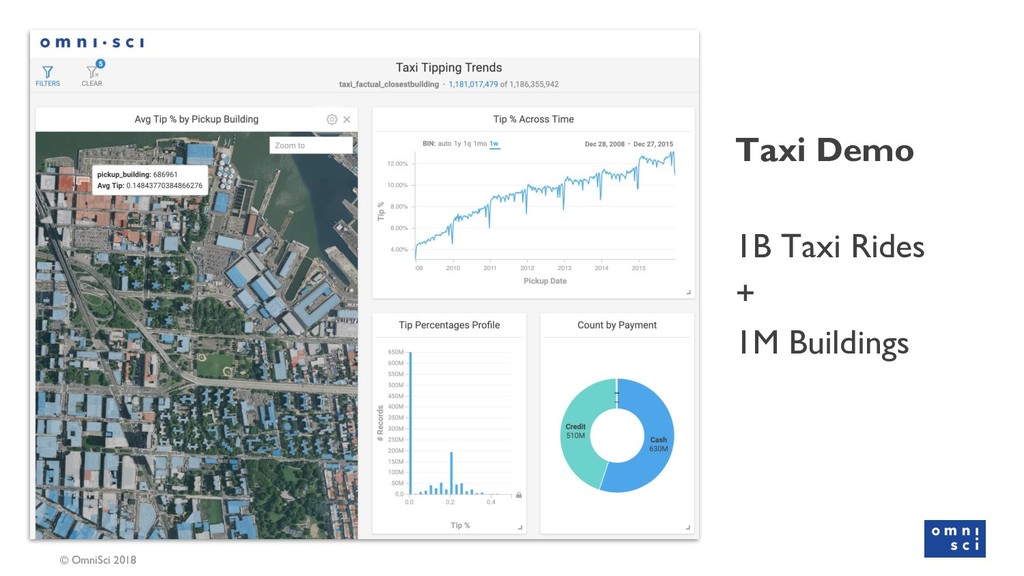
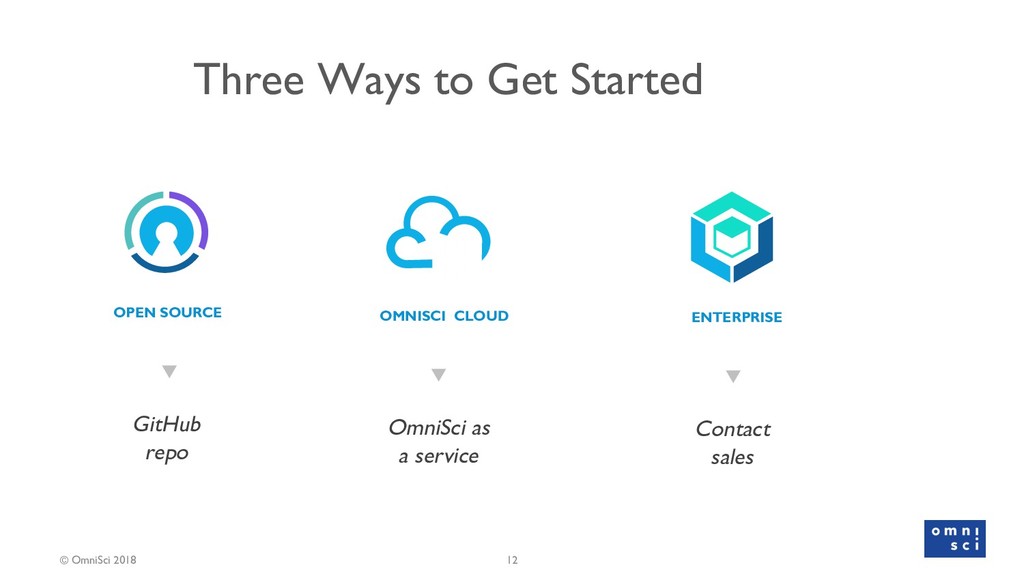
stories on product usage • omnisci.com/demos Play with our live demos for yourself! • omnisci.cloud Get an OmniSci instance in 60 seconds • omnisci.com/platform/downloads/ Download a 30-day trial of OmniSci • community.omnisci.com Ask questions and share your experiences Next Steps
![Veda Shankar Senior Developer Advocate , OmniSci Community [email protected] slides:](https://files.speakerdeck.com/presentations/af189dd008d14a01ba56752f6e6f9d29/slide_1.jpg)