Share
Embed
Real-Time Data Ingestion With StreamSets
Presented at the San Francisco StreamSets User Group on June 4th 2019.
OmniSci
June 04, 2019
Transcript
30 slides
-
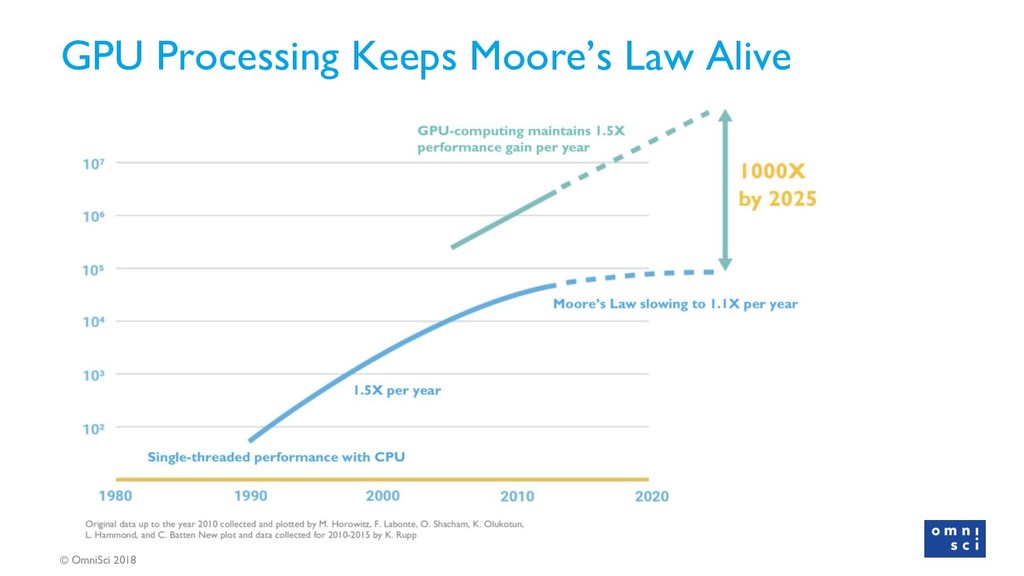
© OmniSci 2018 Data Grows Faster Than CPU Processing Data
Growth 40% per year CPU Processing Power 20% per year -
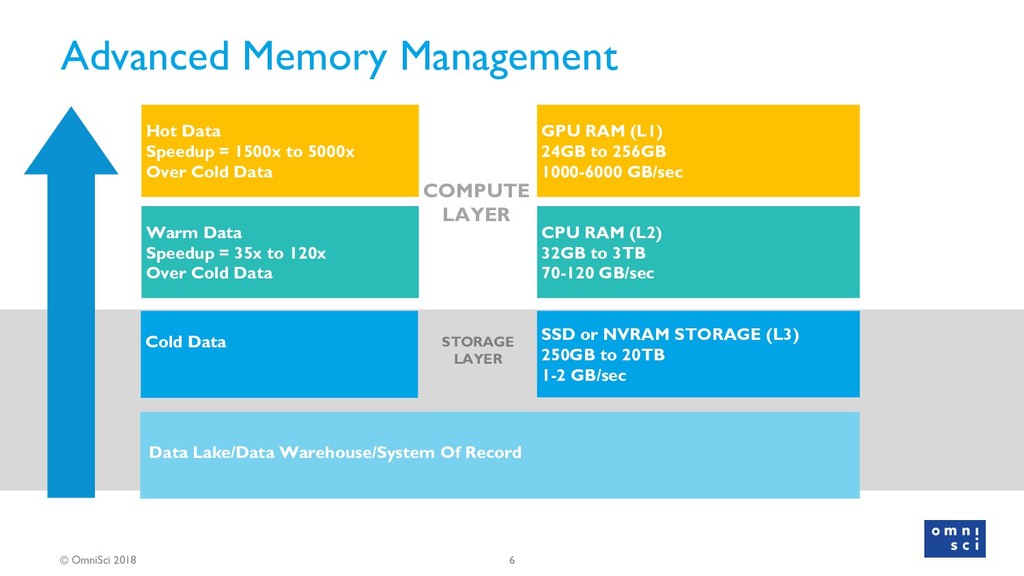
© OmniSci 2018 6 SSD or NVRAM STORAGE (L3) 250GB
to 20TB 1-2 GB/sec CPU RAM (L2) 32GB to 3TB 70-120 GB/sec GPU RAM (L1) 24GB to 256GB 1000-6000 GB/sec Hot Data Speedup = 1500x to 5000x Over Cold Data Warm Data Speedup = 35x to 120x Over Cold Data Cold Data COMPUTE LAYER STORAGE LAYER Data Lake/Data Warehouse/System Of Record Advanced Memory Management -
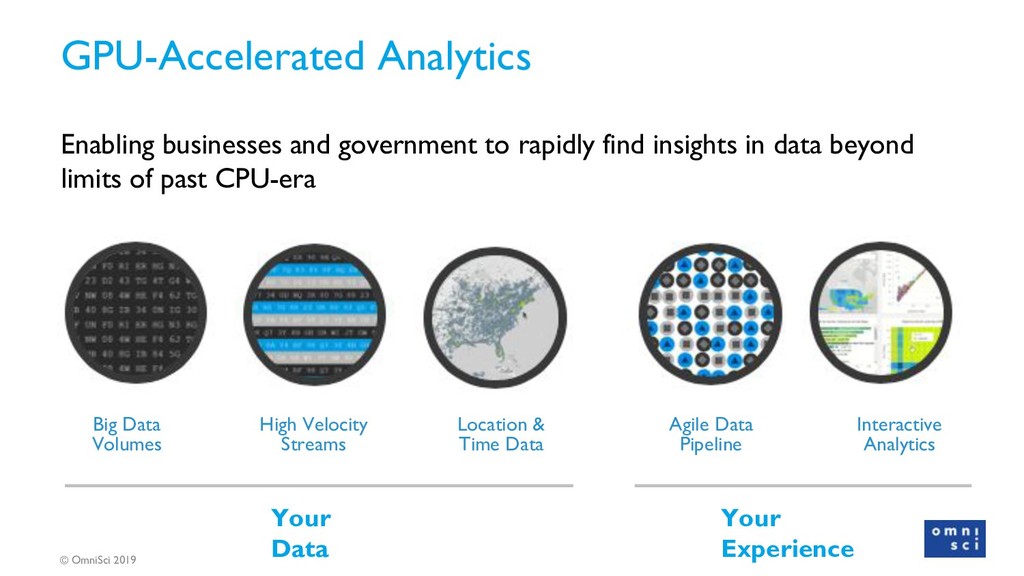
© OmniSci 2019 Interactive Analytics Location & Time Data Your
Data Agile Data Pipeline High Velocity Streams Your Experience Big Data Volumes Enabling businesses and government to rapidly find insights in data beyond limits of past CPU-era GPU-Accelerated Analytics -
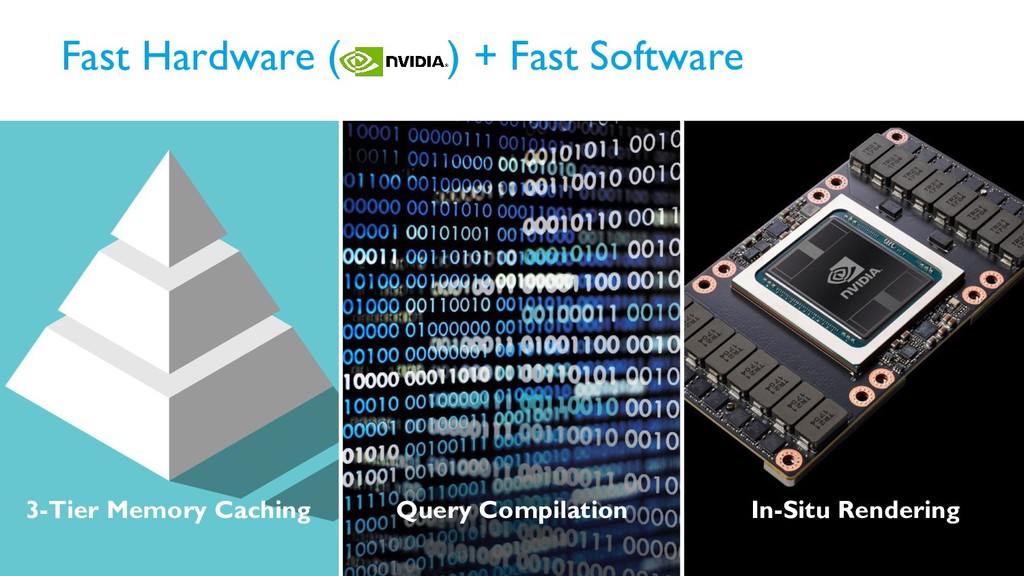
© OmniSci 2018 10 Fast Hardware ( ) + Fast
Software 3-Tier Memory Caching Query Compilation In-Situ Rendering -
© OmniSci 2018 11 * open source for single node
github.com/omnisci/mapd-core -
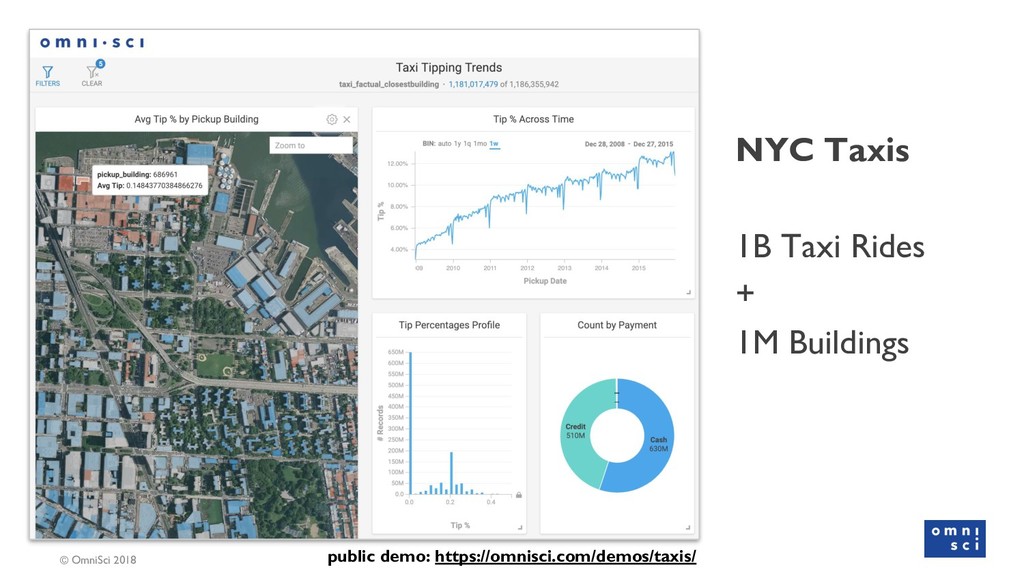
© OmniSci 2018 NYC Taxis 1B Taxi Rides + 1M
Buildings public demo: https://omnisci.com/demos/taxis/ -
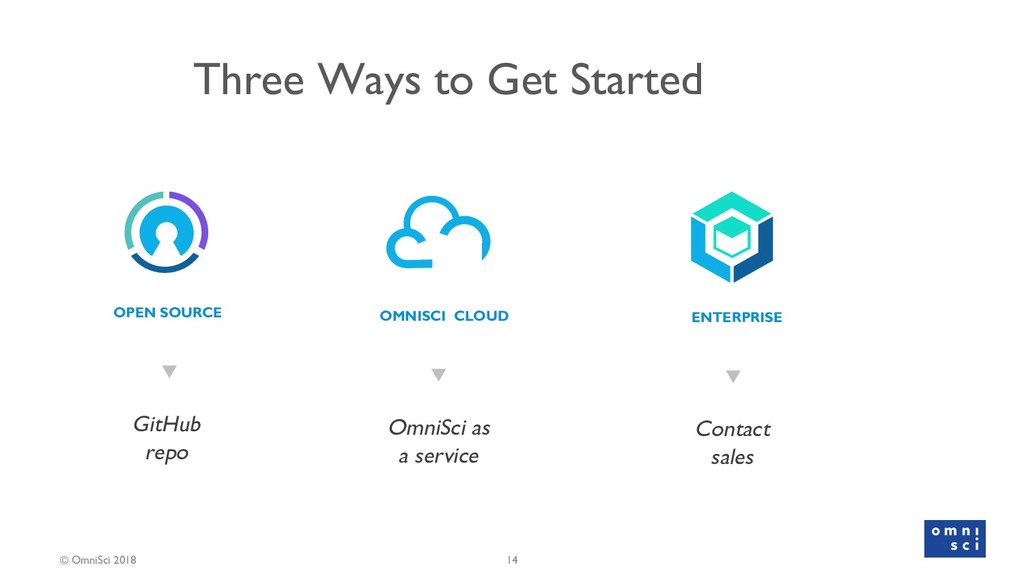
© OmniSci 2018 Three Ways to Get Started GitHub repo
OPEN SOURCE OmniSci as a service OMNISCI CLOUD Contact sales ENTERPRISE 14 -
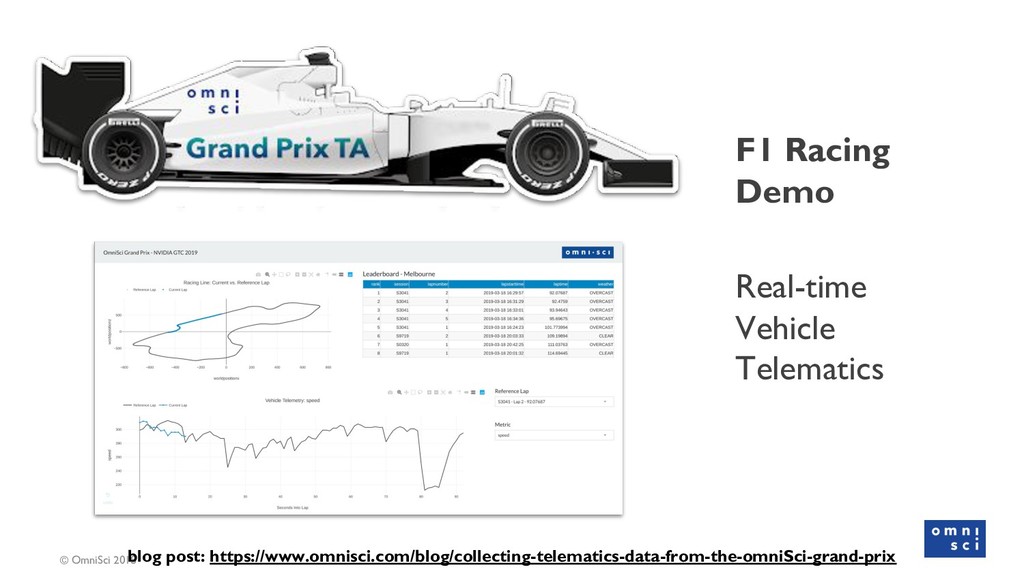
© OmniSci 2018 F1 Racing Demo Real-time Vehicle Telematics blog
post: https://www.omnisci.com/blog/collecting-telematics-data-from-the-omniSci-grand-prix -
© OmniSci 2018 F1 Racing Demo Real-time Vehicle Telematics Using
Open Source Tools public repo: https://github.com/omnisci/vehicle-telematics-analytics-demo -
© OmniSci 2018 Step 1: Data Engineering and ETL 3
pipelines • UDP to Kafka • Parse to JSON • Data Refinement (and insertion into OmniSci using JDBC) -
© OmniSci 2018 Step 2: Querying and Visualization Plotly Dash
using pymapd • Queries every 5-15 seconds • No indexing means the data is instantly available -
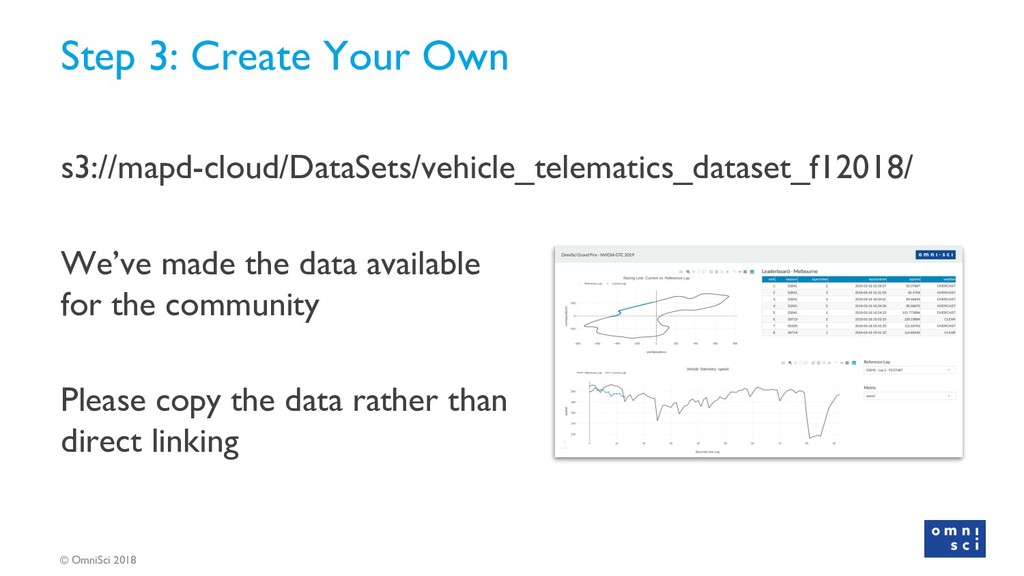
© OmniSci 2018 Step 3: Create Your Own s3://mapd-cloud/DataSets/vehicle_telematics_dataset_f12018/ We’ve
made the data available for the community Please copy the data rather than direct linking -
© OmniSci 2018 21 OmniSci Geospatial Features • Geospatial objects
◦ POINT, LINESTRING, POLYGON, MULTIPOLYGON • Geospatial File Formats ◦ GeoJSON, ESRI Shapefile, KML and CSV/TSV with WKT • Geospatial Functions ◦ Geometry Constructors ◦ Geometry Editors ◦ Geometry Accessors ◦ Spatial Relationships and Measurements ▪ ST_Distance, ST_Contains, ST_Within, ST_Area, ST_Perimeter, ST_Length -
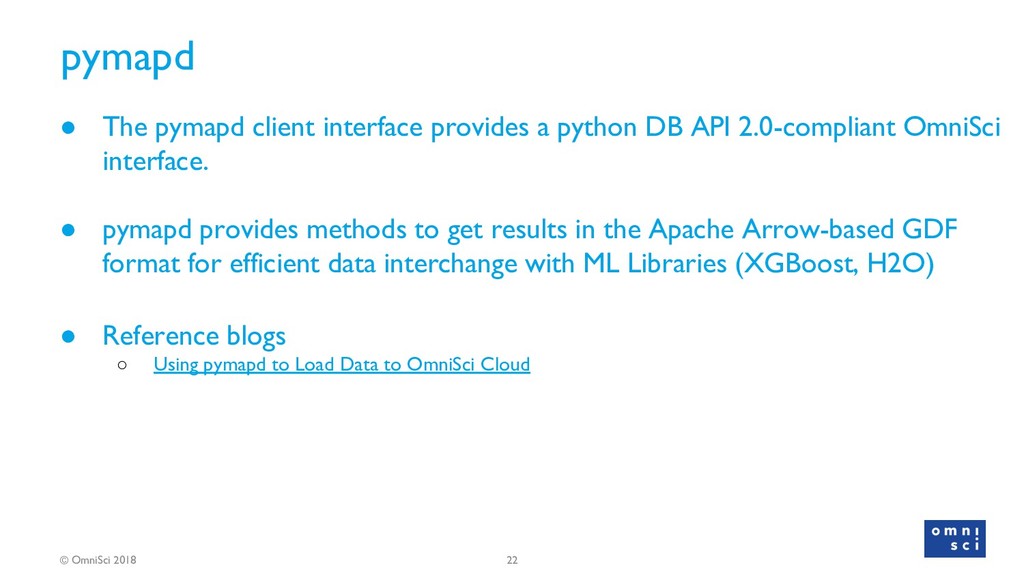
© OmniSci 2018 22 pymapd • The pymapd client interface
provides a python DB API 2.0-compliant OmniSci interface. • pymapd provides methods to get results in the Apache Arrow-based GDF format for efficient data interchange with ML Libraries (XGBoost, H2O) • Reference blogs ◦ Using pymapd to Load Data to OmniSci Cloud -
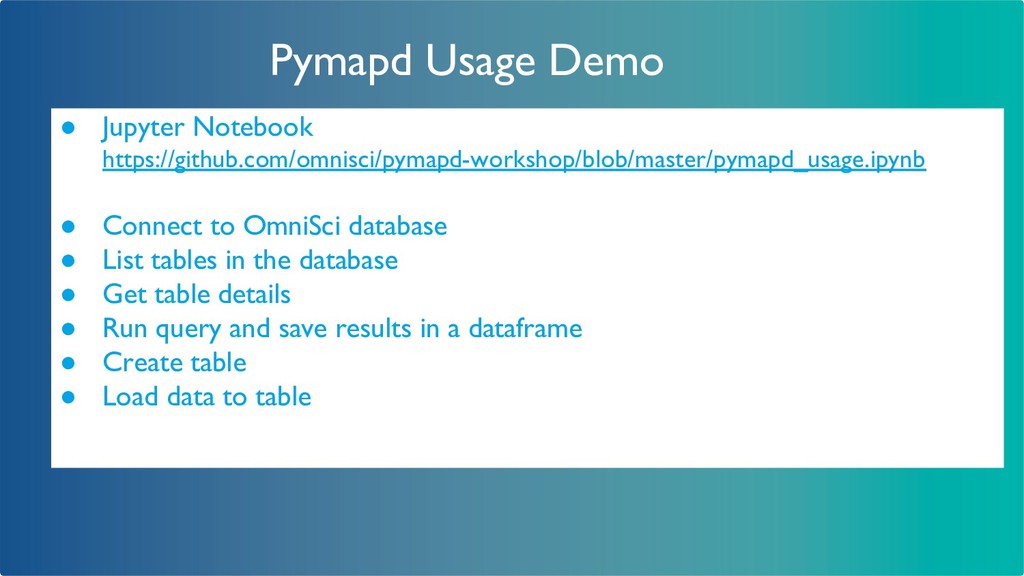
Pymapd Usage Demo • Jupyter Notebook https://github.com/omnisci/pymapd-workshop/blob/master/pymapd_usage.ipynb • Connect to
OmniSci database • List tables in the database • Get table details • Run query and save results in a dataframe • Create table • Load data to table -
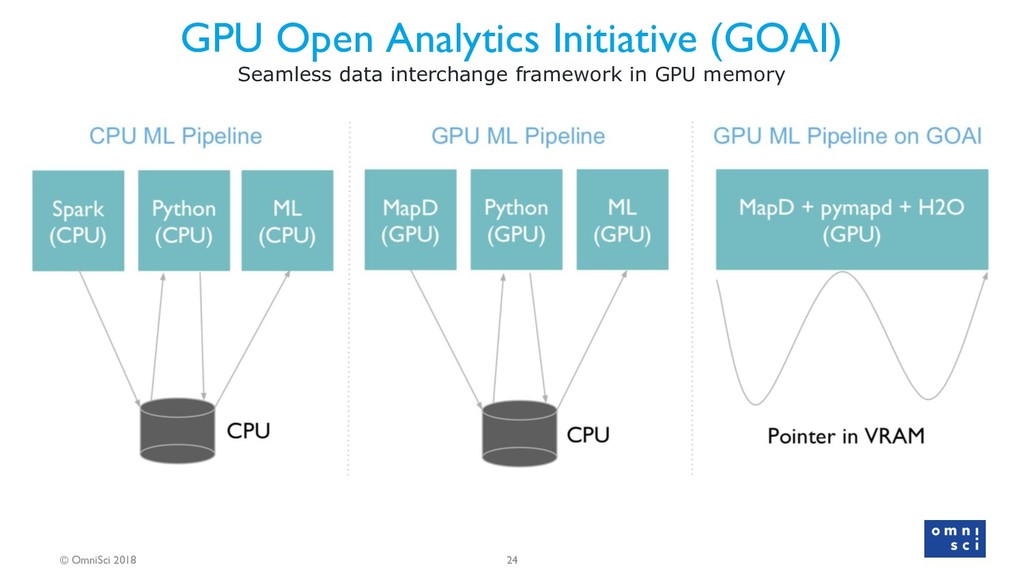
© OmniSci 2018 24 GPU Open Analytics Initiative (GOAI) Seamless
data interchange framework in GPU memory -
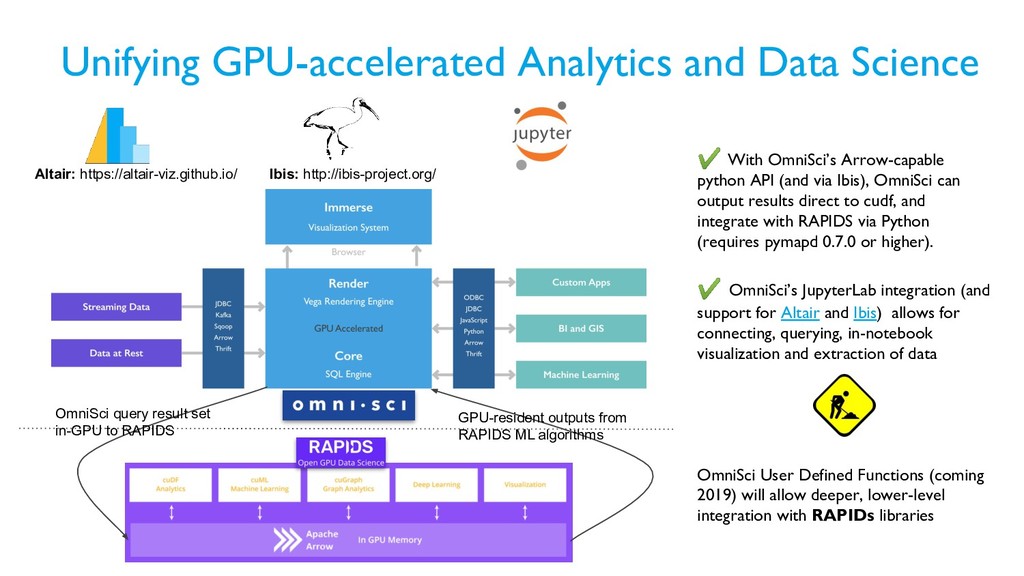
Unifying GPU-accelerated Analytics and Data Science ✔ With OmniSci’s Arrow-capable
python API (and via Ibis), OmniSci can output results direct to cudf, and integrate with RAPIDS via Python (requires pymapd 0.7.0 or higher). ✔ OmniSci’s JupyterLab integration (and support for Altair and Ibis) allows for connecting, querying, in-notebook visualization and extraction of data OmniSci User Defined Functions (coming 2019) will allow deeper, lower-level integration with RAPIDs libraries Altair: https://altair-viz.github.io/ Ibis: http://ibis-project.org/ OmniSci query result set in-GPU to RAPIDS GPU-resident outputs from RAPIDS ML algorithms -
ML Demo with Pymapd • Jupyter Notebook https://github.com/omnisci/pymapd-workshop/blob/master/flights_depdelay.ipynb • Connect
to OmniSci database • Query departure delay & other features from flights table • Prepping dataframe for model analysis • Using OLS (Ordinary Least Squares) to find feature impact on departure delay -
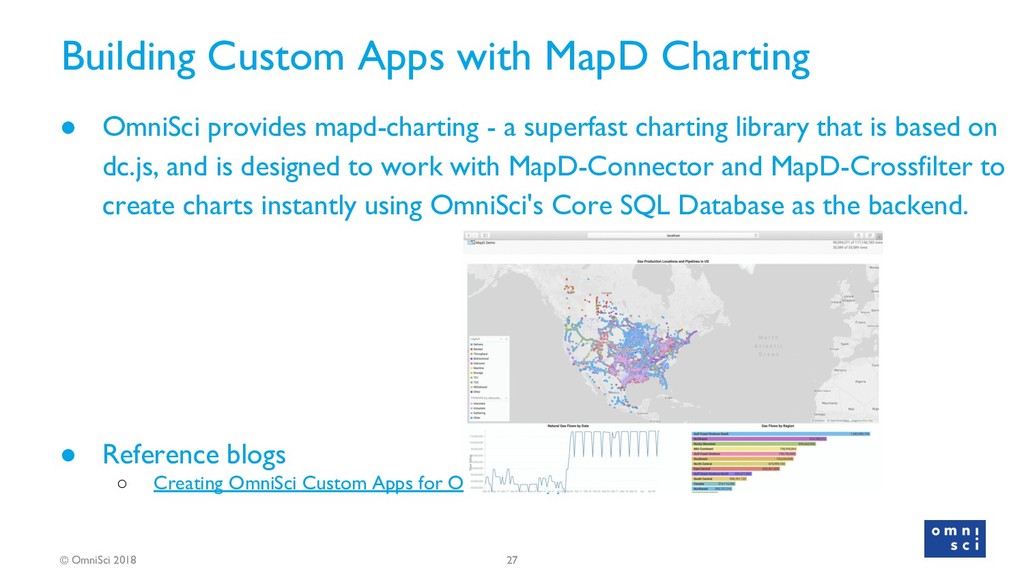
© OmniSci 2018 27 Building Custom Apps with MapD Charting
• OmniSci provides mapd-charting - a superfast charting library that is based on dc.js, and is designed to work with MapD-Connector and MapD-Crossfilter to create charts instantly using OmniSci's Core SQL Database as the backend. • Reference blogs ◦ Creating OmniSci Custom Apps for Oil & Gas Applications -
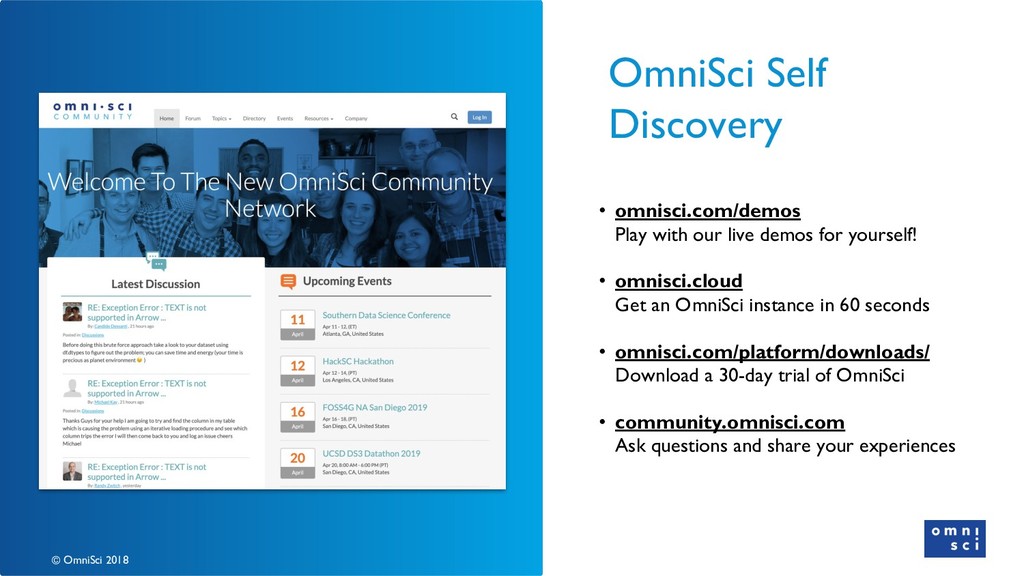
© OmniSci 2018 © OmniSci 2018 • omnisci.com/demos Play with
our live demos for yourself! • omnisci.cloud Get an OmniSci instance in 60 seconds • omnisci.com/platform/downloads/ Download a 30-day trial of OmniSci • community.omnisci.com Ask questions and share your experiences OmniSci Self Discovery