$30 off During Our Annual Pro Sale. View Details »

ONTOCHAIN software ecosystem: Ecosystem Economy

ONTOCHAIN software ecosystem: Ecosystem Economy

Slides presented at the ONTOCHAIN Summit for Trustworthy Internet by Thanasis Papaioannou, ONTOCHAIN core partner & Principal Investigator at Athens University of Economics and Business

ONTOCHAIN

June 01, 2022
Tweet

More Decks by ONTOCHAIN

Other Decks in Technology

Transcript

  1. Follow us
    ONTOCHAIN Ecosystem Economy
    Dr. Thanasis Papaioannou
    Dept. of Informatics, Athens University of Economics and Business (AUEB)
    [email protected]
    ONTOCHAIN Summit, Berlin, June 2022

    View Slide

  2. ONTOCHAIN FRAMEWORK
    VALUE

    View Slide

  3. | ONTOCHAIN.NGI.EU
    Unique Characteristics
    • Combines functionality towards trustworthy services exchange and trustworthy data
    handling in an unprecedented way
    – SSIs, VCs, eIDAS bridge, reputation management, semantic data management offchain/onchain,
    data/location oracles, data provenance, NFT management, supply chain management, price determination
    mechanisms, privacy-aware data processing, blockchain bridges
    • Built by top EU teams under a very selective process with 6M EUR funding
    • Interoperable to each other and (being) deployed on common infrastructure

    View Slide

  4. | ONTOCHAIN.NGI.EU
    What’s the point
    • Interesting dApps of the future can combine this functionality to offer unique
    services to end users
    • A high emphasis is put on trust and privacy
    – Supported by the top quality of team and the trust by design approach followed
    • High demand for such dApps is anticipated
    • Many blockchain platforms have limited real apps!

    View Slide

  5. | ONTOCHAIN.NGI.EU
    What is there for new members (OC3
    applicants)
    • Become part of the ONTOCHAIN brand
    • Collaborate with one of the strongest
    blockchain communities in EU
    • Make profit

    View Slide

  6. | ONTOCHAIN.NGI.EU
    What is expected from new members
    • Complement existing functionality creating
    huge externalities
    • Showcase ONTOCHAIN value with
    attractive apps for end users
    • Validate arguments with real demand and
    users

    View Slide

  7. ONTOCHAIN VENTURE

    View Slide

  8. BUSINESS USE CASES

    View Slide

  9. BUSINESS ROLES
    End-user: Individual, SME, big corporate, public institutions that need/wish to employ dApps
    Third-party service component: poc4commerce, reputable, knowledgeX, hibi, ontossivault, graphchain,
    copyrightly
    dApp developers: software companies or software engineers that develop decentralized applications
    dApp providers: companies that provide dApps to end-users
    ONTOCHAIN: the core blockchain platform
    Nodes: Computing Resource Providers
    Data providers: providers of data needed by dApp providers or data oracles

    View Slide

  10. OVERALL BUSINESS MODEL
    SaaS/PaaS
    1. ONTOCHAIN offers the libraries and the platform/resources for dApp
    developers/ dApp providers to build and deploy their services
    • One-off, subscription fees and/or transaction fees will be used
    2. End-users subscribe/pay per use the dApp providers for dApp
    transactions
    • Part of the transaction fee is given to ONTOCHAIN
    • Part of the transaction fee is given to the different libraries/solution
    (3P) providers that are used by the dApp
    3. ONTOCHAIN pays nodes with gas fees and other platform costs
    This business model is non-trivial

    View Slide

  11. BUSINESS MODEL FOR A SERVICE COMPONENT
    (THIRD-PARTY, 3P)

    View Slide

  12. ONTOCHAIN VALUE NETWORK

    View Slide

  13. ECONOMIC MODELING – REVENUES
    Revenues Value
    Mean Service Fee per User
    per dApp (€/month)
    40
    Data Fees (paid by users
    or by dApps) monthly per
    transaction (€/transaction)
    0.5
    Incentives (Gas)
    (€/transaction)
    2
    Mean Component Fees per
    Service Instance (w.r.t.
    transaction fee)
    12%
    Transaction fee 35%
    • The mean service fee per dApp transaction 8 EUR
    – The average number of monthly transactions per user per dApp is 5,
    i.e., a monthly fee of 40 EUR for an end-user to use a dApp
    • The ONTOCHAIN platform is assumed to withhold 35% of
    the dApp service fees paid by the end-users
    • We assume that each dApp employs 4 ONTOCHAIN
    service components on the average
    • Each of these service components is paid a fraction 12% of the service
    fee per dApp transaction withheld by the ONTOCHAIN platform
    • Each dApp provider pays the ONTOCHAIN platform a
    monthly fee of 100 EUR for hosting the dApp, while a one-
    off deployment cost of 100 EUR is also considered

    View Slide

  14. ECONOMIC MODELING - COSTS
    OPEX Costs Value
    (EUR)
    Monthly Power Consumption per mining node
    (500MHs)
    1116
    SW licensing costs per service component (annual) 0
    Hardware expansion rate w.r.t. num of monthly
    transactions
    0.01%
    Hosting fee per physical OC / SC node 10
    dApp hosting fee per month 100
    Annual personnel Costs for Software Maintenance,
    Marketing and Support (per dApp)
    12,000
    Communication (network) costs per node 480
    Computation power per month per node (KWh) 720
    Inflation rate (%) 2%
    Annual Personnel Costs for Software Maintenance,
    Marketing and Support (per Service Component)
    48,000
    Communication (network) costs per service
    component/dApp provider
    600
    Annual OC personnel Costs for Software
    Maintenance, Marketing and Support (per dApp)
    120
    Monthly rent for placing a mining node 150
    Monthly maintenance cost per mining node 200
    CAPEX Costs Value
    (EUR)
    dApp software development 50,000
    Hardware cost per (mining)
    node (500MH/s)
    7,500
    Hardware cost per full
    ONTOCHAIN node
    3,000
    Hardware cost per service
    component
    5,000
    Initial number of full
    ONTOCHAIN nodes
    5
    EC funding for
    ONTOCHAIN
    6,000,000
    dApp deployment cost 100
    Service Component Software
    Development
    80,000

    View Slide

  15. ECONOMIC ANALYSIS PER STAKEHOLDER
    System Financial Data
    Infrastructure Information Revenues
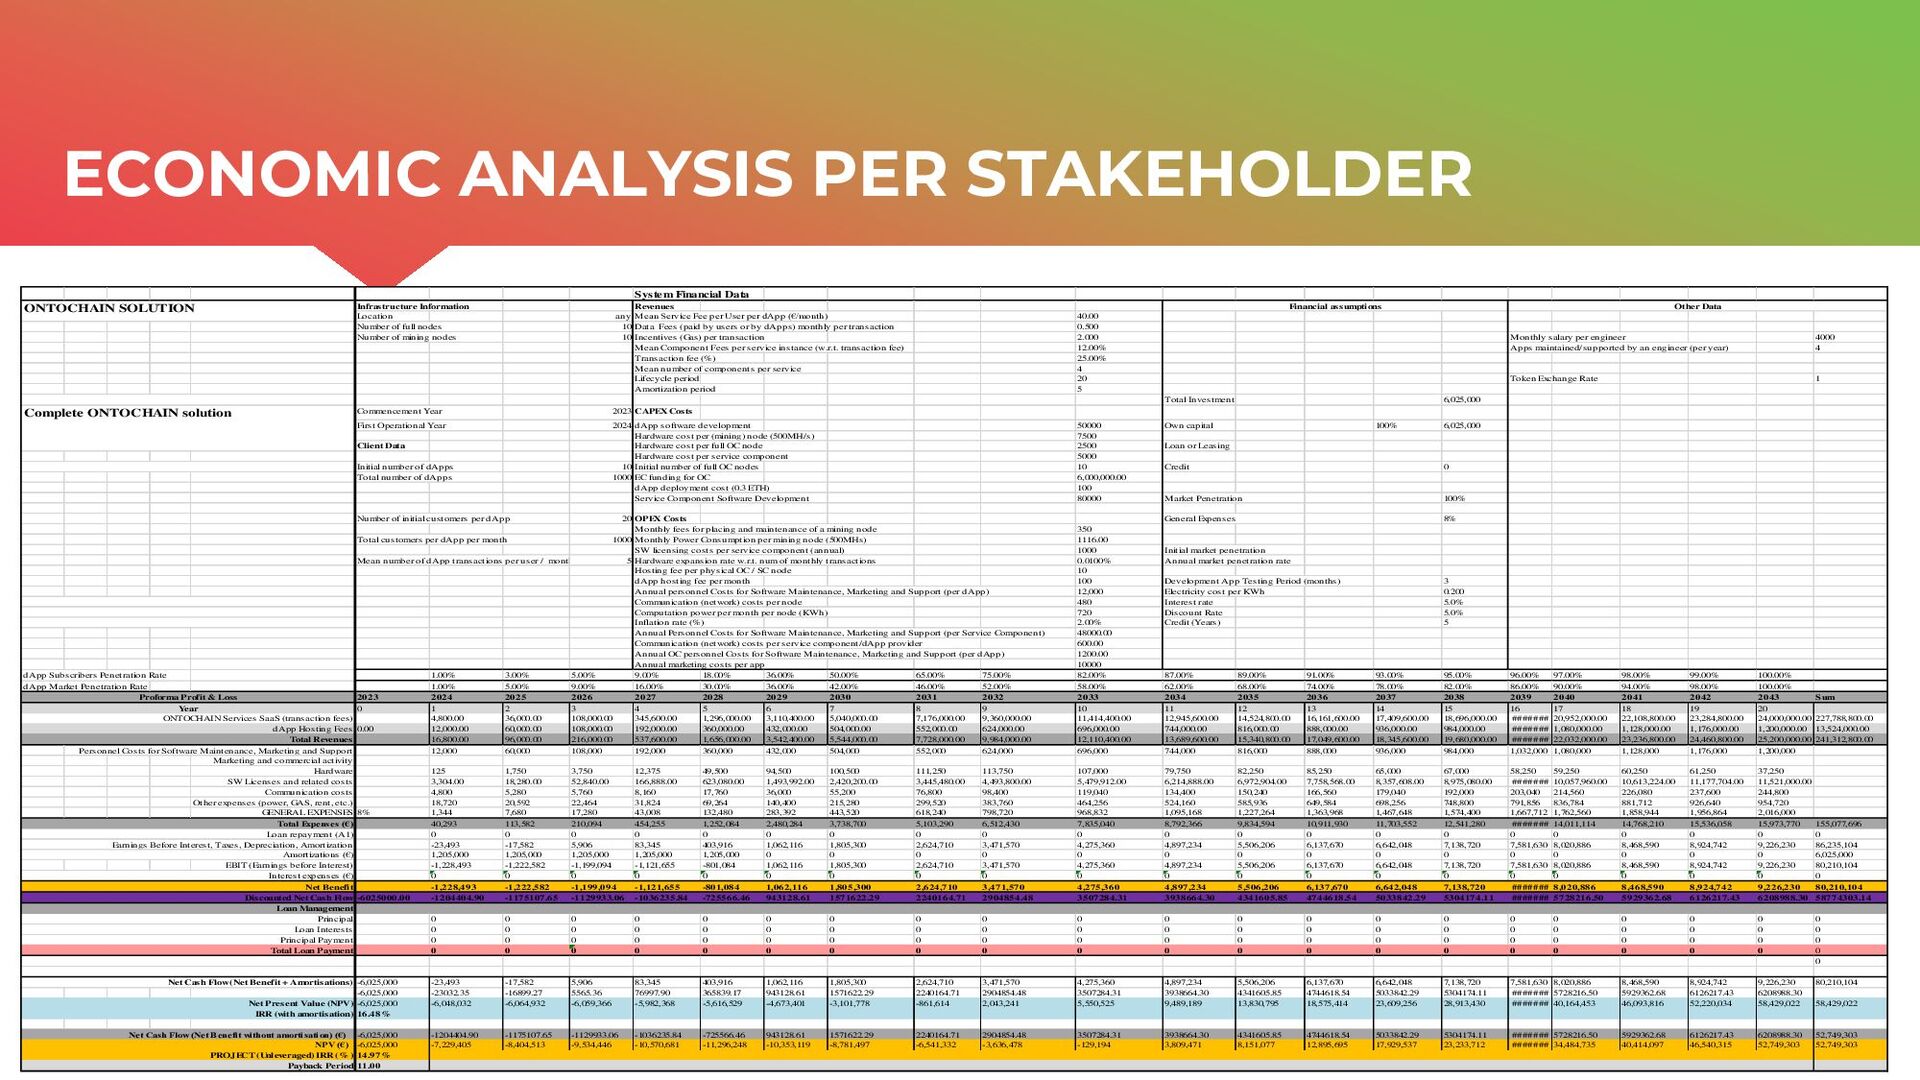
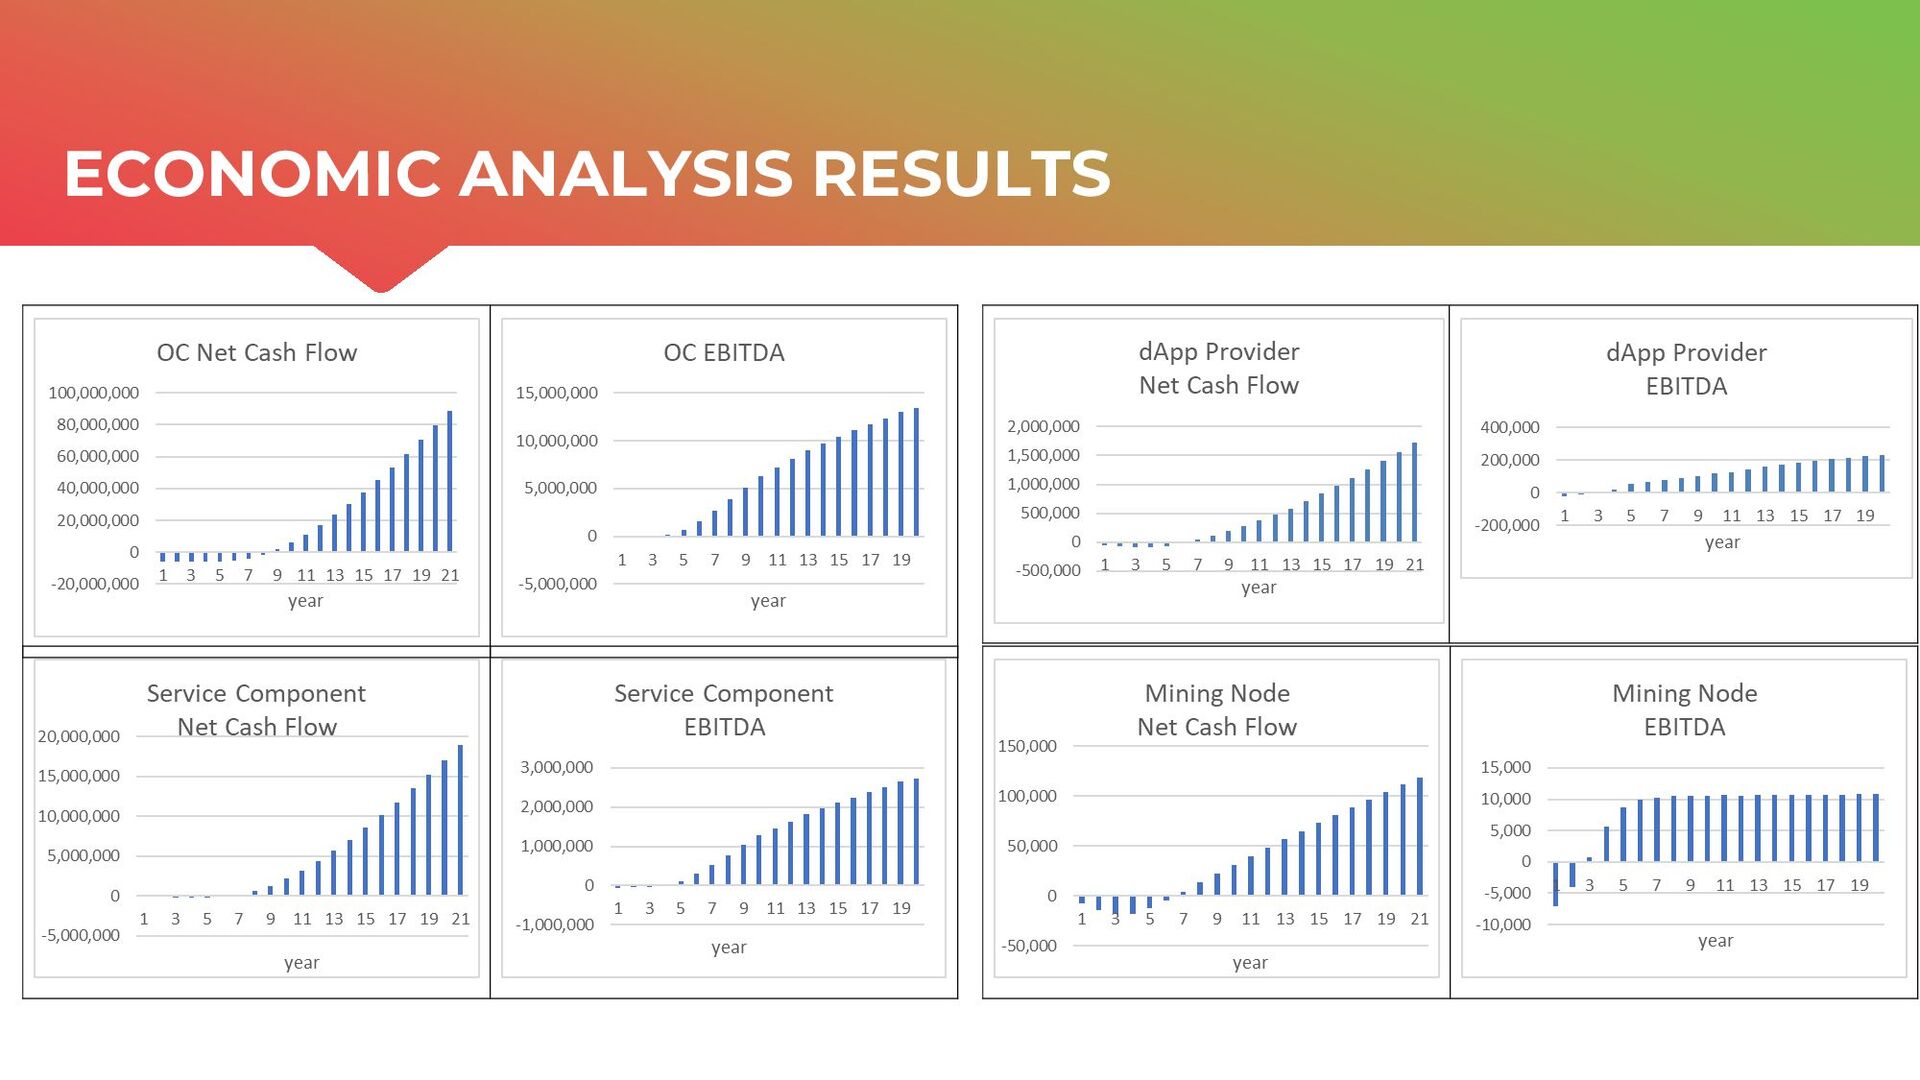
    Location any Mean Service Fee per User per dApp (€/month) 40.00
    Number of full nodes 10 Data Fees (paid by users or by dApps) monthly per transaction 0.500
    Number of mining nodes 10 Incentives (Gas) per transaction 2.000 Monthly salary per engineer 4000
    Mean Component Fees per service instance (w.r.t. transaction fee) 12.00% Apps maintained/supported by an engineer (per year) 4
    Transaction fee (%) 25.00%
    Mean number of components per service 4
    Lifecycle period 20 Token Exchange Rate 1
    Amortization period 5
    Total Investment 6,025,000
    Commencement Year 2023 CAPEX Costs
    First Operational Year 2024 dApp software development 50000 Own capital 100% 6,025,000
    Hardware cost per (mining) node (500MH/s) 7500
    Client Data Hardware cost per full OC node 2500 Loan or Leasing
    Hardware cost per service component 5000
    Initial number of dApps 10 Initial number of full OC nodes 10 Credit 0
    Total number of dApps 1000 EC funding for OC 6,000,000.00
    dApp deployment cost (0.3 ETH) 100
    Service Component Software Development 80000 Market Penetration 100%
    Number of initial customers per dApp 20 OPEX Costs General Expenses 8%
    Monthly fees for placing and maintenance of a mining node 350
    Total customers per dApp per month 1000 Monthly Power Consumption per mining node (500MHs) 1116.00
    SW licensing costs per service component (annual) 1000 Initial market penetration
    Mean number of dApp transactions per user / month 5 Hardware expansion rate w.r.t. num of monthly transactions 0.0100% Annual market penetration rate
    Hosting fee per physical OC / SC node 10
    dApp hosting fee per month 100 Development App Testing Period (months) 3
    Annual personnel Costs for Software Maintenance, Marketing and Support (per dApp) 12,000 Electricity cost per KWh 0.200
    Communication (network) costs per node 480 Interest rate 5.0%
    Computation power per month per node (KWh) 720 Discount Rate 5.0%
    Inflation rate (%) 2.00% Credit (Years) 5
    Annual Personnel Costs for Software Maintenance, Marketing and Support (per Service Component) 48000.00
    Communication (network) costs per service component/dApp provider 600.00
    Annual OC personnel Costs for Software Maintenance, Marketing and Support (per dApp) 1200.00
    Annual marketing costs per app 10000
    dApp Subscribers Penetration Rate 1.00% 3.00% 5.00% 9.00% 18.00% 36.00% 50.00% 65.00% 75.00% 82.00% 87.00% 89.00% 91.00% 93.00% 95.00% 96.00% 97.00% 98.00% 99.00% 100.00%
    dApp Market Penetration Rate 1.00% 5.00% 9.00% 16.00% 30.00% 36.00% 42.00% 46.00% 52.00% 58.00% 62.00% 68.00% 74.00% 78.00% 82.00% 86.00% 90.00% 94.00% 98.00% 100.00%
    2023 2024 2025 2026 2027 2028 2029 2030 2031 2032 2033 2034 2035 2036 2037 2038 2039 2040 2041 2042 2043 Sum
    0 1 2 3 4 5 6 7 8 9 10 11 12 13 14 15 16 17 18 19 20
    4,800.00 36,000.00 108,000.00 345,600.00 1,296,000.00 3,110,400.00 5,040,000.00 7,176,000.00 9,360,000.00 11,414,400.00 12,945,600.00 14,524,800.00 16,161,600.00 17,409,600.00 18,696,000.00 ####### 20,952,000.00 22,108,800.00 23,284,800.00 24,000,000.00 227,788,800.00
    0.00 12,000.00 60,000.00 108,000.00 192,000.00 360,000.00 432,000.00 504,000.00 552,000.00 624,000.00 696,000.00 744,000.00 816,000.00 888,000.00 936,000.00 984,000.00 ####### 1,080,000.00 1,128,000.00 1,176,000.00 1,200,000.00 13,524,000.00
    16,800.00 96,000.00 216,000.00 537,600.00 1,656,000.00 3,542,400.00 5,544,000.00 7,728,000.00 9,984,000.00 12,110,400.00 13,689,600.00 15,340,800.00 17,049,600.00 18,345,600.00 19,680,000.00 ####### 22,032,000.00 23,236,800.00 24,460,800.00 25,200,000.00 241,312,800.00
    Personnel Costs for Software Maintenance, Marketing and Support 12,000 60,000 108,000 192,000 360,000 432,000 504,000 552,000 624,000 696,000 744,000 816,000 888,000 936,000 984,000 1,032,000 1,080,000 1,128,000 1,176,000 1,200,000
    Marketing and commercial activity
    Hardware 125 1,750 3,750 12,375 49,500 94,500 100,500 111,250 113,750 107,000 79,750 82,250 85,250 65,000 67,000 58,250 59,250 60,250 61,250 37,250
    SW Licenses and related costs 3,304.00 18,280.00 52,840.00 166,888.00 623,080.00 1,493,992.00 2,420,200.00 3,445,480.00 4,493,800.00 5,479,912.00 6,214,888.00 6,972,904.00 7,758,568.00 8,357,608.00 8,975,080.00 ####### 10,057,960.00 10,613,224.00 11,177,704.00 11,521,000.00
    Communication costs 4,800 5,280 5,760 8,160 17,760 36,000 55,200 76,800 98,400 119,040 134,400 150,240 166,560 179,040 192,000 203,040 214,560 226,080 237,600 244,800
    Other expenses (power, GAS, rent, etc.) 18,720 20,592 22,464 31,824 69,264 140,400 215,280 299,520 383,760 464,256 524,160 585,936 649,584 698,256 748,800 791,856 836,784 881,712 926,640 954,720
    GENERAL EXPENSES 8% 1,344 7,680 17,280 43,008 132,480 283,392 443,520 618,240 798,720 968,832 1,095,168 1,227,264 1,363,968 1,467,648 1,574,400 1,667,712 1,762,560 1,858,944 1,956,864 2,016,000
    40,293 113,582 210,094 454,255 1,252,084 2,480,284 3,738,700 5,103,290 6,512,430 7,835,040 8,792,366 9,834,594 10,911,930 11,703,552 12,541,280 ####### 14,011,114 14,768,210 15,536,058 15,973,770 155,077,696
    0 0 0 0 0 0 0 0 0 0 0 0 0 0 0 0 0 0 0 0 0
    -23,493 -17,582 5,906 83,345 403,916 1,062,116 1,805,300 2,624,710 3,471,570 4,275,360 4,897,234 5,506,206 6,137,670 6,642,048 7,138,720 7,581,630 8,020,886 8,468,590 8,924,742 9,226,230 86,235,104
    1,205,000 1,205,000 1,205,000 1,205,000 1,205,000 0 0 0 0 0 0 0 0 0 0 0 0 0 0 0 6,025,000
    EBIT (Earnings before Interest) -1,228,493 -1,222,582 -1,199,094 -1,121,655 -801,084 1,062,116 1,805,300 2,624,710 3,471,570 4,275,360 4,897,234 5,506,206 6,137,670 6,642,048 7,138,720 7,581,630 8,020,886 8,468,590 8,924,742 9,226,230 80,210,104
    0 0 0 0 0 0 0 0 0 0 0 0 0 0 0 0 0 0 0 0 0
    -1,228,493 -1,222,582 -1,199,094 -1,121,655 -801,084 1,062,116 1,805,300 2,624,710 3,471,570 4,275,360 4,897,234 5,506,206 6,137,670 6,642,048 7,138,720 ####### 8,020,886 8,468,590 8,924,742 9,226,230 80,210,104
    -6025000.00 -1204404.90 -1175107.65 -1129933.06 -1036235.84 -725566.46 943128.61 1571622.29 2240164.71 2904854.48 3507284.31 3938664.30 4341605.85 4744618.54 5033842.29 5304174.11 ####### 5728216.50 5929362.68 6126217.43 6208988.30 58774303.14
    0 0 0 0 0 0 0 0 0 0 0 0 0 0 0 0 0 0 0 0 0
    0 0 0 0 0 0 0 0 0 0 0 0 0 0 0 0 0 0 0 0 0
    0 0 0 0 0 0 0 0 0 0 0 0 0 0 0 0 0 0 0 0 0
    0 0 0 0 0 0 0 0 0 0 0 0 0 0 0 0 0 0 0 0 0
    0
    -6,025,000 -23,493 -17,582 5,906 83,345 403,916 1,062,116 1,805,300 2,624,710 3,471,570 4,275,360 4,897,234 5,506,206 6,137,670 6,642,048 7,138,720 7,581,630 8,020,886 8,468,590 8,924,742 9,226,230 80,210,104
    -6,025,000 -23032.35 -16899.27 5565.36 76997.90 365839.17 943128.61 1571622.29 2240164.71 2904854.48 3507284.31 3938664.30 4341605.85 4744618.54 5033842.29 5304174.11 ####### 5728216.50 5929362.68 6126217.43 6208988.30
    Net Present Value (NPV) -6,025,000 -6,048,032 -6,064,932 -6,059,366 -5,982,368 -5,616,529 -4,673,401 -3,101,778 -861,614 2,043,241 5,550,525 9,489,189 13,830,795 18,575,414 23,609,256 28,913,430 ####### 40,164,453 46,093,816 52,220,034 58,429,022 58,429,022
    IRR (with amortisation) 16.48%
    -6,025,000 -1204404.90 -1175107.65 -1129933.06 -1036235.84 -725566.46 943128.61 1571622.29 2240164.71 2904854.48 3507284.31 3938664.30 4341605.85 4744618.54 5033842.29 5304174.11 ####### 5728216.50 5929362.68 6126217.43 6208988.30 52,749,303
    -6,025,000 -7,229,405 -8,404,513 -9,534,446 -10,570,681 -11,296,248 -10,353,119 -8,781,497 -6,541,332 -3,636,478 -129,194 3,809,471 8,151,077 12,895,695 17,929,537 23,233,712 ####### 34,484,735 40,414,097 46,540,315 52,749,303 52,749,303
    14.97%
    11.00
    Payback Period
    Financial assumptions
    Net Cash Flow (Net Benefit + Amortisations)
    Net Cash Flow (Net Benefit without amortisation) (€)
    NPV (€)
    Discounted Net Cash Flow
    Loan Management
    Principal
    Loan Interests
    Principal Payment
    Total Loan Payment
    Total Expenses (€)
    Proforma Profit & Loss
    Year
    ONTOCHAIN Services SaaS (transaction fees)
    dApp Hosting Fees
    Total Revenues
    PROJECT (Unleveraged) IRR (% )
    Net Benefit
    Loan repayment (A1)
    Earnings Before Interest, Taxes, Depreciation, Amortization
    Amortizations (€)
    Interest expenses (€)
    Other Data
    Complete ONTOCHAIN solution
    ONTOCHAIN SOLUTION

    View Slide

  16. payback 1.00 Total Service Fees Per App (Present Value)
    IRR 828.22% 3,519,360.00
    NPV 697,408
    payback 7.00
    IRR 21.57% payback 17.00 payback 7.00
    NPV 111,613.10 IRR 3.34% IRR 28.81%
    NPV 6,357,259.05 NPV 1,668,976.31
    payback 6.00 payback 4.00
    IRR 64.66% IRR 108.26%
    NPV 36,356,234 NPV 145,923,326
    dApp Provider
    ONTOCHAIN
    platform
    End-User
    OC Service
    Component Data Provider
    dApp Developer
    Mining Node
    payback 1.00 Total Service Fees Per App (Present Value)
    IRR 828.22% 3,519,360.00
    NPV 697,408
    payback 7.00
    IRR 21.57% payback 9.00 payback 7.00
    NPV 111,613.10 IRR 19.10% IRR 28.81%
    NPV 82,767,684.61 NPV 1,668,976.31
    payback 6.00 payback 4.00
    IRR 49.60% IRR 108.26%
    NPV 18,781,836 NPV 145,923,326
    dApp Provider
    ONTOCHAIN
    platform
    End-User
    OC Service
    Component Data Provider
    dApp Developer
    Mining Node
    ECONOMIC SUSTAINABILITY ANALYSIS RESULTS

    View Slide

  17. ECONOMIC ANALYSIS RESULTS

    View Slide

  18. | ONTOCHAIN.NGI.EU
    ONTOCHAIN TOKEN DESIGN

    View Slide

  19. | ONTOCHAIN.NGI.EU
    ONTOCHAIN ACCESS
    • ONTOCHAIN validators: permissioned (for the time being)/permissionless
    • 3P participation to the platform:
    • Permissioned: subject to contractual agreement
    • Permissionless: what about security/liability? (Staking approach)
    • dApp hosting: open
    • Incurs deployment and hosting fees
    • dApp execution:
    • Open to users – usage-based / subject to subscription
    • Incurs transaction fees

    View Slide

  20. | ONTOCHAIN.NGI.EU
    dApp Example
    • Imagine extended reality (XR) app of the future for civil
    engineering
    • Situational awareness is key
    • Trustworthy identities, data oracles, reputation management,
    trustworthy data sharing, trustworthy data processing, services
    exchange, and more come into play
    • This could be a dApp deployed atop ONTOCHAIN
    • It has some app-specific smart contracts deployed on ONTOCHAIN
    platform
    • These smart contracts or the dApp directly employs also some APIs
    from 3Ps
    • How the APIs from 3Ps are exposed within ONTOCHAIN platform is
    open!

    View Slide

  21. | ONTOCHAIN.NGI.EU
    dApp Implementation: Deeper look
    SC
    SC
    SSC
    ONTOCHAIN 3P
    SC
    server
    SC SC
    SC
    SC
    API call
    dApp

    View Slide

  22. | ONTOCHAIN.NGI.EU
    Key Idea: Access Tokens vs. Coins
    • ONTOCHAIN generates COINS and airdrops them to OC foundation and to 3P
    • dApps employ specific ONTOCHAIN smart contract to generate Access Tokens
    for their users (these tokens provide service access)
    • Tokens expire after some time (1 month)
    • Tokens can represent monthly subscription fees or other usage pattern
    • Tokens are issued by dApp providers (hence represent individual IOU) at the expense of
    COINS
    • 3P announce dynamic tariffs on their transaction fees
    • COINS are traded in the exchange, thus their price is determined by the market
    • Token/coin exchange rate can be determined by the market maker (dApp), so
    that the price of one access token (monthly subscription) in coins, covers
    monthly expenses of dApp provider

    View Slide

  23. | ONTOCHAIN.NGI.EU
    Example
    • Assume 1 COIN costs 5 euro currently
    • According to the prices of the 3Ps employed 4 COINS
    are estimated to be given monthly for transaction fees
    • Then, the dApp provider wants to provide access to its
    app for 35 euro
    • Then, the price for an access token can be set to 7 COINS by
    the dApp provider for end-users

    View Slide

  24. | ONTOCHAIN.NGI.EU
    • Computing resource providers (a) mine coins and (b) receive fees
    • Coin mining occurs at discrete times. ALL COINS are mined by the
    NFT-authorised computing resource providers (validators). Hence,
    computing resource providers create the MONEY SUPPLY
    • MONEY DEMAND (for COINS) is created by dApp providers
    COIN Mining

    View Slide

  25. | ONTOCHAIN.NGI.EU
    ✓ Say User named Alice would like to use 1 month subscription in the dApp called Bob provided by
    dApp provider Bob. The cost stated by Bob is 18 euro
    ✓ Alice deposits to Bob’s bank account 18 euro and in its aftermath Bob issues an invoice or a
    receipt
    ✓ Bob delivers to Alice an Access Token which represents 1 month subscription
    ✓ For creating access tokens, Bob needs to send COINS to the special SC for COIN creation, so as
    to (a) deploy its dApp onto the blockchain and (b) to execute the necessary smart contracts for 1
    month
    ✓ The dApp providers can find OCHC from the open market
    ✓ The very first COINS are received by the computing resource providers who sell them in the
    open market so that dApps providers can buy them. Following both computing resource
    providers and 3Ps who receive COINS for fees (the first also from mining) are the market makers
    of COINS
    The Complete Story Example

    View Slide

  26. | ONTOCHAIN.NGI.EU
    Conclusions – Open Problems
    • ONTOCHAIN seems a very promising business endeavor!
    • Win-win for all stakeholders!
    • ONTOCHAIN platform will have its own COIN
    • Some tokenomics details are still worked out
    • ONTOCHAIN dApps provide access to OC services. What about 3P smart contracts
    that are payable in different cryptos?
    • Real-time exchanges
    • Special access tokens to contain verifiable credentials or signatures for accessing 3P
    services
    • Crypto donations or special fees

    View Slide

  27. | ONTOCHAIN.NGI.EU
    Thank you. Any Questions?
    Contact:
    [email protected]

    View Slide