Upgrade to Pro — share decks privately, control downloads, hide ads and more …

The Truth Is Out There... Monitoring Your Isomorphic Application

Rob
September 10, 2017

The Truth Is Out There... Monitoring Your Isomorphic Application

Going a full circle from web-masters to HTML developers and expert JavaScript engineers, more product teams are closing the loop by working towards full-stack JS teams capable of implementing whole (or a most of) features from scratch and even deploy it to customer facing servers. Stepping up the stack and doing more Node.js to power your back-ends, what could be more important than a good night sleep with proper monitoring set-up?

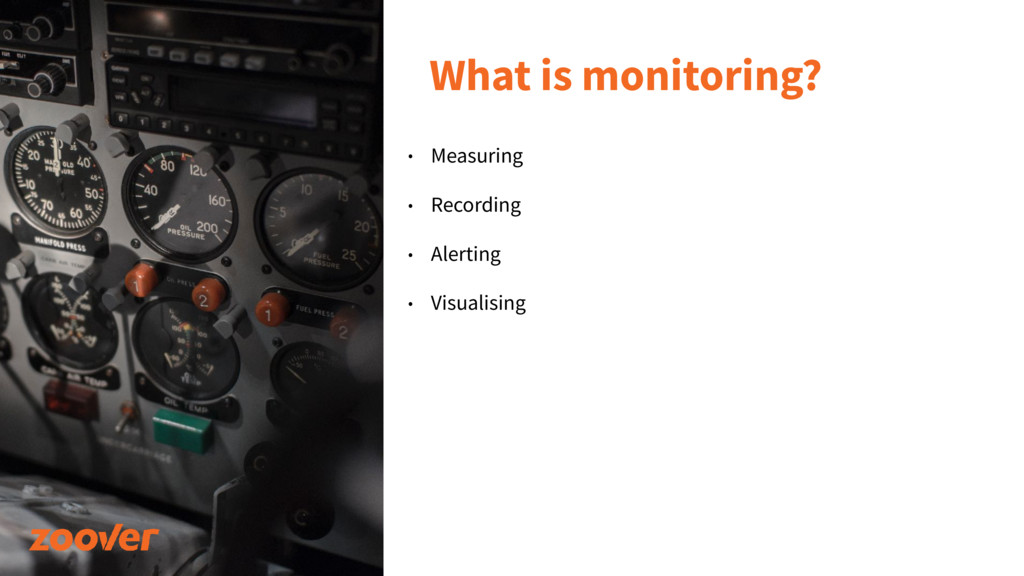
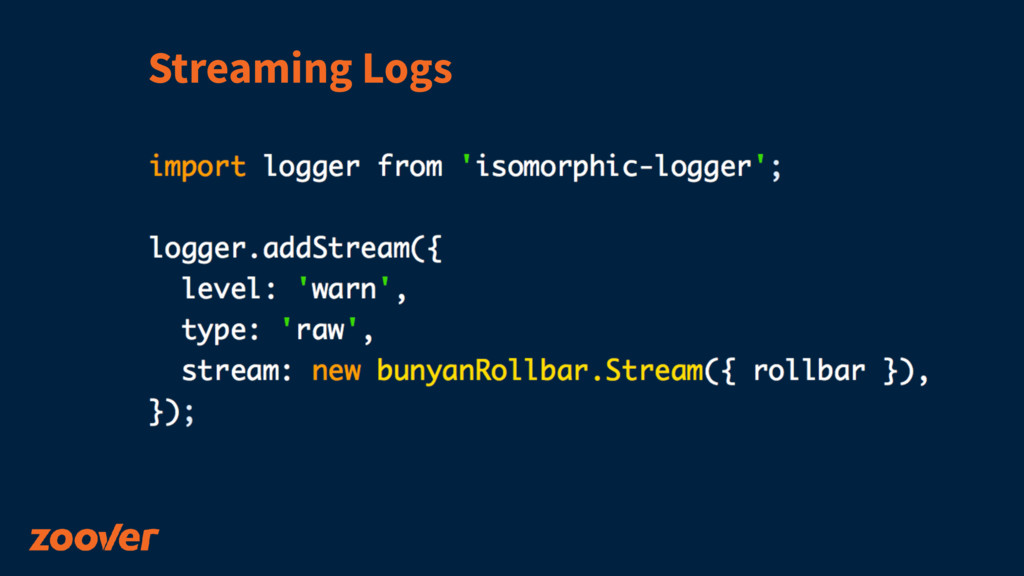
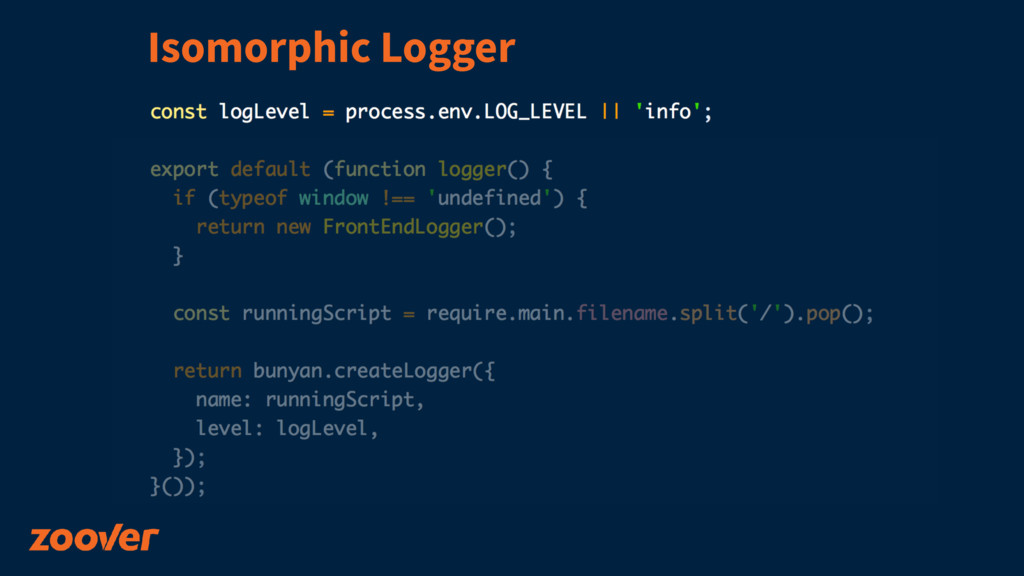
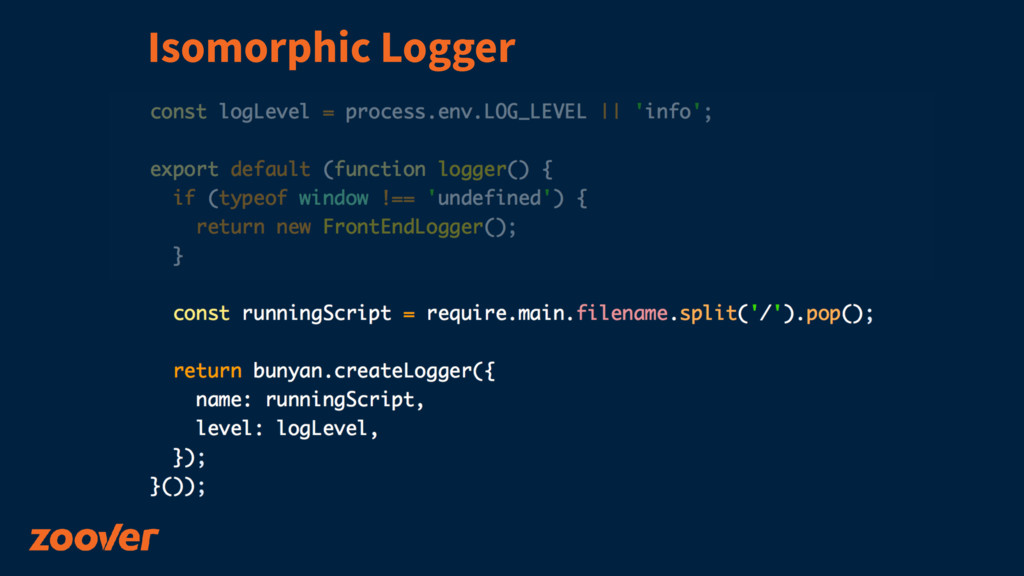
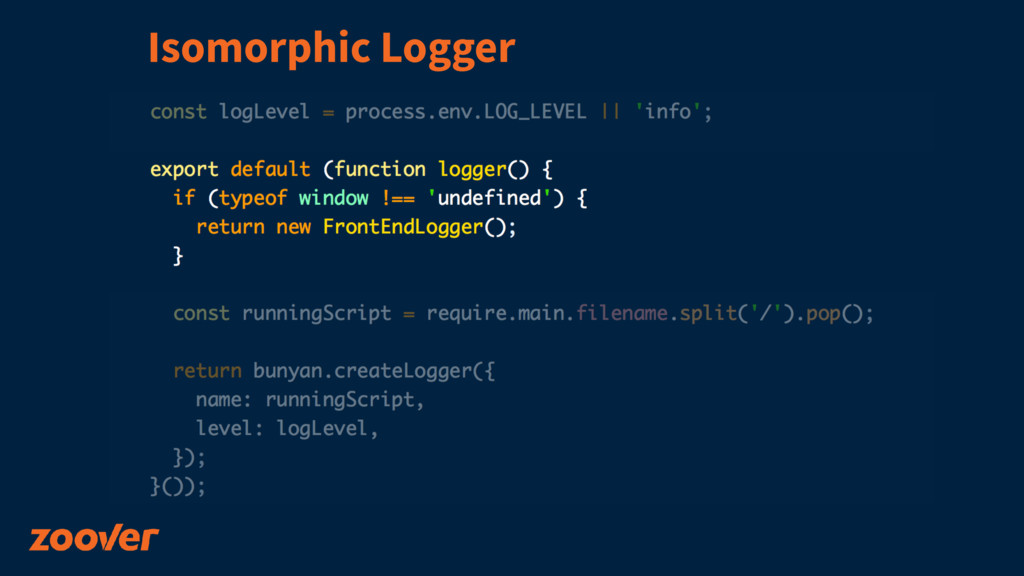
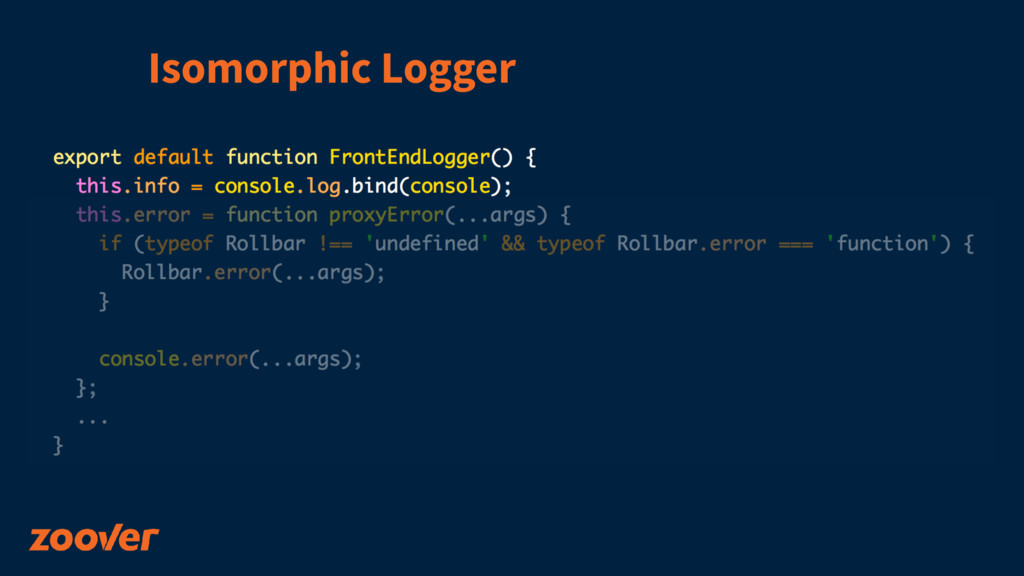
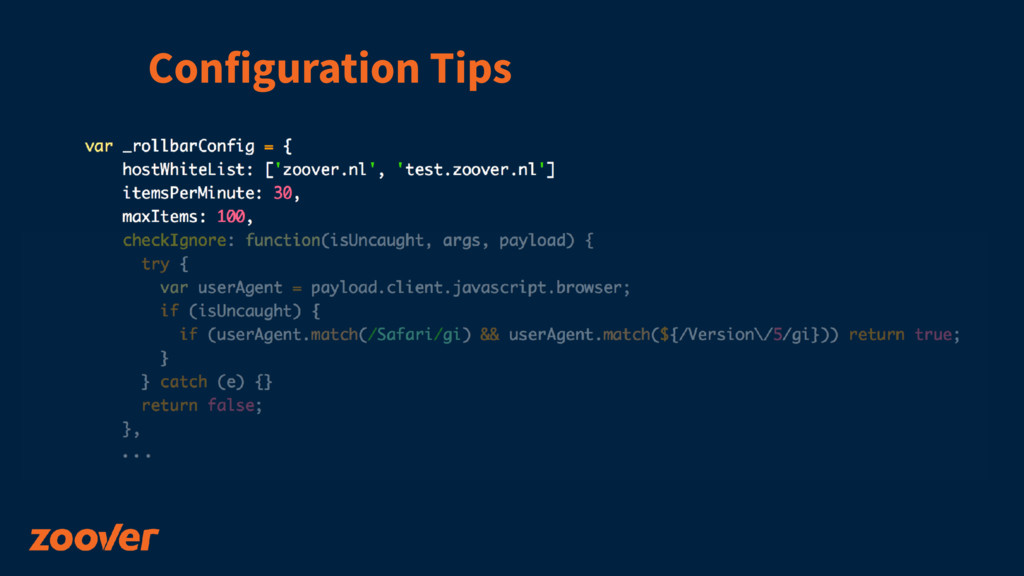
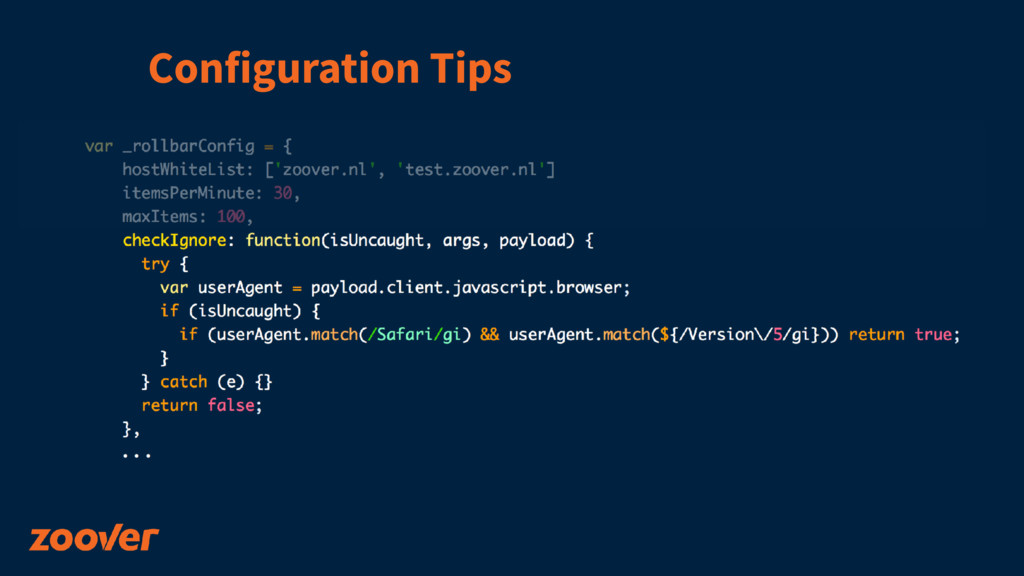
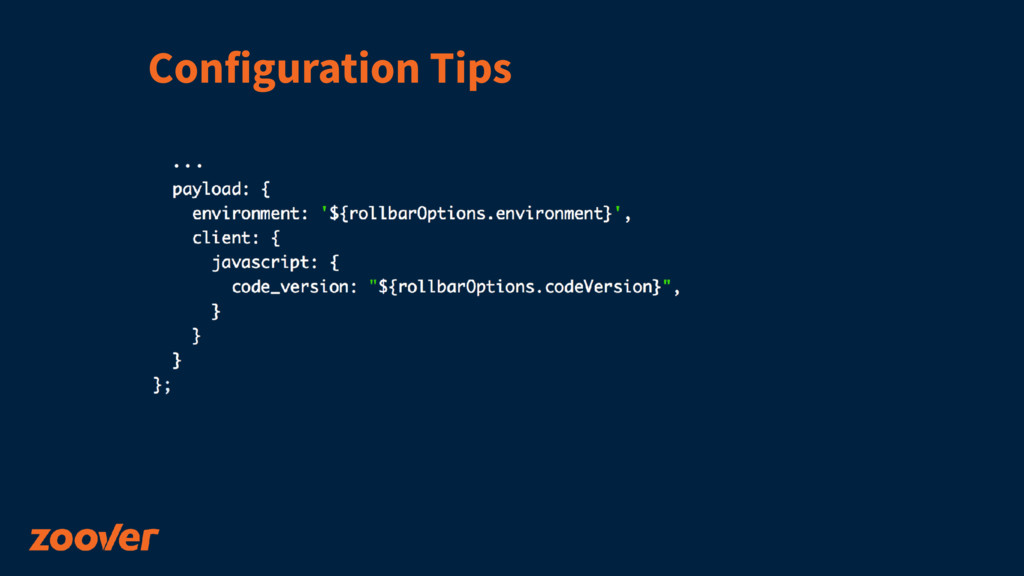
Robert will guide you through monitoring essentials to make sure your isomorphic JS application, or a set of microservices, are performing stable and power your business without hikups. Learn about tools, isomorphic logging solutions, performance and stability measurement approaches and stay confident in your uptimes.

Talk from http://css-minsk-js.by

Rob

September 10, 2017
Tweet

More Decks by Rob

Other Decks in Technology

Transcript

  1. The Truth Is Out There... Robert Haritonov
 Tech Lead @

    Monitoring Your Isomorphic Application
  2. "Our code generates business value when it runs, not when

    we write it" - Coda Hale, "Metrics, metrics, everywhere"
  3. Monitoring: Why should you care? • Be confident in your

    product performance • Stay one step ahead, fix bugs before they affect UX • Good night sleep
  4. What to monitor? • Business and tech performance • Error

    and Success • Throughput and availability metrics
  5. Error tracking services • Rollbar, Sentry, Bugsnag, New Relic... •

    Allow good discovery tools and alerting • Custom and auto-grouping • Source Maps, version tracking, and more...
  6. Client-side logging • Propagate errors to tracking services (or own

    storage) • Log user actions for debugging and analytics • Provide useful context with errors (status code, description) • Keep the stack traces
  7. Bad

  8. Server-side logging • Log in JSON with most context data

    you can get: • Code version, host, timestamp • Request parameters (logging middlewares) • Loggers like Bunyan support streams for log propagation
  9. Notes from the field • International messages • Default Grouping

    could go wrong • Configure events throttling • Google bots from real devices will spawn uncommon errors
  10. "If it could affect your code’s 
 business value, add

    a metric." - Coda Hale, "Metrics, metrics, everywhere"
  11. Tools We Use • Prometheus - metrics aggregator • Grafana

    - data visualizations • Pingdom - uptime monitoring
  12. Prometheus • Exposes `/metrics` endpoint • Supports numerous clients, including

    Node.js • Exports default metrics - CPU, Memory, Event Loop Lag • And custom - Counter, Gauge, Histogram
  13. Custom Metrics • Counter - for values only going up

    (req count, etc) • Gauge - instantaneous value of something (hardware metrics) • Histogram - the statistical distribution of values (req duration, etc)
  14. More Prometheus Exporters • Redis, Memcached • Elasticsearch, PostgreSQL •

    Thumbor (image processing) • Google Analytics Reporting - infinityworks/gar-exporter
  15. Alerting • Pagerduty - alerts aggregations • Duty calendar •

    Integration with Rollbar, Pingdom and other