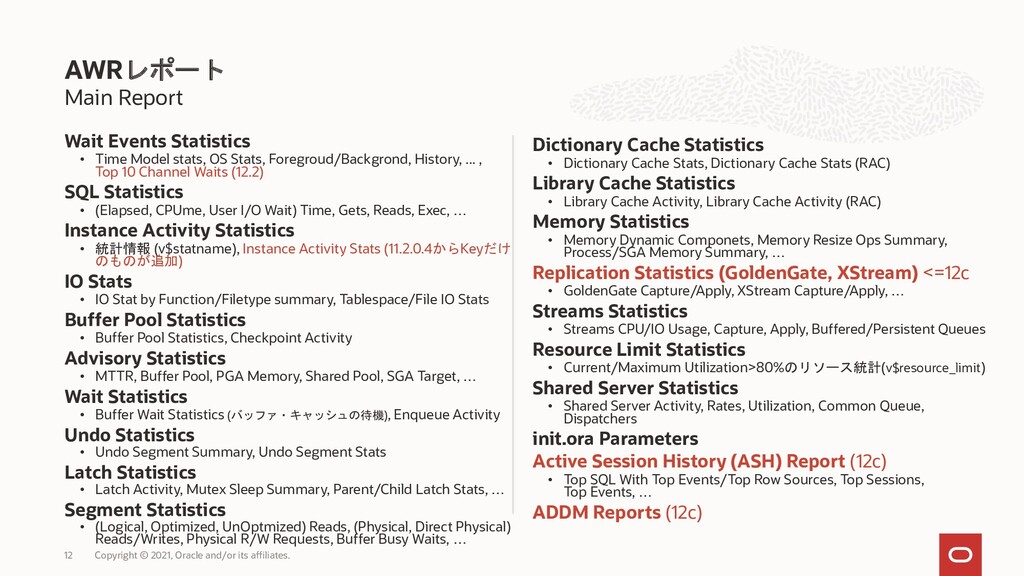
Stats, Foregroud/Backgrond, History, ... , Top 10 Channel Waits (12.2) SQL Statistics • (Elapsed, CPUme, User I/O Wait) Time, Gets, Reads, Exec, … Instance Activity Statistics • 統計情報 (v$statname), Instance Activity Stats (11.2.0.4からKeyだけ のものが追加) IO Stats • IO Stat by Function/Filetype summary, Tablespace/File IO Stats Buffer Pool Statistics • Buffer Pool Statistics, Checkpoint Activity Advisory Statistics • MTTR, Buffer Pool, PGA Memory, Shared Pool, SGA Target, … Wait Statistics • Buffer Wait Statistics (バッファ・キャッシュの待機), Enqueue Activity Undo Statistics • Undo Segment Summary, Undo Segment Stats Latch Statistics • Latch Activity, Mutex Sleep Summary, Parent/Child Latch Stats, … Segment Statistics • (Logical, Optimized, UnOptmized) Reads, (Physical, Direct Physical) Reads/Writes, Physical R/W Requests, Buffer Busy Waits, … Dictionary Cache Statistics • Dictionary Cache Stats, Dictionary Cache Stats (RAC) Library Cache Statistics • Library Cache Activity, Library Cache Activity (RAC) Memory Statistics • Memory Dynamic Componets, Memory Resize Ops Summary, Process/SGA Memory Summary, … Replication Statistics (GoldenGate, XStream) <=12c • GoldenGate Capture/Apply, XStream Capture/Apply, … Streams Statistics • Streams CPU/IO Usage, Capture, Apply, Buffered/Persistent Queues Resource Limit Statistics • Current/Maximum Utilization>80%のリソース統計(v$resource_limit) Shared Server Statistics • Shared Server Activity, Rates, Utilization, Common Queue, Dispatchers init.ora Parameters Active Session History (ASH) Report (12c) • Top SQL With Top Events/Top Row Sources, Top Sessions, Top Events, … ADDM Reports (12c) AWRレポート Copyright © 2021, Oracle and/or its affiliates. 12
![レポートの種類 • AWRレポート (CDBレベルAWRレポート、インスタンス・レベルAWRレポート) • $ORACLE_HOME/rdbms/admin/awrrpt[i].sql • AWRグローバル(RAC)レポート (11.2から) •](https://files.speakerdeck.com/presentations/d32dcf24e9584b68a043ec15e020bd5f/slide_4.jpg)