Upgrade to Pro — share decks privately, control downloads, hide ads and more …

OR Royalties Inc. - Corporate Presentation, Sep...

OR Royalties Inc. - Corporate Presentation, September 2026

OR Royalties Inc. - Corporate Presentation, September 2026

Avatar for OR Royalties Inc.

OR Royalties Inc.

September 02, 2026

Other Decks in Business

Transcript

  1. QUALITY. DISCIPLINE. GROWTH. SEPTEMBER 2026 ORroyalties.com TSX-NYSE | OR Amounts

    presented are in United States Dollars, except where otherwise noted
  2. CAUTIONARY STATEMENTS FORWARD-LOOKING STATEMENTS Certain statements contained in this presentation

    may be deemed “forward-looking statements” within the meaning of the United States Private Securities Litigation Reform Act of 1995, as amended, and “forward-looking information” within the meaning of applicable Canadian securities legislation. Forward-looking statements are statements other than statements of historical fact, that address, without limitation, future events, production estimates of OR Royalties’ assets (including increase of production), the 2026 guidance on GEOs and the 5-year outlook on GEOs included under “Guidance for 2026 and 5-Year Outlook” and other guidance based on disclosure from operators, timely developments of mining properties over which OR Royalties has royalties, streams, offtakes and investments, management’s expectations regarding OR Royalties’ growth, results of operations, estimated future revenues, production costs, carrying value of assets, ability to continue to pay dividend, requirements for additional capital, business prospects and opportunities, future demand for and fluctuation of prices of commodities (including outlook on gold, silver and other commodities) and currency, markets and general market condition, closing of the acquisition of the Murray Brook stream. In addition, statements and estimates (including data in tables) relating to mineral reserves and resources and statements and revised guidance as to gold equivalent ounces are forward-looking statements, as they involve implied assessment, based on certain estimates and assumptions, including the assumptions set out under “Guidance for 2026 and 5-Year Outlook”, and no assurance can be given that the estimates or related guidance will be realized. Forward-looking statements are generally, but not always, identified by the words “expects”, “plans”, “anticipates”, “believes”, “intends”, “estimates”, “projects”, “potential”, “scheduled” and similar expressions or variations (including negative variations), or by statements that events or conditions “will”, “would”, “may”, “could” or “should” occur. Forward-looking statements are subject to known and unknown risks, uncertainties and other factors, most of which are beyond the control of OR Royalties, and actual results may accordingly differ materially from those in forward-looking statements. Such risk factors include, without limitation, (i) with respect to properties in which OR Royalties holds a royalty, stream or other interest; risks related to: (a) the operators of the properties, (b) timely development, permitting, construction, commencement of production, ramp-up (including operating and technical challenges), (c) differences in rate and timing of production from resource estimates or production forecasts by operators, (d) differences in conversion rate from resources to reserves and ability to replace resources, (e) the unfavorable outcome of any challenges or litigation relating to title, permit or license, (f) hazards and uncertainty associated with the business of exploring, development and mining including, but not limited to unusual or unexpected geological and metallurgical conditions, slope failures or cave-ins, flooding and other natural disasters or civil unrest or other uninsured risks; (ii) with respect to other external factors: (a) fluctuations in the prices of the commodities that drive royalties, streams, offtakes and investments held by OR Royalties, (b) fluctuations in the value of the Canadian dollar relative to the U.S. dollar, (c) regulatory changes by national and local governments, including permitting and licensing regimes and taxation policies, regulations and political or economic developments in any of the countries where properties in which OR Royalties holds a royalty, stream or other interest are located or through which they are held, (d) continued availability of capital and financing to OR Royalties or the operators of properties, and general economic, market or business conditions, (e) responses of relevant governments to infectious diseases outbreaks and the effectiveness of such response and the potential impact of such outbreaks on OR Royalties’ business, operations and financial condition, and (f) geopolitical uncertainty; (iii) with respect to internal factors: (a) business opportunities that may or not become available to, or are pursued by OR Royalties, (b) the integration of acquired assets or (c) the determination of OR Royalties’ Passive Foreign Investment Company (“PFIC”) status. The forward-looking statements contained in this presentation are based upon assumptions management believes to be reasonable, including, without limitation: the absence of significant change in the Company’s ongoing income and assets relating to determination of its PFIC status; the absence of any other factors that could cause actions, events or results to differ from those anticipated, estimated or intended and, with respect to properties in which OR Royalties holds a royalty, stream or other interest, (i) the ongoing operation of the properties by the owners or operators of such properties in a manner consistent with past practice and with public disclosure (including forecast of production), (ii) the accuracy of public statements and disclosures made by the owners or operators of such underlying properties (including expectations for the development of underlying properties that are not yet in production), (iii) no adverse development in respect of any significant property, (iv) that statements and estimates relating to mineral reserves and resources by owners and operators are accurate and (v) the implementation of an adequate plan for integration of acquired assets. For additional information on risks, uncertainties and assumptions, please refer to the most recent Annual Information Form of OR Royalties filed on SEDAR+ at www.sedarplus.ca and EDGAR at www.sec.gov which also provides additional general assumptions in connection with these statements. OR Royalties cautions that the foregoing list of risk and uncertainties is not exhaustive. Investors and others should carefully consider the above factors as well as the uncertainties they represent and the risk they entail. OR Royalties believes that the assumptions reflected in those forward-looking statements are reasonable, but no assurance can be given that these expectations will prove to be accurate as actual results and prospective events could materially differ from those anticipated such the forward-looking statements and such forward-looking statements included in this presentation are not guarantee of future performance and should not be unduly relied upon. In this presentation, OR Royalties relies on information publicly disclosed by other issuers and third-parties pertaining to its assets and, therefore, assumes no liability for such third-party public disclosure. These statements speak only as of the date of this presentation. OR Royalties undertakes no obligation to publicly update or revise any forward-looking statements, whether as a result of new information, future events or otherwise, other than as required by applicable law. This presentation includes website addresses and references to additional materials found on third parties’ websites. These websites and information contained on or accessible through these websites are not incorporated by reference into, and do not form a part of, this presentation or any other report or document filed by OR Royalties with the Canadian securities regulators or the SEC, and any references to any websites are intended to be inactive textual references only. SAFE HARBOUR STATEMENT This presentation has been prepared for informational purposes only in order to assist prospective investors in evaluating an investment in OR Royalties Inc. The information related to mining operators provided in this presentation has been sourced from public disclosure. Inquiries regarding this presentation can be made to the senior management of OR Royalties. CAUTIONARY NOTE TO U.S. INVESTORS REGARDING MINERAL RESERVE AND MINERAL RESOURCE ESTIMATES OR Royalties is subject to the reporting requirements of the applicable Canadian securities laws, and as a result, reports its mineral resources and reserves according to Canadian standards. Canadian reporting requirements for disclosure of mineral properties are governed by National Instrument 43-101 (“NI 43-101”). The definitions of NI 43-101 are adopted from those described by the Canadian Institute of Mining, Metallurgy and Petroleum (“CIM”). In a number of cases OR Royalties has disclosed resource and reserve estimates covering properties related to the mining assets that are not based on CIM definitions, but instead have been prepared in reliance upon JORC and S-K 1300 (collectively, the “Acceptable Foreign Codes”). Estimates based on Acceptable Foreign Codes are recognized under NI 43-101 in certain circumstances. New mining disclosure rules under Subpart 1300 of Regulation S-K became mandatory for U.S. reporting companies beginning with the first fiscal year commencing on or after January 1, 2021. CIM definitions are not identical to those of the Acceptable Foreign Codes, the resource and reserve definitions and categories are substantively the same as the CIM definitions mandated in NI 43-101 and will typically result in reporting of substantially similar reserve and resource estimates. Nonetheless, readers are cautioned that there are differences between the terms and definitions of the CIM and the Acceptable Foreign Codes, and there is no assurance that mineral reserves or mineral resources would be identical had the owner or operator prepared the reserve or resource estimates under another code. Mr. Guy Desharnais, PhD., P.Geo., is the qualified person for this presentation as defined by National Instrument 43-101 – Standards of Disclosure for Mineral Projects and has reviewed and verified the technical information contained herein. Mr. Desharnais is an employee of OR Royalties and is non-independent. 2
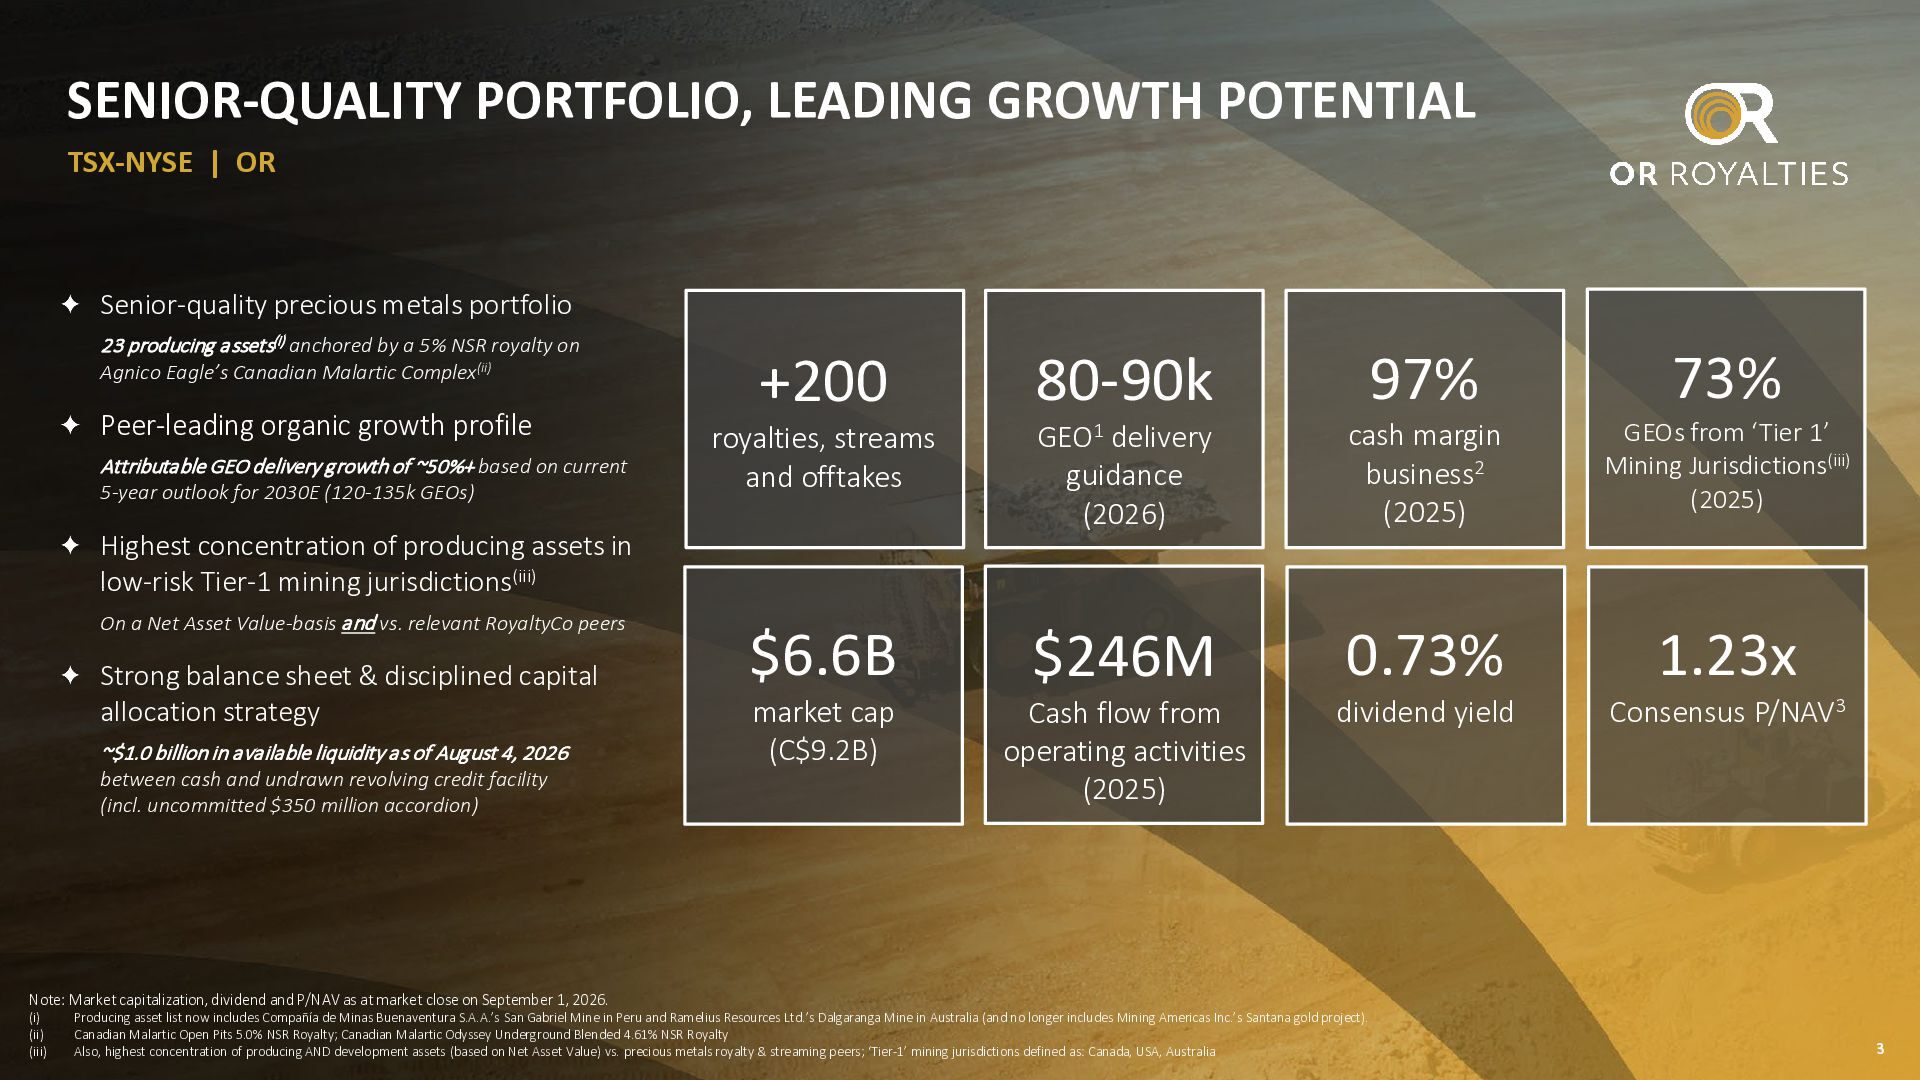
  3. SENIOR-QUALITY PORTFOLIO, LEADING GROWTH POTENTIAL TSX-NYSE | OR Senior-quality precious

    metals portfolio 23 producing assets(i) anchored by a 5% NSR royalty on Agnico Eagle’s Canadian Malartic Complex(ii) Peer-leading organic growth profile Attributable GEO delivery growth of ~50%+ based on current 5-year outlook for 2030E (120-135k GEOs) Strong balance sheet & disciplined capital allocation strategy ~$1.0 billion in available liquidity as of August 4, 2026 between cash and undrawn revolving credit facility (incl. uncommitted $350 million accordion) 73% 80-90k GEO1 delivery guidance (2026) cash margin business2 (2025) GEOs from ‘Tier 1’ Mining Jurisdictions(iii) (2025) $6.6B $246M 0.73% 1.23x royalties, streams and offtakes Highest concentration of producing assets in low-risk Tier-1 mining jurisdictions(iii) On a Net Asset Value-basis and vs. relevant RoyaltyCo peers 97% +200 market cap (C$9.2B) Cash flow from operating activities (2025) dividend yield Consensus P/NAV3 Note: Market capitalization, dividend and P/NAV as at market close on September 1, 2026. (i) (ii) (iii) Producing asset list now includes Compañía de Minas Buenaventura S.A.A.’s San Gabriel Mine in Peru and Ramelius Resources Ltd.’s Dalgaranga Mine in Australia (and no longer includes Mining Americas Inc.’s Santana gold project). Canadian Malartic Open Pits 5.0% NSR Royalty; Canadian Malartic Odyssey Underground Blended 4.61% NSR Royalty Also, highest concentration of producing AND development assets (based on Net Asset Value) vs. precious metals royalty & streaming peers; ‘Tier-1’ mining jurisdictions defined as: Canada, USA, Australia 3
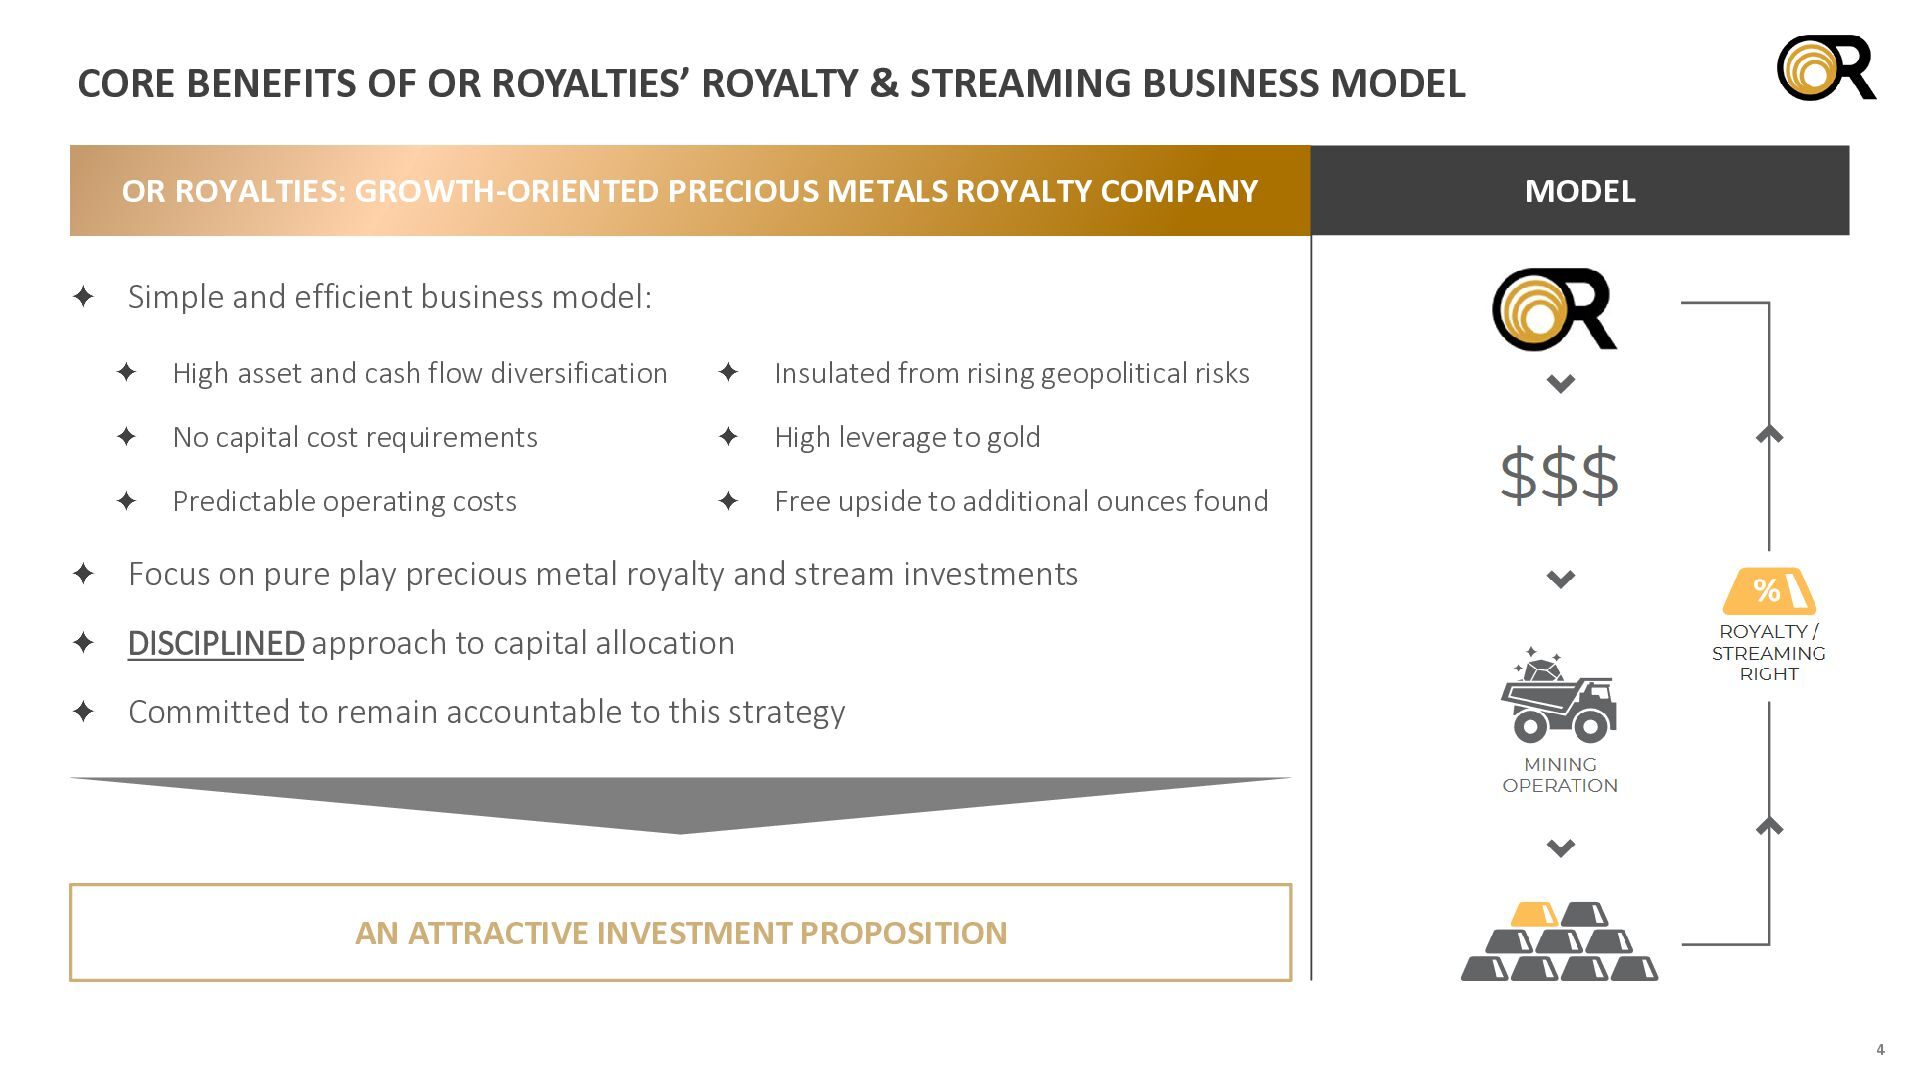
  4. CORE BENEFITS OF OR ROYALTIES’ ROYALTY & STREAMING BUSINESS MODEL

    OR ROYALTIES: GROWTH-ORIENTED PRECIOUS METALS ROYALTY COMPANY MODEL Simple and efficient business model: High asset and cash flow diversification Insulated from rising geopolitical risks No capital cost requirements High leverage to gold Predictable operating costs Free upside to additional ounces found Focus on pure play precious metal royalty and stream investments DISCIPLINED approach to capital allocation Committed to remain accountable to this strategy AN ATTRACTIVE INVESTMENT PROPOSITION 4
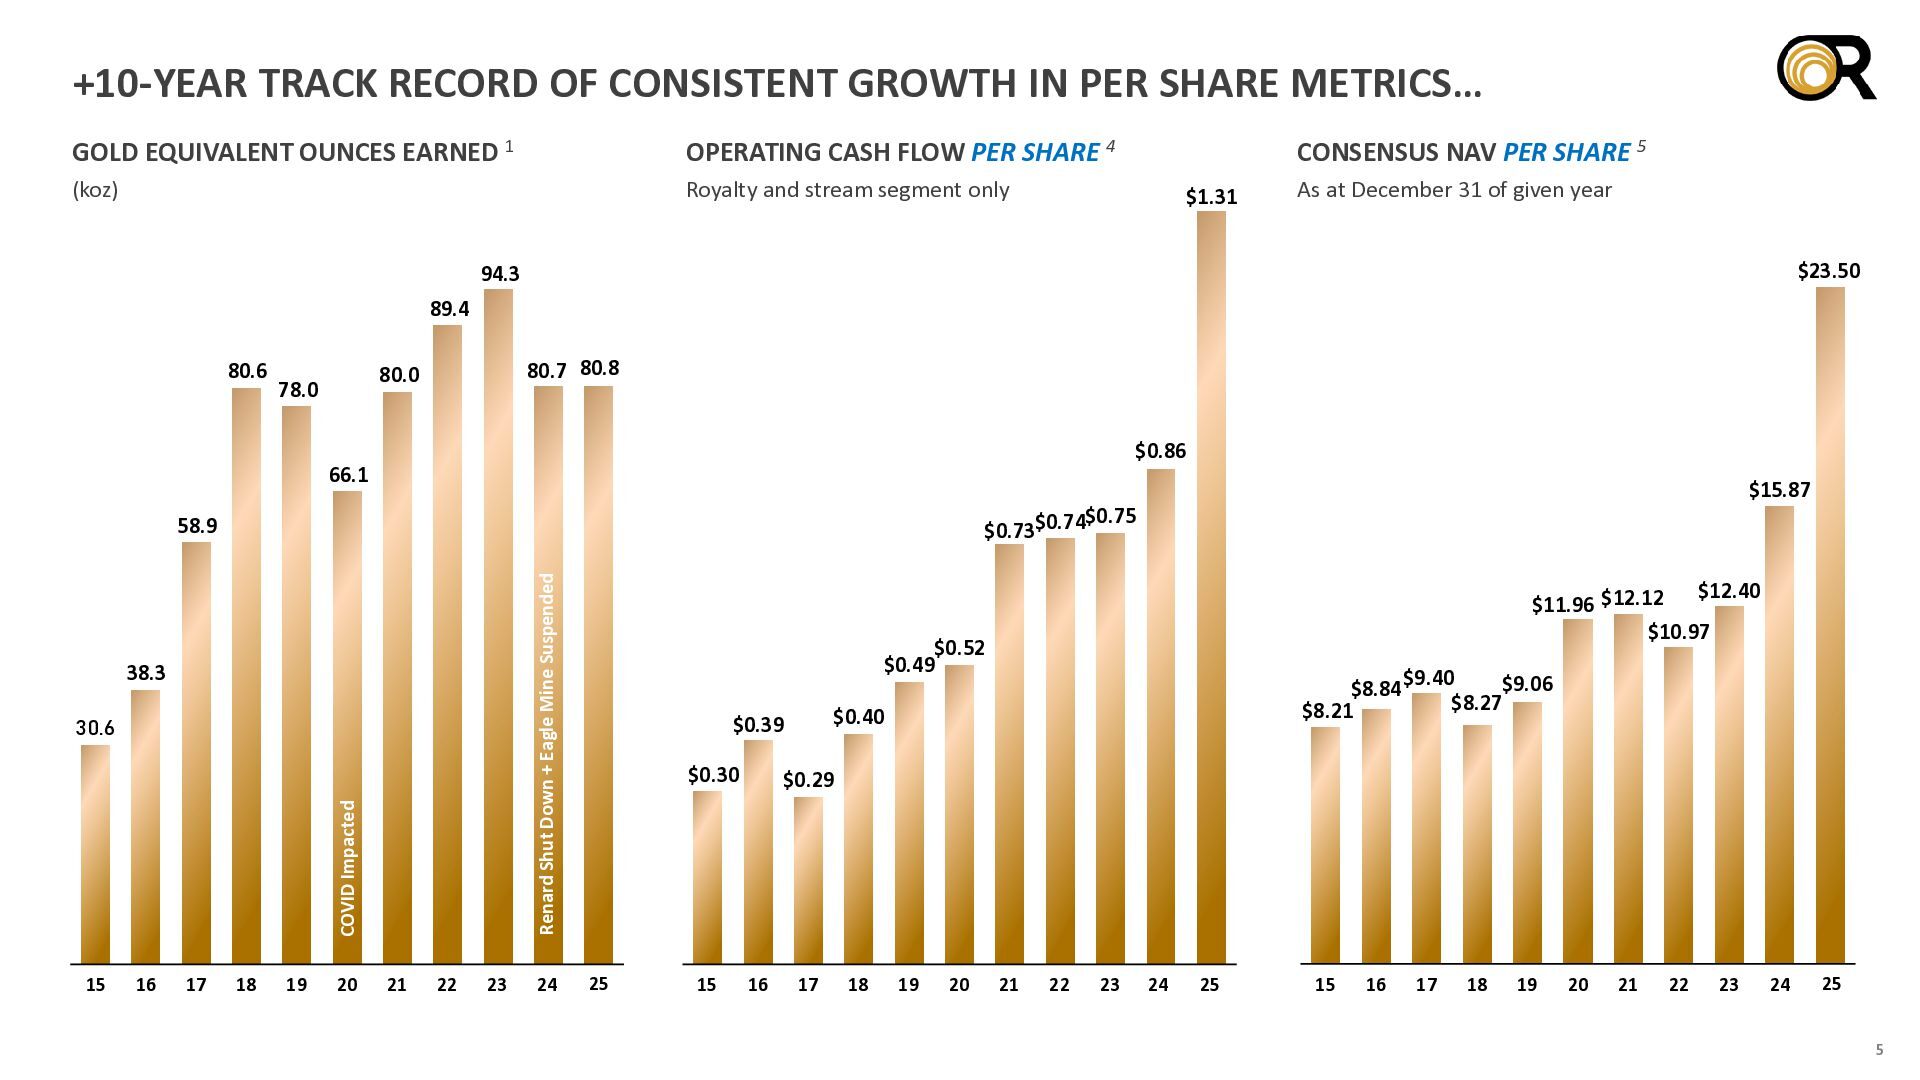
  5. +10-YEAR TRACK RECORD OF CONSISTENT GROWTH IN PER SHARE METRICS…

    GOLD EQUIVALENT OUNCES EARNED 1 OPERATING CASH FLOW PER SHARE 4 (koz) Royalty and stream segment only CONSENSUS NAV PER SHARE 5 $1.31 As at December 31 of given year $23.50 94.3 89.4 80.6 80.7 80.8 80.0 78.0 $0.86 66.1 Renard Shut Down + Eagle Mine Suspended 58.9 38.3 COVID Impacted 30.6 15 16 17 $15.87 $0.75 $0.73$0.74 18 19 20 21 22 23 24 $12.40 $11.96 $12.12 $10.97 $0.52 $0.49 $0.40 $0.39 $0.30 25 15 $8.84 $8.21 $9.40 $9.06 $8.27 15 17 $0.29 16 17 18 19 20 21 22 23 24 25 16 18 19 20 21 22 23 24 25 5
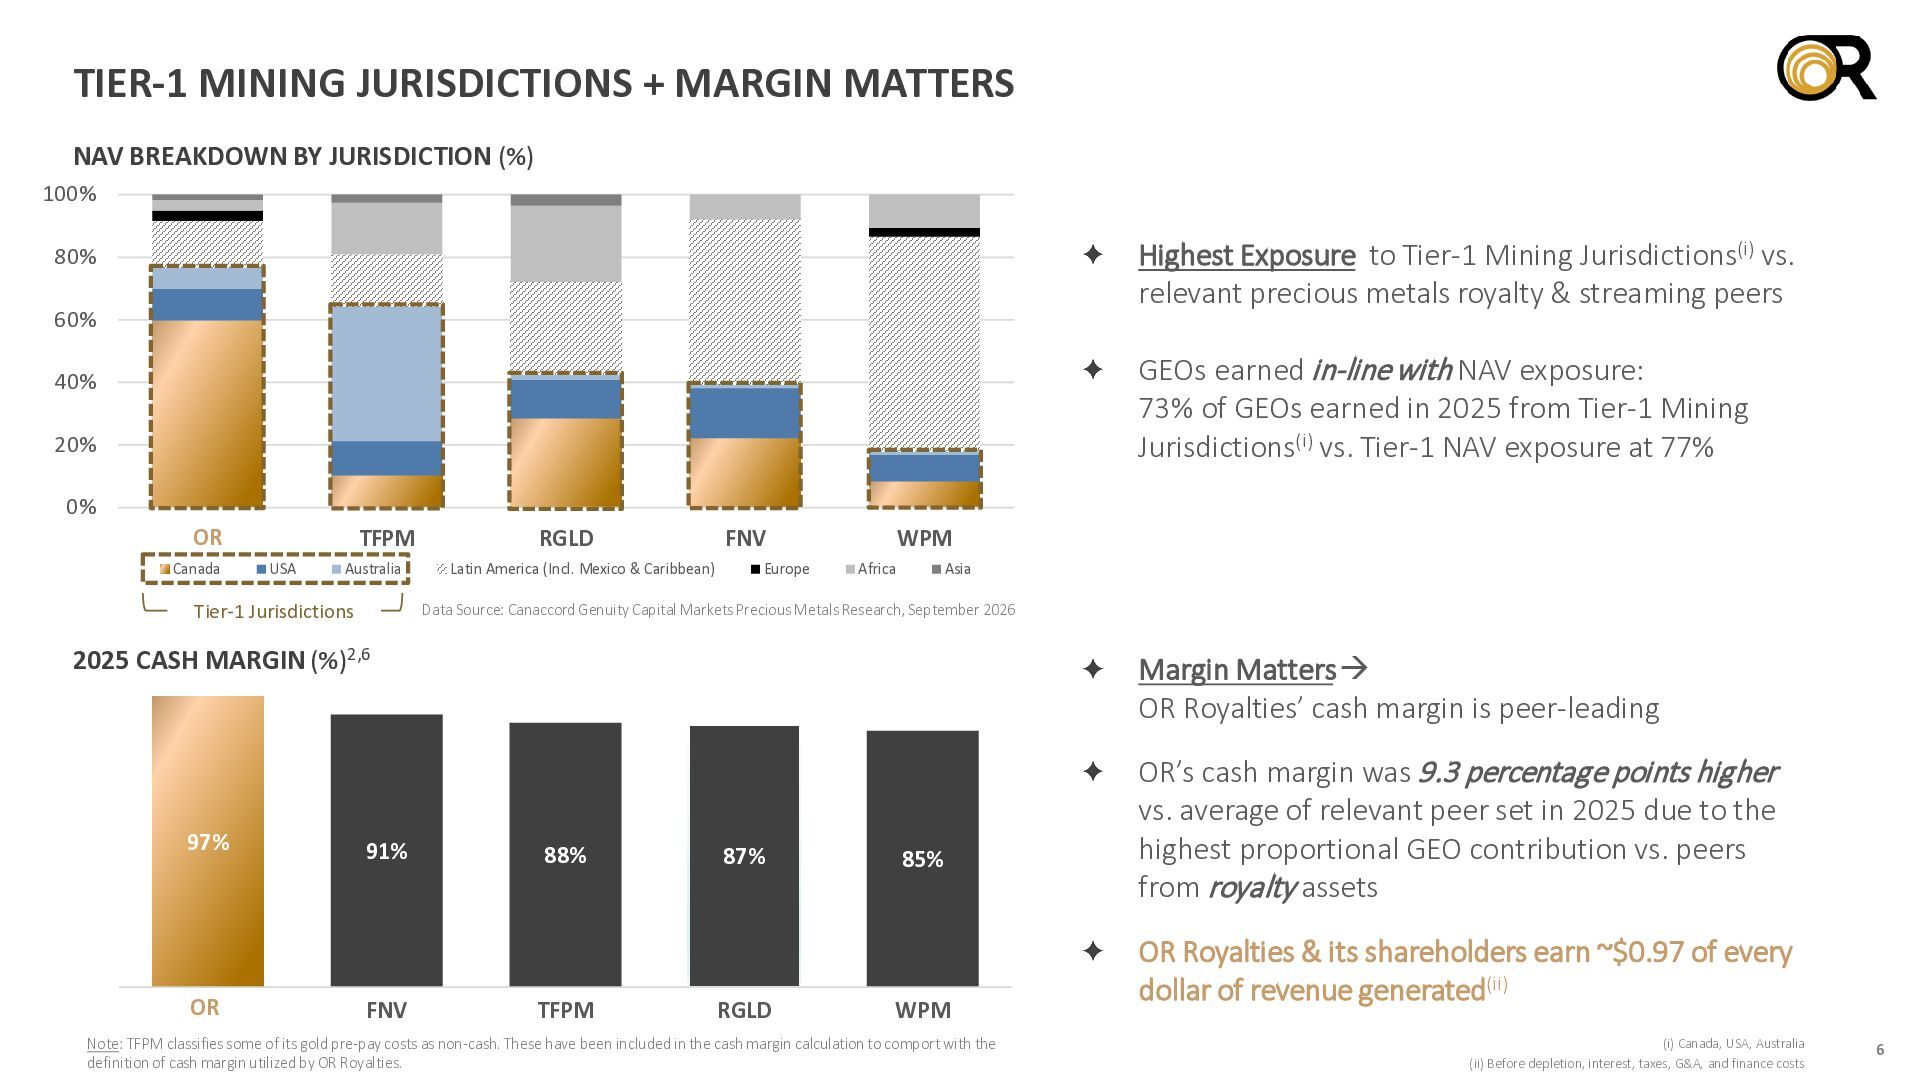
  6. TIER-1 MINING JURISDICTIONS + MARGIN MATTERS NAV BREAKDOWN BY JURISDICTION

    (%) 100% Highest Exposure to Tier-1 Mining Jurisdictions(i) vs. relevant precious metals royalty & streaming peers 80% 60% GEOs earned in-line with NAV exposure: 73% of GEOs earned in 2025 from Tier-1 Mining Jurisdictions(i) vs. Tier-1 NAV exposure at 77% 40% 20% 0% OR Canada TFPM USA Australia Tier-1 Jurisdictions RGLD Latin America (Incl. Mexico & Caribbean) FNV Europe WPM Africa Asia Data Source: Canaccord Genuity Capital Markets Precious Metals Research, September 2026 2025 CASH MARGIN (%)2,6 97% OR OR 91% FNV Margin Matters  OR Royalties’ cash margin is peer-leading 88% TFPM 87% RGLD 85% WPM Note: TFPM classifies some of its gold pre-pay costs as non-cash. These have been included in the cash margin calculation to comport with the definition of cash margin utilized by OR Royalties. OR’s cash margin was 9.3 percentage points higher vs. average of relevant peer set in 2025 due to the highest proportional GEO contribution vs. peers from royalty assets OR Royalties & its shareholders earn ~$0.97 of every dollar of revenue generated(ii) (i) Canada, USA, Australia (ii) Before depletion, interest, taxes, G&A, and finance costs 6
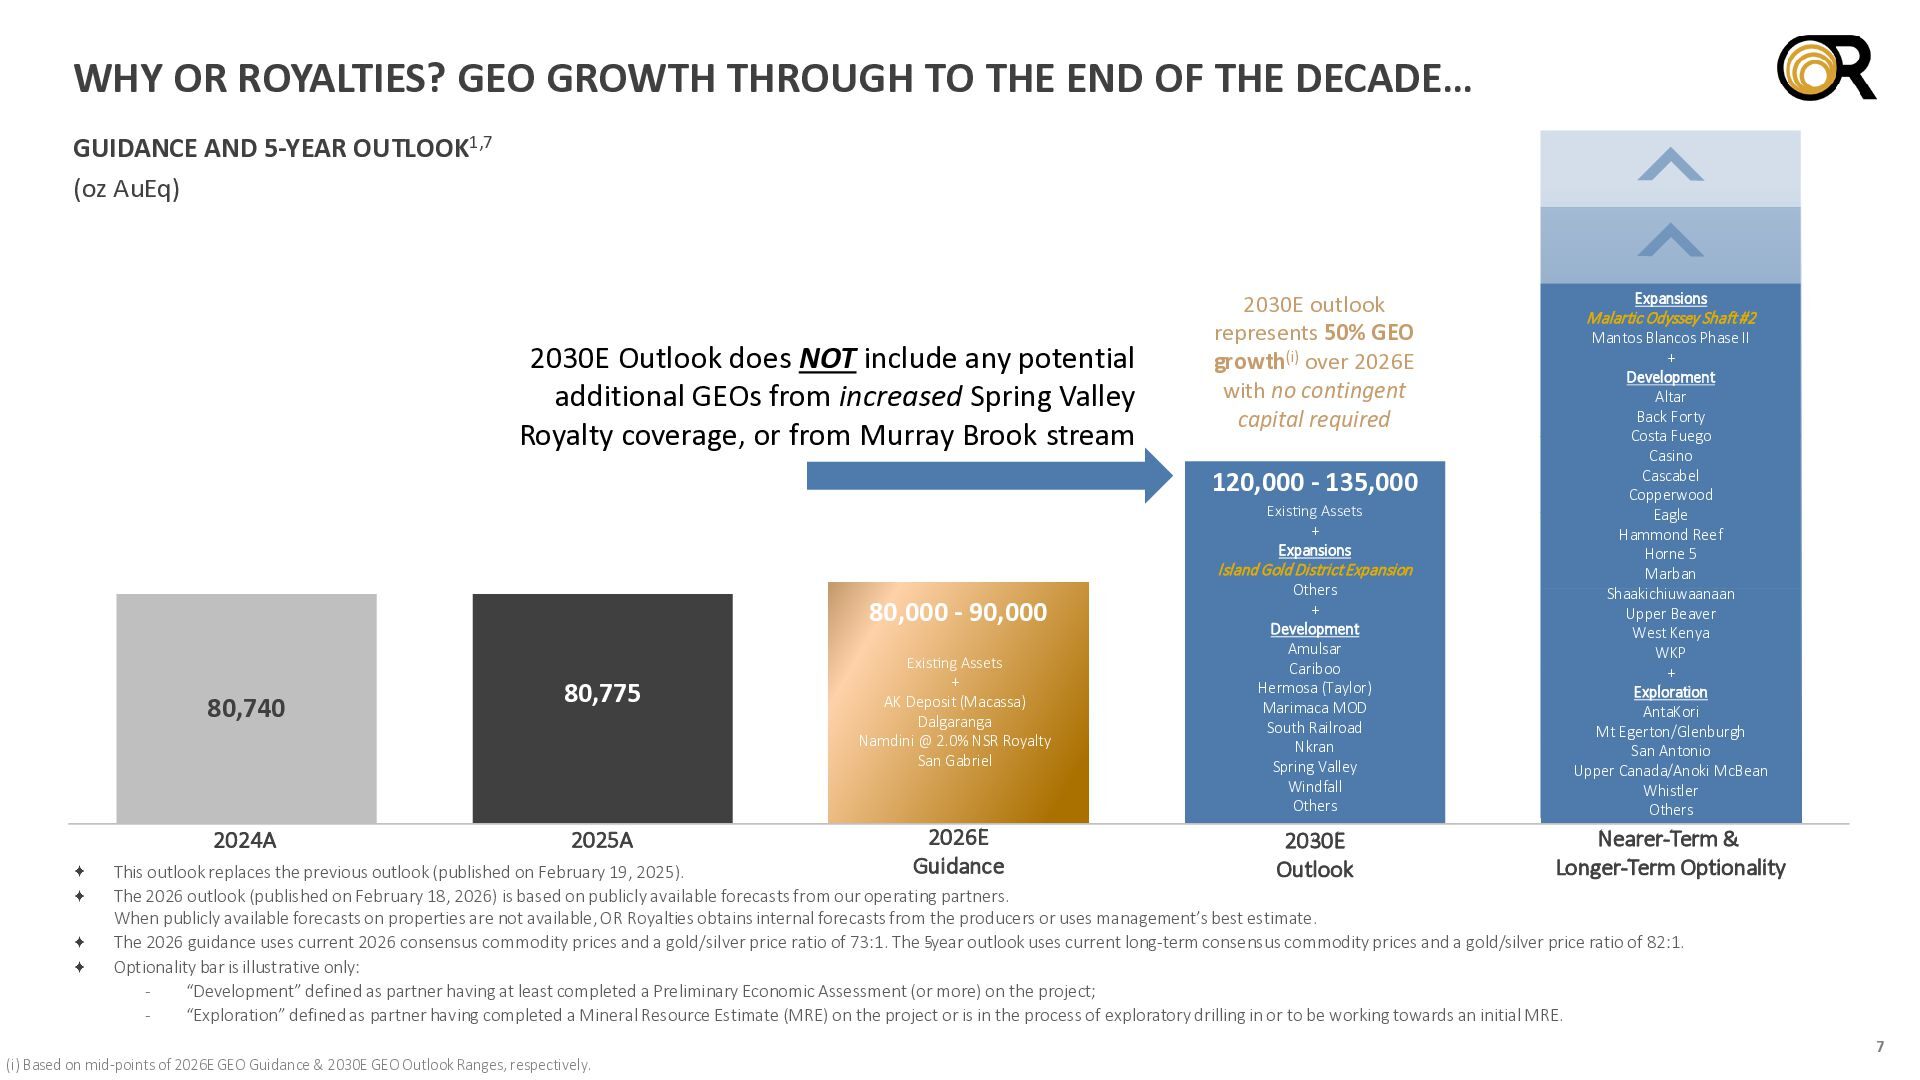
  7. WHY OR ROYALTIES? GEO GROWTH THROUGH TO THE END OF

    THE DECADE… GUIDANCE AND 5-YEAR OUTLOOK1,7 (oz AuEq) 2030E Outlook does NOT include any potential additional GEOs from increased Spring Valley Royalty coverage, or from Murray Brook stream 2030E outlook represents 50% GEO growth(i) over 2026E with no contingent capital required Island Gold District Expansion Others + Development Amulsar Cariboo Hermosa (Taylor) Marimaca MOD South Railroad Nkran Spring Valley Windfall Others Mantos Blancos Phase II + Development Altar Back Forty Costa Fuego Casino Cascabel Copperwood Eagle Hammond Reef Horne 5 Marban Shaakichiuwaanaan Upper Beaver West Kenya WKP + Exploration AntaKori Mt Egerton/Glenburgh San Antonio Upper Canada/Anoki McBean Whistler Others 2030E Outlook Nearer-Term & Longer-Term Optionality 120,000 - 135,000 Existing Assets + Expansions 80,000 - 90,000 80,740 2024A 80,775 2025A Existing Assets + AK Deposit (Macassa) Dalgaranga Namdini @ 2.0% NSR Royalty San Gabriel 2026E Guidance Expansions Malartic Odyssey Shaft #2 This outlook replaces the previous outlook (published on February 19, 2025). The 2026 outlook (published on February 18, 2026) is based on publicly available forecasts from our operating partners. When publicly available forecasts on properties are not available, OR Royalties obtains internal forecasts from the producers or uses management’s best estimate. The 2026 guidance uses current 2026 consensus commodity prices and a gold/silver price ratio of 73:1. The 5-year outlook uses current long-term consensus commodity prices and a gold/silver price ratio of 82:1. Optionality bar is illustrative only: “Development” defined as partner having at least completed a Preliminary Economic Assessment (or more) on the project; “Exploration” defined as partner having completed a Mineral Resource Estimate (MRE) on the project or is in the process of exploratory drilling in or to be working towards an initial MRE. (i) Based on mid-points of 2026E GEO Guidance & 2030E GEO Outlook Ranges, respectively. 7
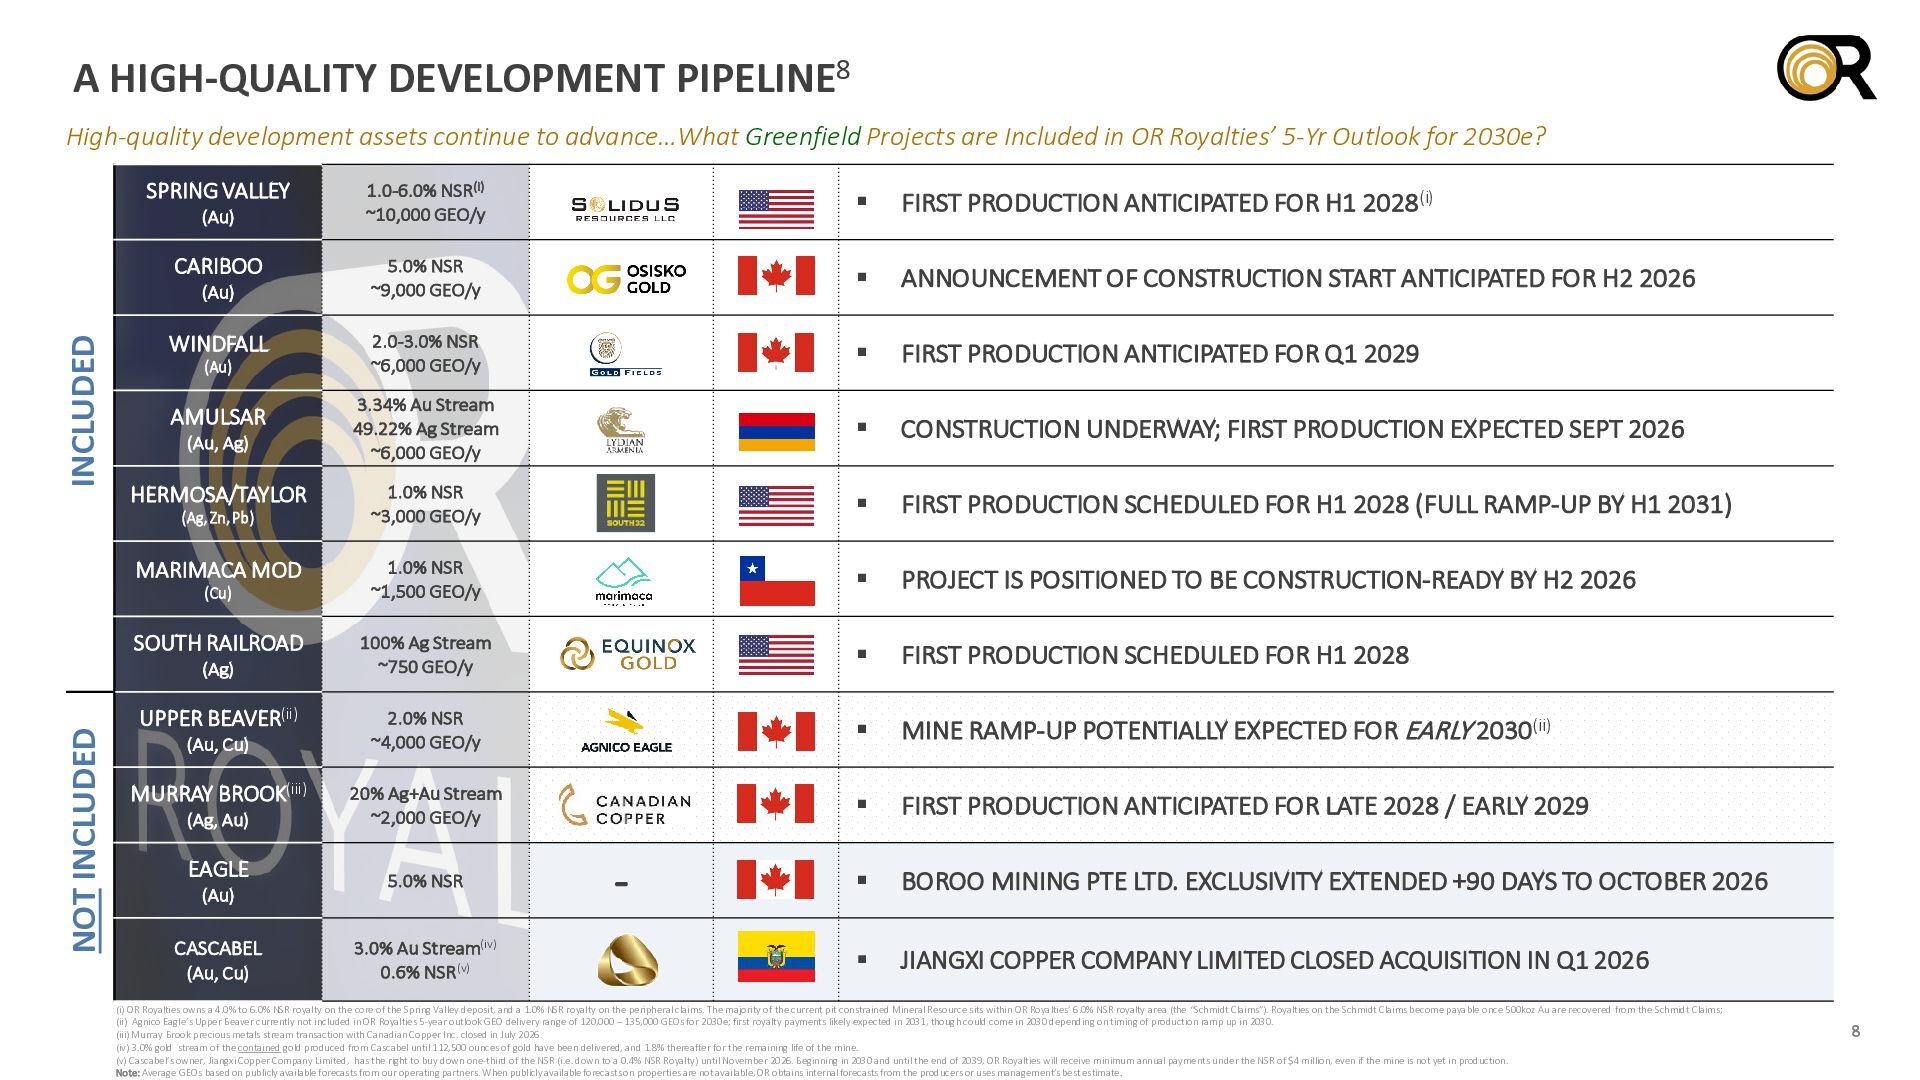
  8. A HIGH-QUALITY DEVELOPMENT PIPELINE8 High-quality development assets continue to advance…What

    Greenfield Projects are Included in OR Royalties’ 5-Yr Outlook for 2030e? SPRING VALLEY 1.0-6.0% NSR(i) ~10,000 GEO/y  FIRST PRODUCTION ANTICIPATED FOR H1 2028(i) CARIBOO 5.0% NSR ~9,000 GEO/y  ANNOUNCEMENT OF CONSTRUCTION START ANTICIPATED FOR H2 2026 WINDFALL 2.0-3.0% NSR ~6,000 GEO/y  FIRST PRODUCTION ANTICIPATED FOR Q1 2029 AMULSAR 3.34% Au Stream 49.22% Ag Stream ~6,000 GEO/y  CONSTRUCTION UNDERWAY; FIRST PRODUCTION EXPECTED SEPT 2026 HERMOSA/TAYLOR 1.0% NSR ~3,000 GEO/y  FIRST PRODUCTION SCHEDULED FOR H1 2028 (FULL RAMP-UP BY H1 2031) MARIMACA MOD 1.0% NSR ~1,500 GEO/y  PROJECT IS POSITIONED TO BE CONSTRUCTION-READY BY H2 2026 SOUTH RAILROAD 100% Ag Stream ~750 GEO/y  FIRST PRODUCTION SCHEDULED FOR H1 2028 UPPER BEAVER(ii) 2.0% NSR ~4,000 GEO/y  MINE RAMP-UP POTENTIALLY EXPECTED FOR EARLY 2030(ii) MURRAY BROOK(iii) (Ag, Au) 20% Ag+Au Stream ~2,000 GEO/y  FIRST PRODUCTION ANTICIPATED FOR LATE 2028 / EARLY 2029 EAGLE 5.0% NSR  BOROO MINING PTE LTD. EXCLUSIVITY EXTENDED +90 DAYS TO OCTOBER 2026  JIANGXI COPPER COMPANY LIMITED CLOSED ACQUISITION IN Q1 2026 (Au) INCLUDED (Au) (Au) (Au, Ag) (Ag, Zn, Pb) (Cu) NOT INCLUDED (Ag) (Au, Cu) (Au) CASCABEL (Au, Cu) 3.0% Au Stream(iv) 0.6% NSR(v) - (i) OR Royalties owns a 4.0% to 6.0% NSR royalty on the core of the Spring Valley deposit, and a 1.0% NSR royalty on the peripheral claims. The majority of the current pit constrained Mineral Resource sits within OR Royalties’ 6.0% NSR royalty area (the “Schmidt Claims”). Royalties on the Schmidt Claims become payable once 500koz Au are recovered from the Schmidt Claims; (ii) Agnico Eagle’s Upper Beaver currently not included in OR Royalties 5-year outlook GEO delivery range of 120,000 – 135,000 GEOs for 2030e; first royalty payments likely expected in 2031, though could come in 2030 depending on timing of production ramp up in 2030. (iii) Murray Brook precious metals stream transaction with Canadian Copper Inc. closed in July 2026. (iv) 3.0% gold stream of the contained gold produced from Cascabel until 112,500 ounces of gold have been delivered, and 1.8% thereafter for the remaining life of the mine. (v) Cascabel’s owner, Jiangxi Copper Company Limited, has the right to buy down one-third of the NSR (i.e. down to a 0.4% NSR Royalty) until November 2026. Beginning in 2030 and until the end of 2039, OR Royalties will receive minimum annual payments under the NSR of $4 million, even if the mine is not yet in production. Note: Average GEOs based on publicly available forecasts from our operating partners. When publicly available forecasts on properties are not available, OR obtains internal forecasts from the producers or uses management’s best estimate. 8
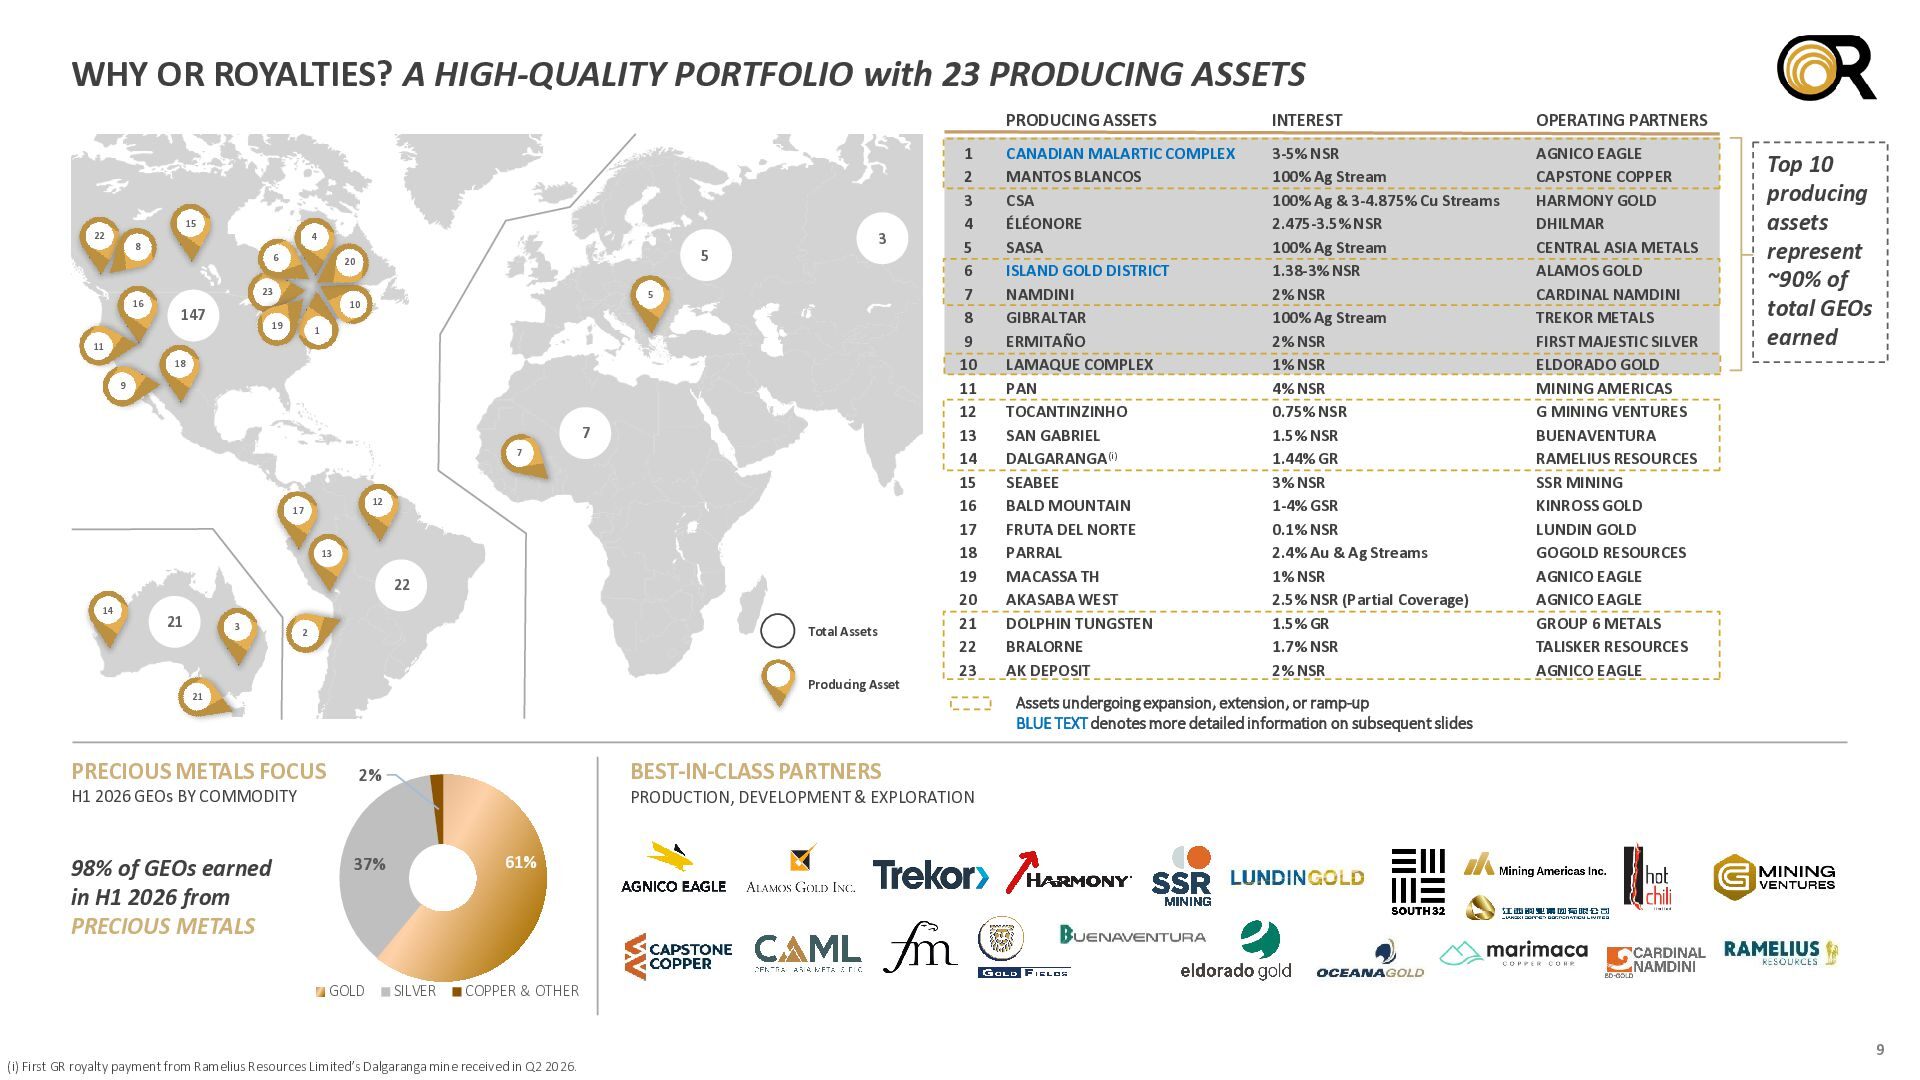
  9. WHY OR ROYALTIES? A HIGH-QUALITY PORTFOLIO with 23 PRODUCING ASSETS

    15 22 16 3 4 8 6 23 147 5 20 5 10 19 1 11 18 9 7 7 12 17 13 22 14 21 3 Total Assets 2 Producing Asset 21 PRECIOUS METALS FOCUS 2% 98% of GEOs earned in H1 2026 from PRECIOUS METALS 37% H1 2026 GEOs BY COMMODITY GOLD 1 2 3 4 5 6 7 8 9 10 11 12 13 14 15 16 17 18 19 20 21 22 23 PRODUCING ASSETS INTEREST OPERATING PARTNERS CANADIAN MALARTIC COMPLEX MANTOS BLANCOS CSA ÉLÉONORE SASA ISLAND GOLD DISTRICT NAMDINI GIBRALTAR ERMITAÑO LAMAQUE COMPLEX PAN TOCANTINZINHO SAN GABRIEL DALGARANGA(i) SEABEE BALD MOUNTAIN FRUTA DEL NORTE PARRAL MACASSA TH AKASABA WEST DOLPHIN TUNGSTEN BRALORNE AK DEPOSIT 3-5% NSR 100% Ag Stream 100% Ag & 3-4.875% Cu Streams 2.475-3.5% NSR 100% Ag Stream 1.38-3% NSR 2% NSR 100% Ag Stream 2% NSR 1% NSR 4% NSR 0.75% NSR 1.5% NSR 1.44% GR 3% NSR 1-4% GSR 0.1% NSR 2.4% Au & Ag Streams 1% NSR 2.5% NSR (Partial Coverage) 1.5% GR 1.7% NSR 2% NSR AGNICO EAGLE CAPSTONE COPPER Total Assets HARMONY GOLD DHILMAR CENTRAL ASIA METALS ALAMOS GOLD Producing Asset CARDINAL NAMDINI TREKOR METALS FIRST MAJESTIC SILVER ELDORADO GOLD MINING AMERICAS G MINING VENTURES BUENAVENTURA RAMELIUS RESOURCES SSR MINING KINROSS GOLD LUNDIN GOLD GOGOLD RESOURCES AGNICO EAGLE AGNICO EAGLE GROUP 6 METALS TALISKER RESOURCES AGNICO EAGLE Top 10 producing assets represent ~90% of total GEOs earned Assets undergoing expansion, extension, or ramp-up BLUE TEXT denotes more detailed information on subsequent slides BEST-IN-CLASS PARTNERS PRODUCTION, DEVELOPMENT & EXPLORATION 61% SILVER COPPER & OTHER (i) First GR royalty payment from Ramelius Resources Limited’s Dalgaranga mine received in Q2 2026. 9
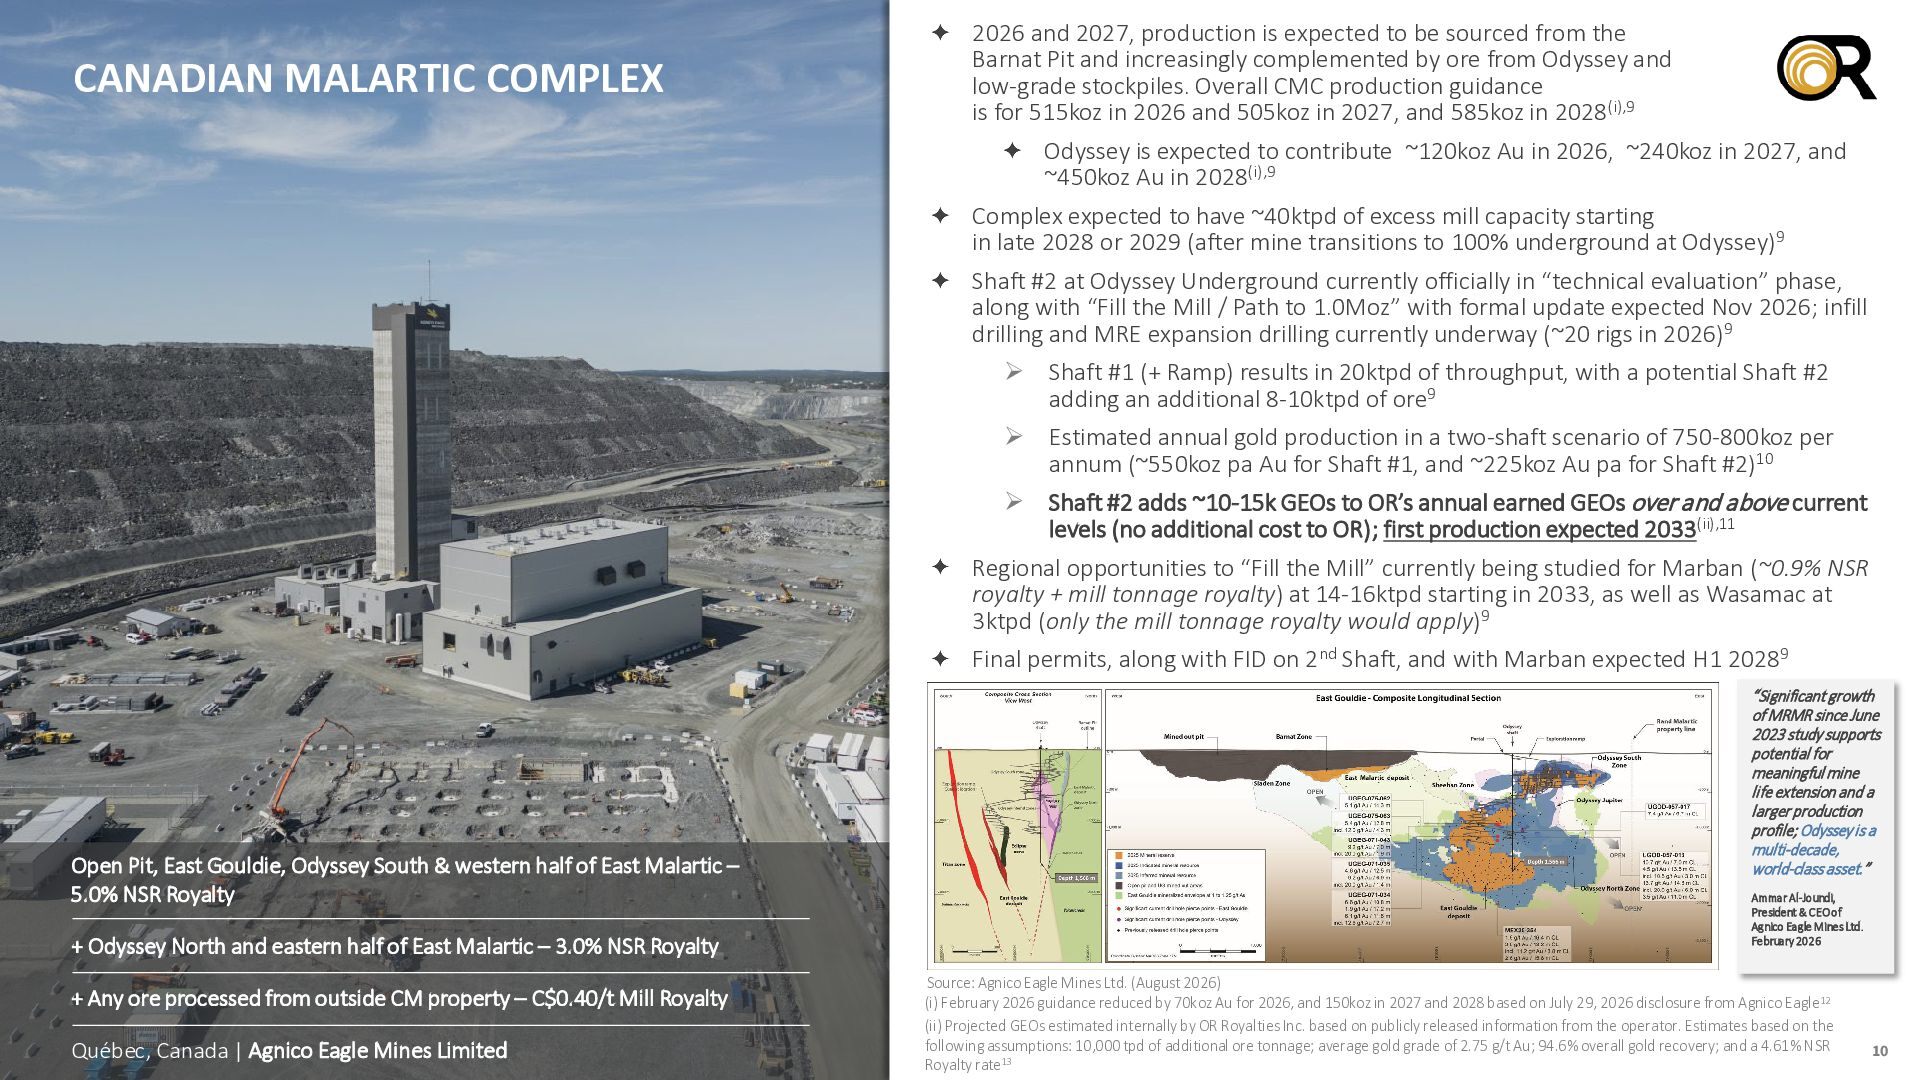
  10. CANADIAN MALARTIC COMPLEX Open Pit, East Gouldie, Odyssey South &

    western half of East Malartic – 5.0% NSR Royalty + Odyssey North and eastern half of East Malartic – 3.0% NSR Royalty + Any ore processed from outside CM property – C$0.40/t Mill Royalty Québec, Canada | Agnico Eagle Mines Limited 2026 and 2027, production is expected to be sourced from the Barnat Pit and increasingly complemented by ore from Odyssey and low-grade stockpiles. Overall CMC production guidance is for 515koz in 2026 and 505koz in 2027, and 585koz in 2028(i),9 Odyssey is expected to contribute ~120koz Au in 2026, ~240koz in 2027, and ~450koz Au in 2028(i),9 Complex expected to have ~40ktpd of excess mill capacity starting in late 2028 or 2029 (after mine transitions to 100% underground at Odyssey)9 Shaft #2 at Odyssey Underground currently officially in “technical evaluation” phase, along with “Fill the Mill / Path to 1.0Moz” with formal update expected Nov 2026; infill drilling and MRE expansion drilling currently underway (~20 rigs in 2026)9  Shaft #1 (+ Ramp) results in 20ktpd of throughput, with a potential Shaft #2 adding an additional 8-10ktpd of ore9  Estimated annual gold production in a two-shaft scenario of 750-800koz per annum (~550koz pa Au for Shaft #1, and ~225koz Au pa for Shaft #2)10  Shaft #2 adds ~10-15k GEOs to OR’s annual earned GEOs over and above current levels (no additional cost to OR); first production expected 2033(ii),11 Regional opportunities to “Fill the Mill” currently being studied for Marban (~0.9% NSR royalty + mill tonnage royalty) at 14-16ktpd starting in 2033, as well as Wasamac at 3ktpd (only the mill tonnage royalty would apply)9 Final permits, along with FID on 2nd Shaft, and with Marban expected H1 20289 “Significant growth of MRMR since June 2023 study supports potential for meaningful mine life extension and a larger production profile; Odyssey is a multi-decade, world-class asset.” Ammar Al-Joundi, President & CEO of Agnico Eagle Mines Ltd. February 2026 Source: Agnico Eagle Mines Ltd. (August 2026) (i) February 2026 guidance reduced by 70koz Au for 2026, and 150koz in 2027 and 2028 based on July 29, 2026 disclosure from Agnico Eagle12 (ii) Projected GEOs estimated internally by OR Royalties Inc. based on publicly released information from the operator. Estimates based on the following assumptions: 10,000 tpd of additional ore tonnage; average gold grade of 2.75 g/t Au; 94.6% overall gold recovery; and a 4.61% NSR Royalty rate13 10
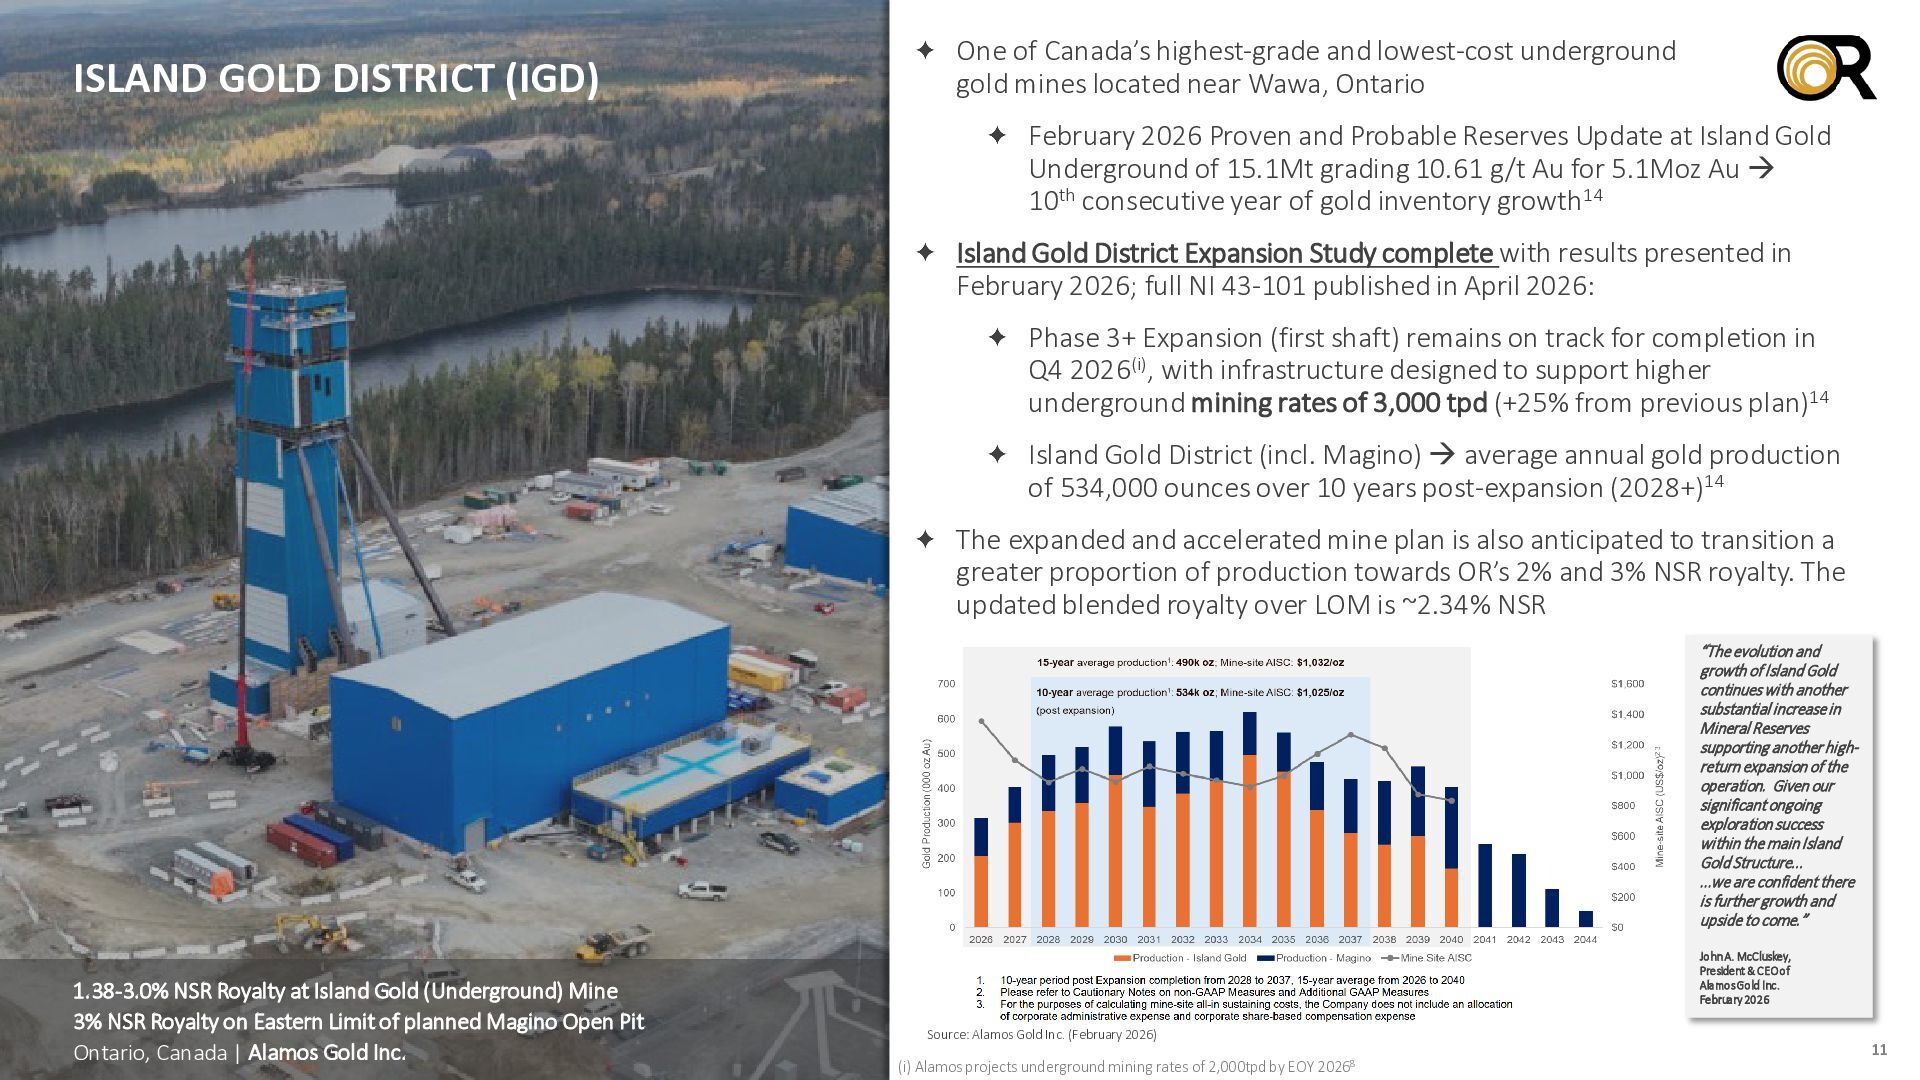
  11. ISLAND GOLD DISTRICT (IGD) One of Canada’s highest-grade and lowest-cost

    underground gold mines located near Wawa, Ontario February 2026 Proven and Probable Reserves Update at Island Gold Underground of 15.1Mt grading 10.61 g/t Au for 5.1Moz Au  10th consecutive year of gold inventory growth14 Island Gold District Expansion Study complete with results presented in February 2026; full NI 43-101 published in April 2026: Phase 3+ Expansion (first shaft) remains on track for completion in Q4 2026(i), with infrastructure designed to support higher underground mining rates of 3,000 tpd (+25% from previous plan)14 Island Gold District (incl. Magino)  average annual gold production of 534,000 ounces over 10 years post-expansion (2028+)14 The expanded and accelerated mine plan is also anticipated to transition a greater proportion of production towards OR’s 2% and 3% NSR royalty. The updated blended royalty over LOM is ~2.34% NSR “The evolution and growth of Island Gold continues with another substantial increase in Mineral Reserves supporting another highreturn expansion of the operation. Given our significant ongoing exploration success within the main Island Gold Structure… …we are confident there is further growth and upside to come.” 1.38-3.0% NSR Royalty at Island Gold (Underground) Mine 3% NSR Royalty on Eastern Limit of planned Magino Open Pit Ontario, Canada | Alamos Gold Inc. John A. McCluskey, President & CEO of Alamos Gold Inc. February 2026 Source: Alamos Gold Inc. (February 2026) (i) Alamos projects underground mining rates of 2,000tpd by EOY 20268 11
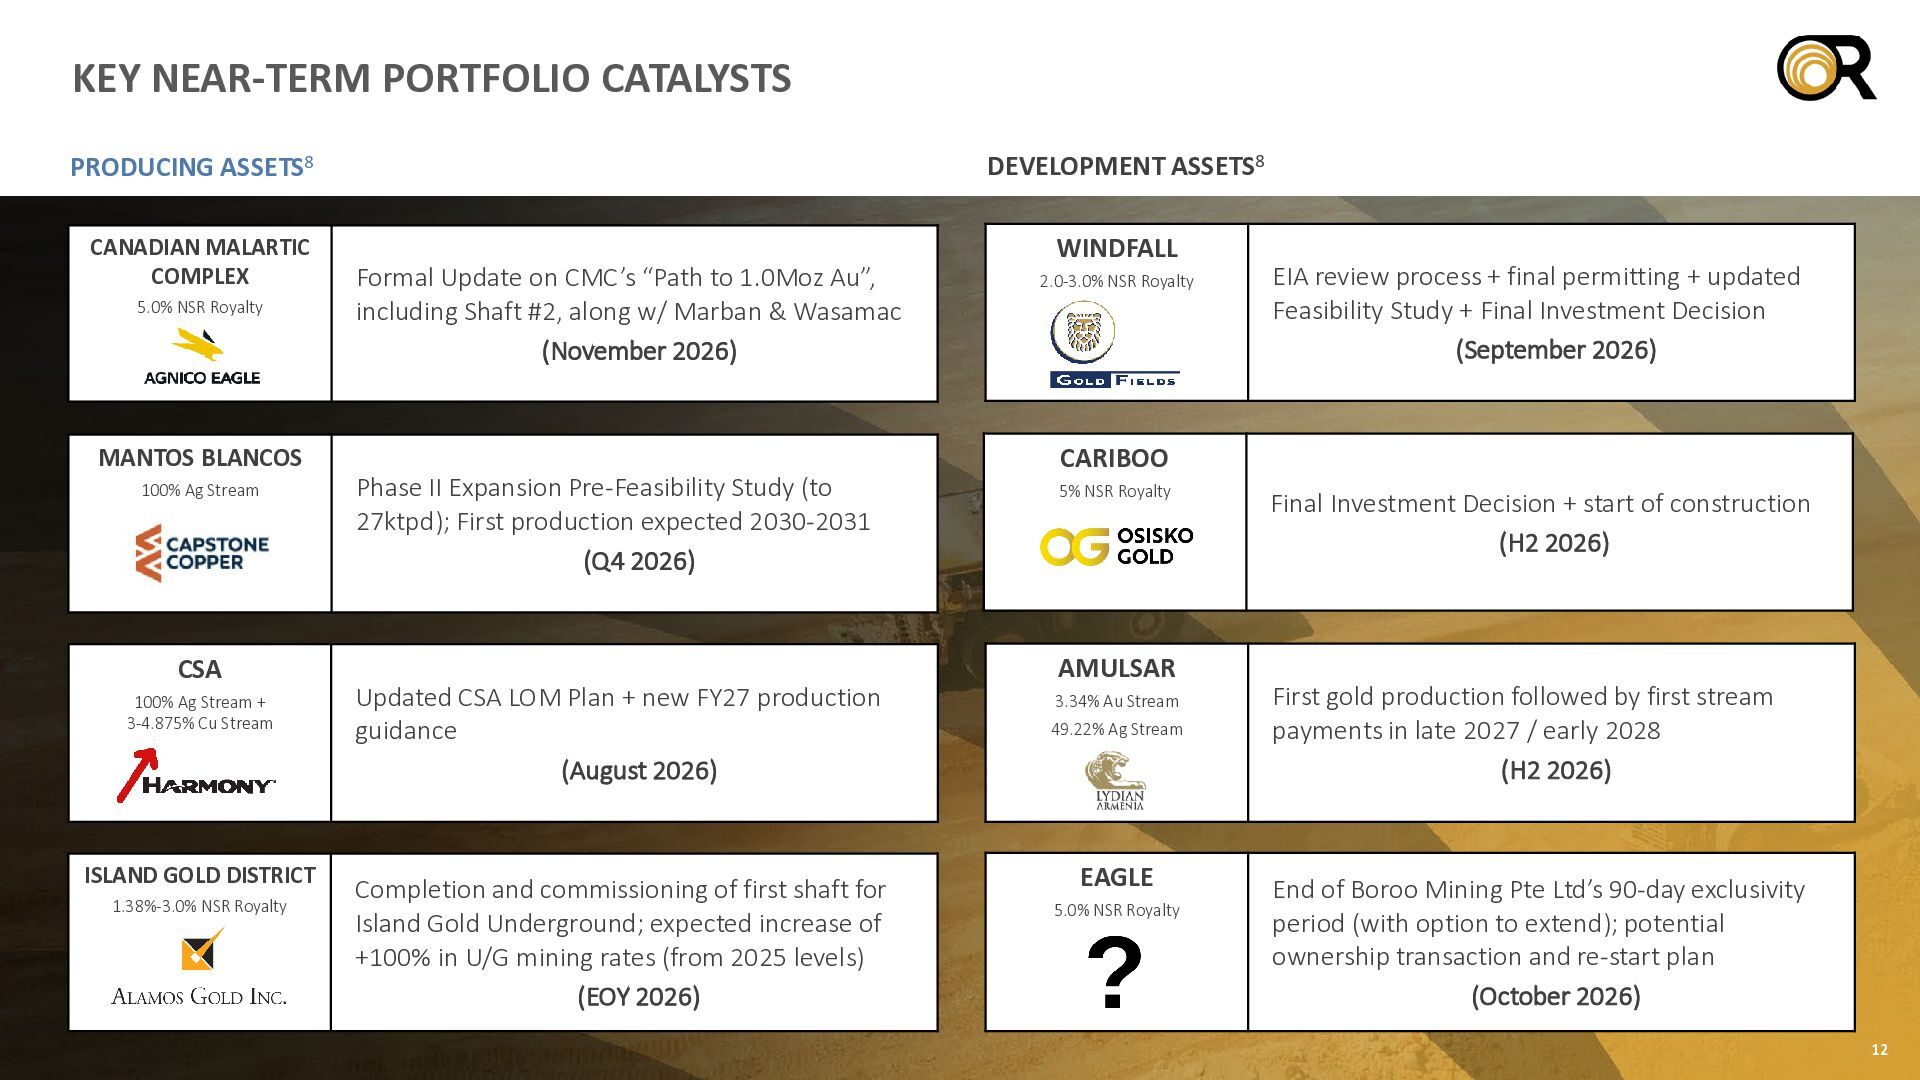
  12. KEY NEAR-TERM PORTFOLIO CATALYSTS DEVELOPMENT ASSETS8 PRODUCING ASSETS8 CANADIAN MALARTIC

    COMPLEX 5.0% NSR Royalty MANTOS BLANCOS 100% Ag Stream CSA 100% Ag Stream + 3-4.875% Cu Stream ISLAND GOLD DISTRICT 1.38%-3.0% NSR Royalty Formal Update on CMC’s “Path to 1.0Moz Au”, including Shaft #2, along w/ Marban & Wasamac (November 2026) Phase II Expansion Pre-Feasibility Study (to 27ktpd); First production expected 2030-2031 (Q4 2026) Updated CSA LOM Plan + new FY27 production guidance (August 2026) Completion and commissioning of first shaft for Island Gold Underground; expected increase of +100% in U/G mining rates (from 2025 levels) (EOY 2026) WINDFALL 2.0-3.0% NSR Royalty EIA review process + final permitting + updated Feasibility Study + Final Investment Decision (September 2026) CARIBOO 5% NSR Royalty AMULSAR 3.34% Au Stream 49.22% Ag Stream EAGLE 5.0% NSR Royalty Final Investment Decision + start of construction (H2 2026) First gold production followed by first stream payments in late 2027 / early 2028 (H2 2026) End of Boroo Mining Pte Ltd’s 90-day exclusivity period (with option to extend); potential ownership transaction and re-start plan (October 2026) 12
  13. BALANCE SHEET STRENGTH CREDIT FACILITY(ii) As at August 4, 2026

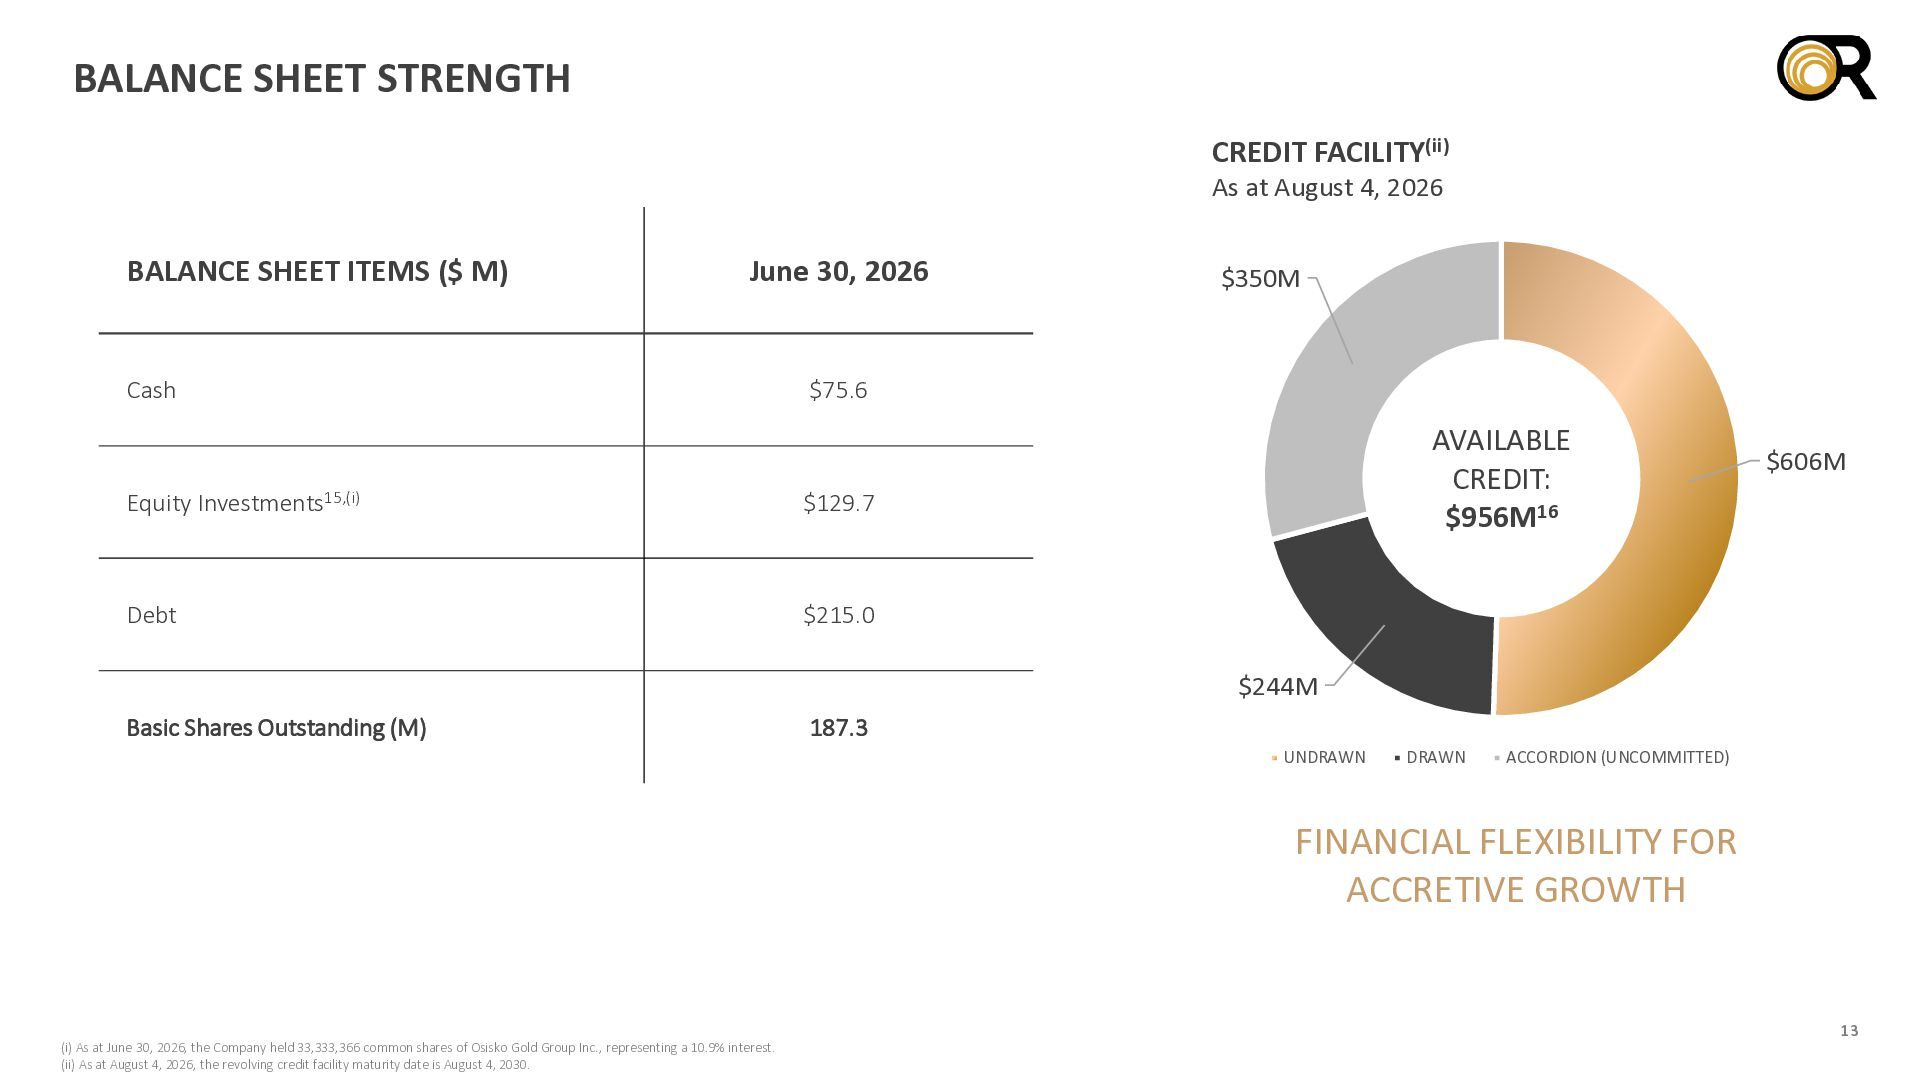
    BALANCE SHEET ITEMS ($ M) June 30, 2026 Cash $350M $75.6 Equity Investments15,(i) $129.7 Debt $215.0 AVAILABLE CREDIT: $956M16 $606M $244M Basic Shares Outstanding (M) 187.3 UNDRAWN DRAWN ACCORDION (UNCOMMITTED) FINANCIAL FLEXIBILITY FOR ACCRETIVE GROWTH (i) As at June 30, 2026, the Company held 33,333,366 common shares of Osisko Gold Group Inc., representing a 10.9% interest. (ii) As at August 4, 2026, the revolving credit facility maturity date is August 4, 2030. 13
  14. CAPITAL ALLOCATION: RETURNS TO SHAREHOLDERS CUMULATIVE DIVIDEND RETURNED SINCE INCEPTION(i)

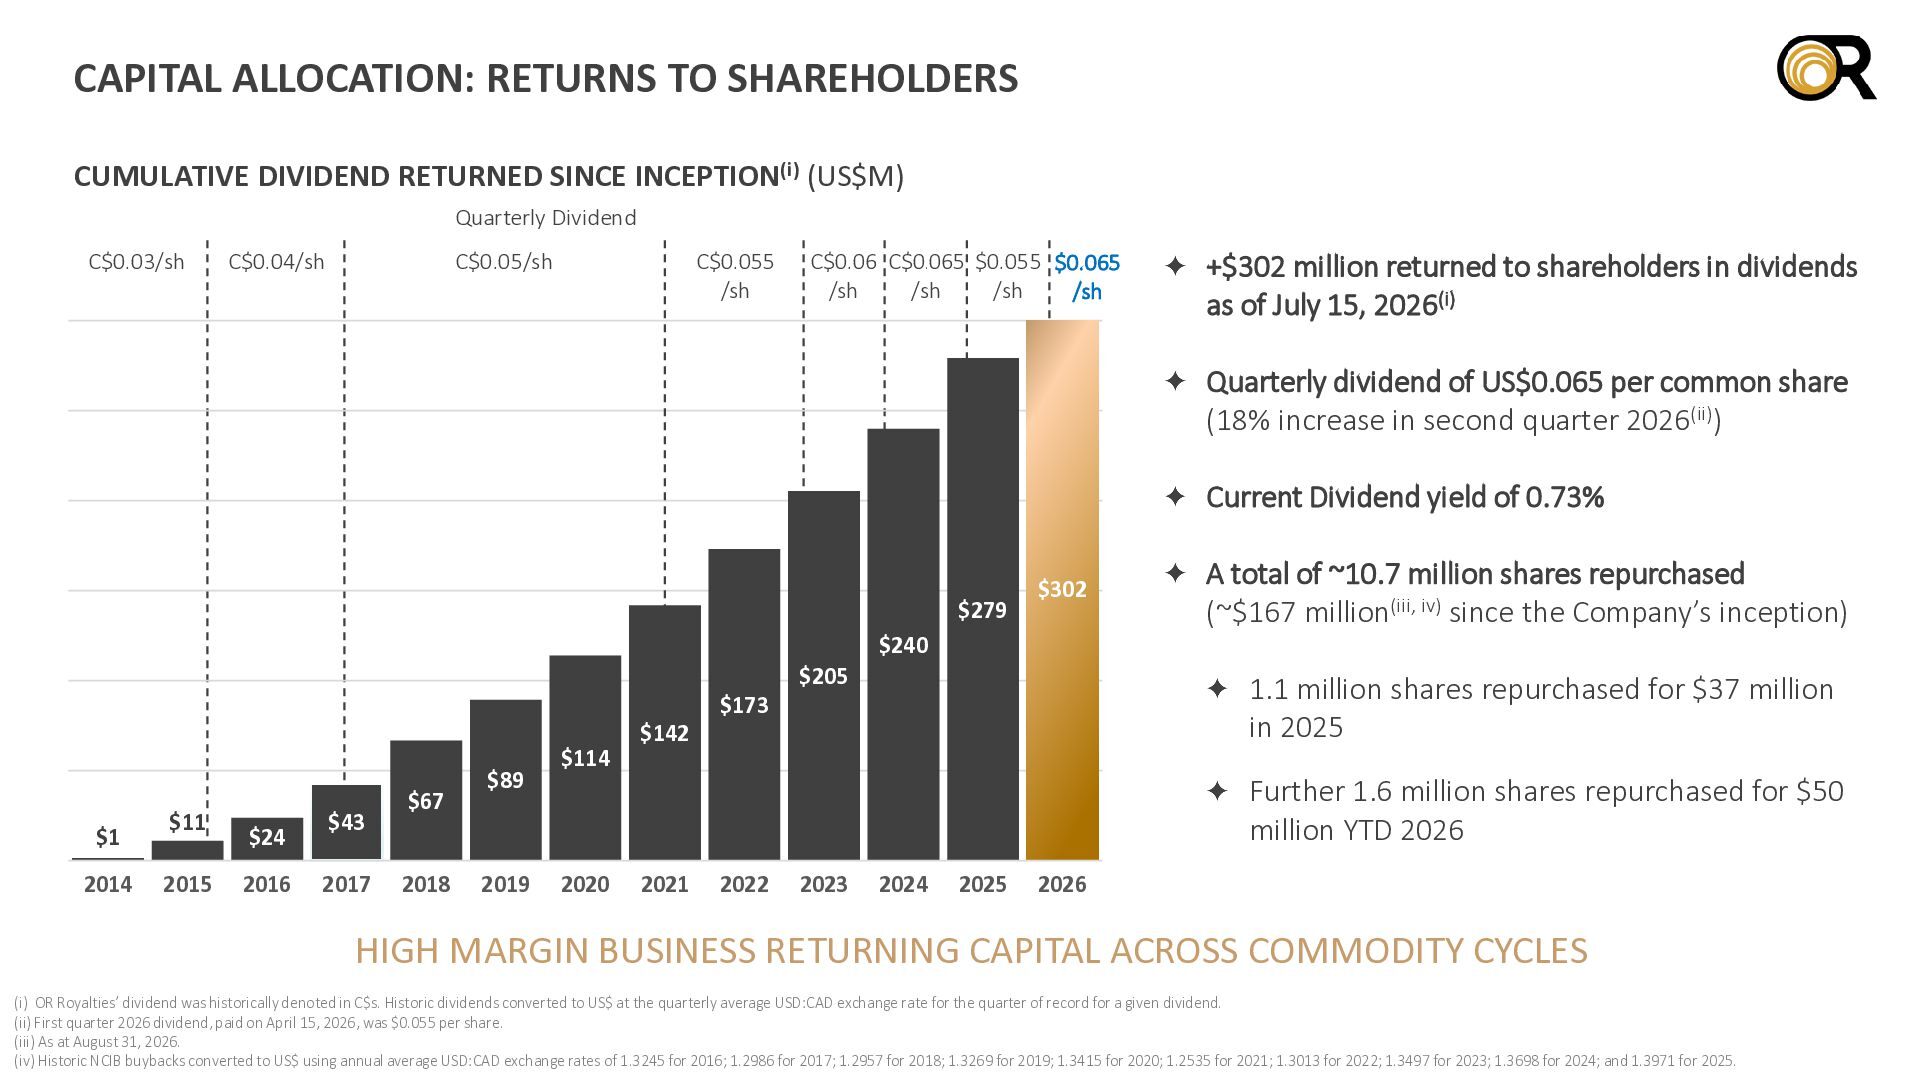
    (US$M) Quarterly Dividend C$0.03/sh C$0.04/sh C$0.05/sh C$0.055 /sh C$0.06 C$0.065 $0.055 $0.065 /sh /sh /sh /sh +$302 million returned to shareholders in dividends as of July 15, 2026(i) Quarterly dividend of US$0.065 per common share (18% increase in second quarter 2026(ii)) Current Dividend yield of 0.73% $279 $1 2014 $11 2015 $24 2016 $43 2017 $67 2018 $89 2019 $114 2020 $142 $173 $205 $302 $240 A total of ~10.7 million shares repurchased (~$167 million(iii, iv) since the Company’s inception) 1.1 million shares repurchased for $37 million in 2025 Further 1.6 million shares repurchased for $50 million YTD 2026 2021 2022 2023 2024 2025 2026 HIGH MARGIN BUSINESS RETURNING CAPITAL ACROSS COMMODITY CYCLES (i) OR Royalties’ dividend was historically denoted in C$s. Historic dividends converted to US$ at the quarterly average USD:CAD exchange rate for the quarter of record for a given dividend. (ii) First quarter 2026 dividend, paid on April 15, 2026, was $0.055 per share. (iii) As at August 31, 2026. (iv) Historic NCIB buybacks converted to US$ using annual average USD:CAD exchange rates of 1.3245 for 2016; 1.2986 for 2017; 1.2957 for 2018; 1.3269 for 2019; 1.3415 for 2020; 1.2535 for 2021; 1.3013 for 2022; 1.3497 for 2023; 1.3698 for 2024; and 1.3971 for 2025.
  15. UNLOCKING VALUE SENIOR-QUALITY PORTFOLIO WITH HIGH REPLACEMENT VALUE LOW-RISK PRECIOUS

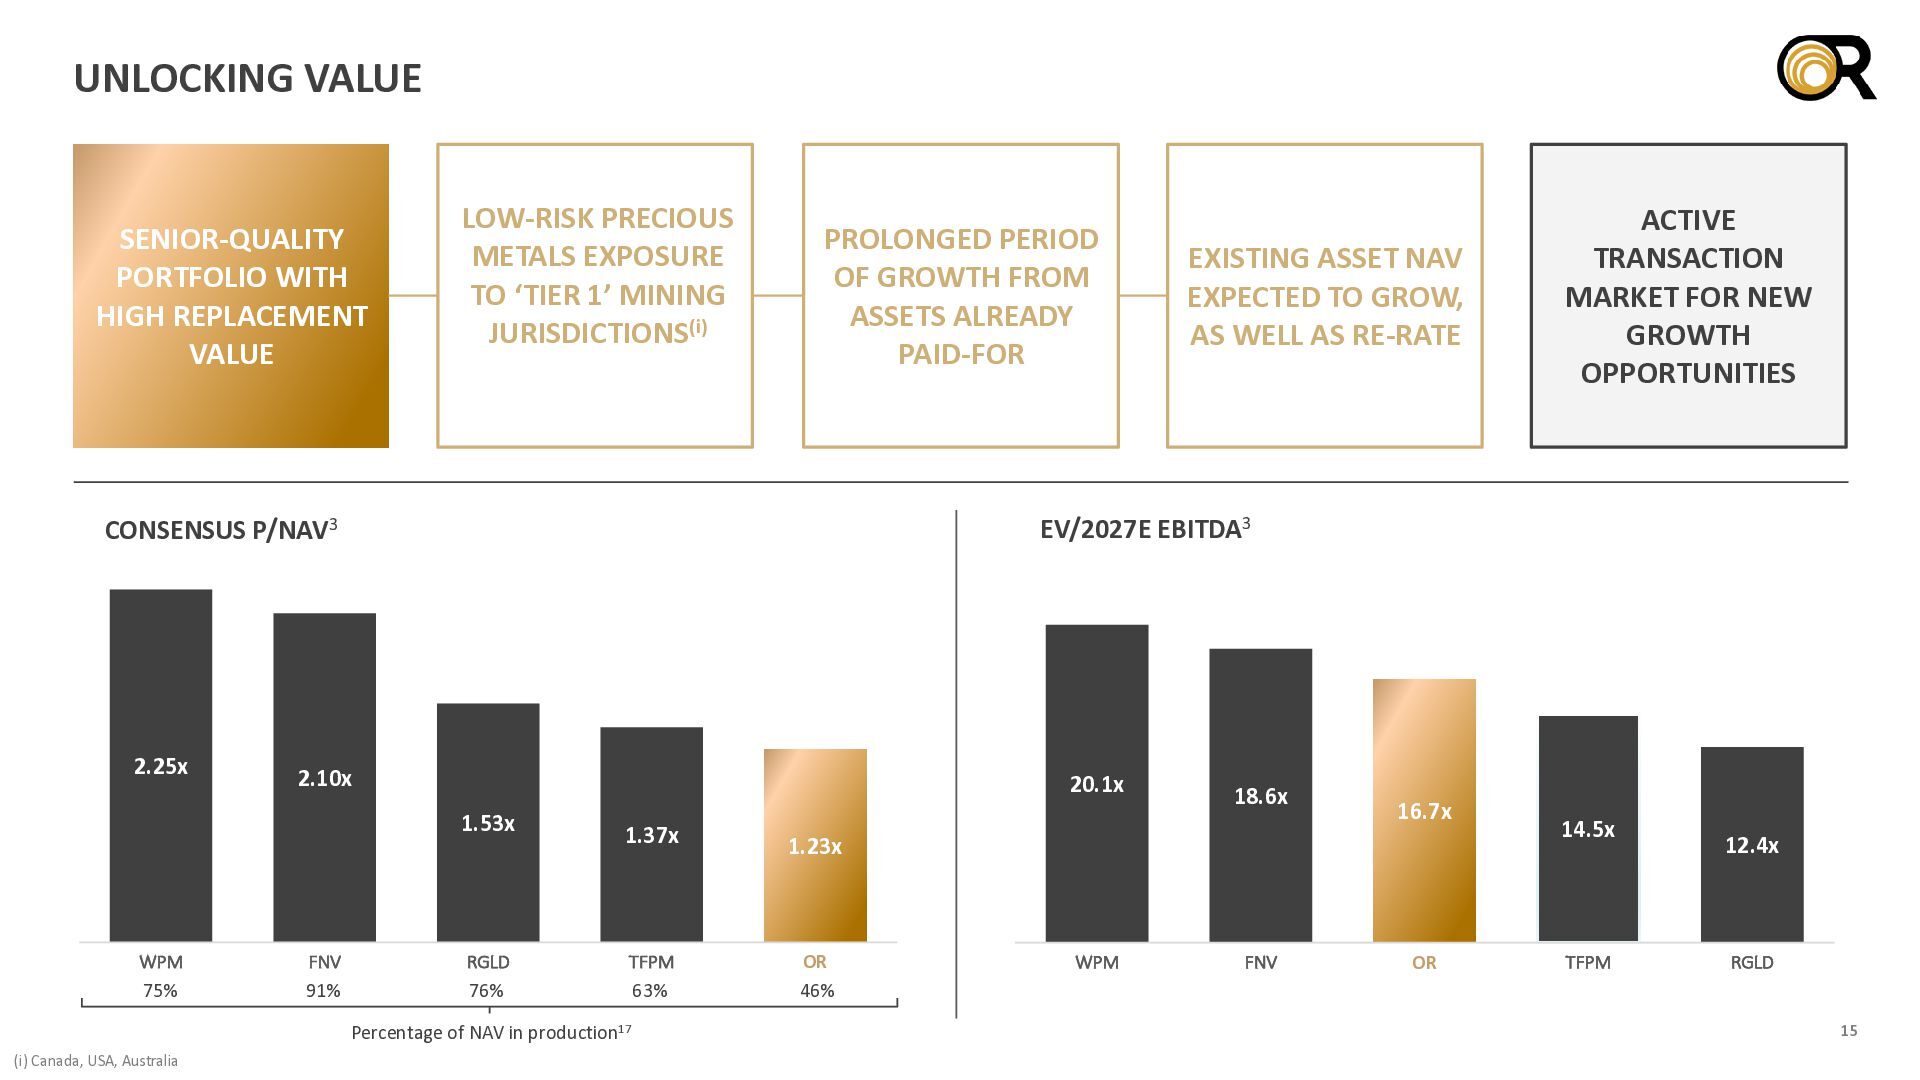
    METALS EXPOSURE TO ‘TIER 1’ MINING JURISDICTIONS(i) PROLONGED PERIOD OF GROWTH FROM ASSETS ALREADY PAID-FOR EV/2027E EBITDA3 CONSENSUS P/NAV3 2.25x 2.10x 20.1x 1.53x WPM 75% FNV 91% RGLD 76% 1.37x TFPM 63% Percentage of NAV in production17 (i) Canada, USA, Australia EXISTING ASSET NAV EXPECTED TO GROW, AS WELL AS RE-RATE ACTIVE TRANSACTION MARKET FOR NEW GROWTH OPPORTUNITIES 18.6x 16.7x 1.23x OR 46% WPM FNV OR 14.5x TFPM 12.4x RGLD 15
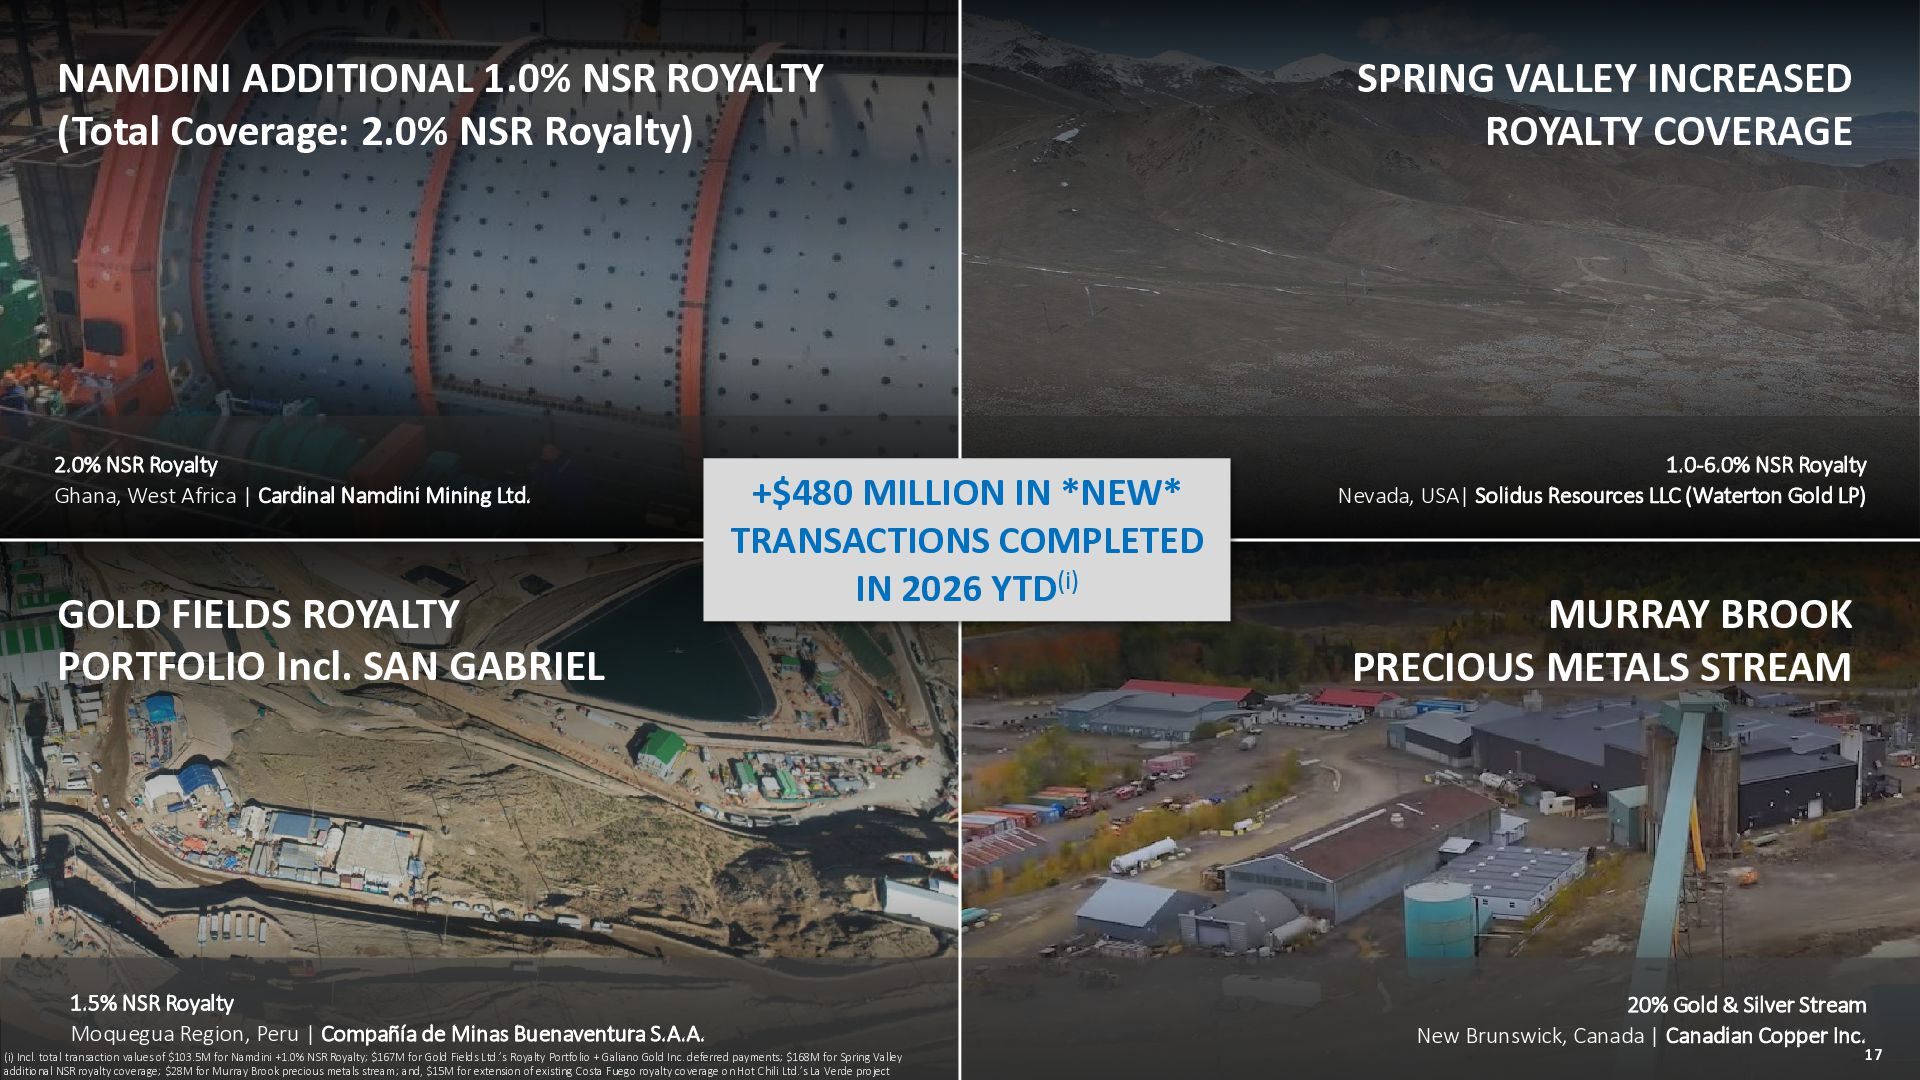
  16. NAMDINI ADDITIONAL 1.0% NSR ROYALTY (Total Coverage: 2.0% NSR Royalty)

    2.0% NSR Royalty Ghana, West Africa | Cardinal Namdini Mining Ltd. GOLD FIELDS ROYALTY PORTFOLIO Incl. SAN GABRIEL +$480 MILLION IN *NEW* TRANSACTIONS COMPLETED IN 2026 YTD(i) 1.5% NSR Royalty Moquegua Region, Peru | Compañía de Minas Buenaventura S.A.A. (i) Incl. total transaction values of $103.5M for Namdini +1.0% NSR Royalty; $167M for Gold Fields Ltd.’s Royalty Portfolio + Galiano Gold Inc. deferred payments; $168M for Spring Valley additional NSR royalty coverage; $28M for Murray Brook precious metals stream; and, $15M for extension of existing Costa Fuego royalty coverage on Hot Chili Ltd.’s La Verde project SPRING VALLEY INCREASED ROYALTY COVERAGE 1.0-6.0% NSR Royalty Nevada, USA| Solidus Resources LLC (Waterton Gold LP) MURRAY BROOK PRECIOUS METALS STREAM 20% Gold & Silver Stream New Brunswick, Canada | Canadian Copper Inc. 17
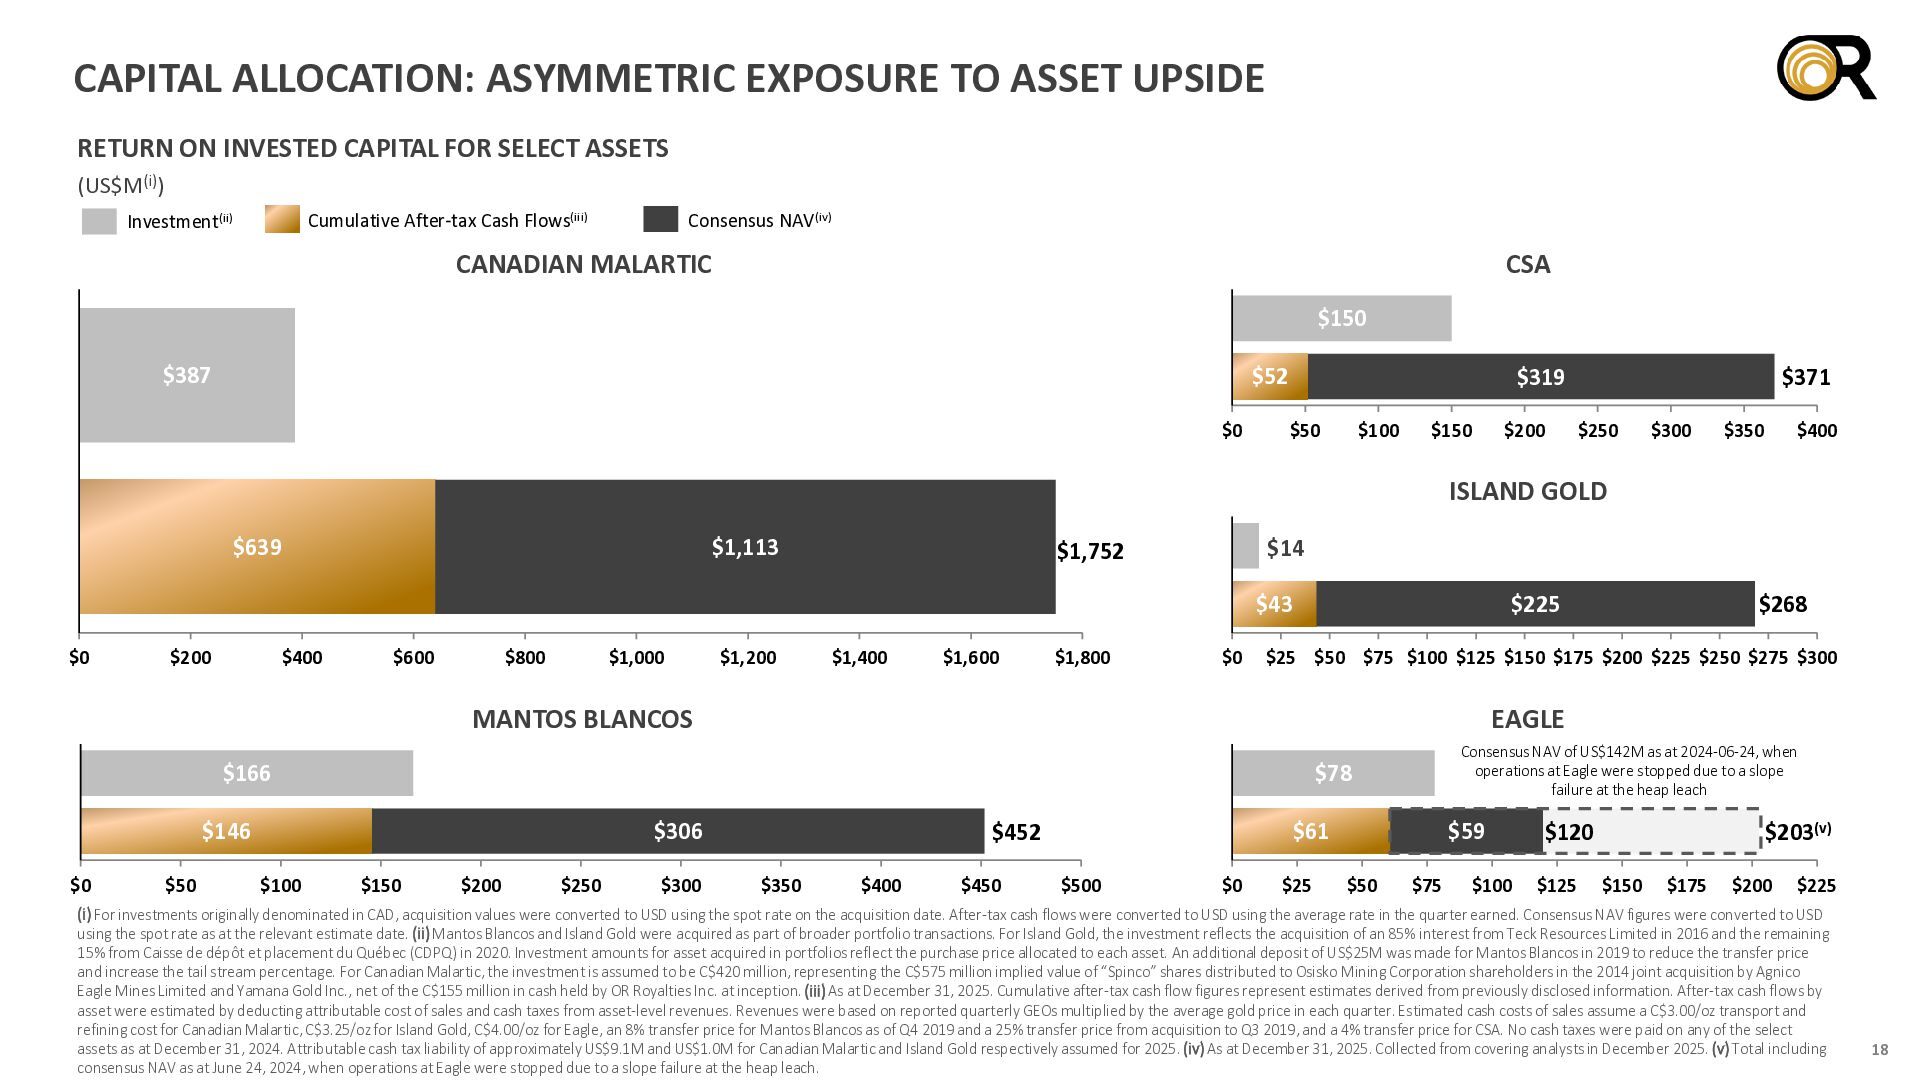
  17. CAPITAL ALLOCATION: ASYMMETRIC EXPOSURE TO ASSET UPSIDE RETURN ON INVESTED

    CAPITAL FOR SELECT ASSETS (US$M(i)) Cumulative After-tax Cash Flows(iii) Investment(ii) Consensus NAV(iv) CANADIAN MALARTIC CSA $150 $387 $52 $0 $319 $50 $100 $150 $200 $371 $250 $300 $350 $400 ISLAND GOLD $639 $1,113 $14 $1,752 $43 $0 $200 $400 $600 $800 $1,000 $1,200 $1,400 $1,600 $1,800 $0 $25 $50 $75 $100 $125 $150 $175 $200 $225 $250 $275 $300 MANTOS BLANCOS EAGLE $166 $0 $50 $306 $100 Consensus NAV of US$142M as at 2024-06-24, when operations at Eagle were stopped due to a slope failure at the heap leach $78 $146 $150 $200 $250 $300 $268 $225 $61 $452 $350 $400 $450 $500 $0 $25 $59 $50 $75 $100 $120 $125 $203(v) $150 $175 $200 $225 (i) For investments originally denominated in CAD, acquisition values were converted to USD using the spot rate on the acquisition date. After-tax cash flows were converted to USD using the average rate in the quarter earned. Consensus NAV figures were converted to USD using the spot rate as at the relevant estimate date. (ii) Mantos Blancos and Island Gold were acquired as part of broader portfolio transactions. For Island Gold, the investment reflects the acquisition of an 85% interest from Teck Resources Limited in 2016 and the remaining 15% from Caisse de dépôt et placement du Québec (CDPQ) in 2020. Investment amounts for asset acquired in portfolios reflect the purchase price allocated to each asset. An additional deposit of US$25M was made for Mantos Blancos in 2019 to reduce the transfer price and increase the tail stream percentage. For Canadian Malartic, the investment is assumed to be C$420 million, representing the C$575 million implied value of “Spinco” shares distributed to Osisko Mining Corporation shareholders in the 2014 joint acquisition by Agnico Eagle Mines Limited and Yamana Gold Inc., net of the C$155 million in cash held by OR Royalties Inc. at inception. (iii) As at December 31, 2025. Cumulative after-tax cash flow figures represent estimates derived from previously disclosed information. After-tax cash flows by asset were estimated by deducting attributable cost of sales and cash taxes from asset-level revenues. Revenues were based on reported quarterly GEOs multiplied by the average gold price in each quarter. Estimated cash costs of sales assume a C$3.00/oz transport and refining cost for Canadian Malartic, C$3.25/oz for Island Gold, C$4.00/oz for Eagle, an 8% transfer price for Mantos Blancos as of Q4 2019 and a 25% transfer price from acquisition to Q3 2019, and a 4% transfer price for CSA. No cash taxes were paid on any of the select assets as at December 31, 2024. Attributable cash tax liability of approximately US$9.1M and US$1.0M for Canadian Malartic and Island Gold respectively assumed for 2025. (iv) As at December 31, 2025. Collected from covering analysts in December 2025. (v) Total including consensus NAV as at June 24, 2024, when operations at Eagle were stopped due to a slope failure at the heap leach. 18
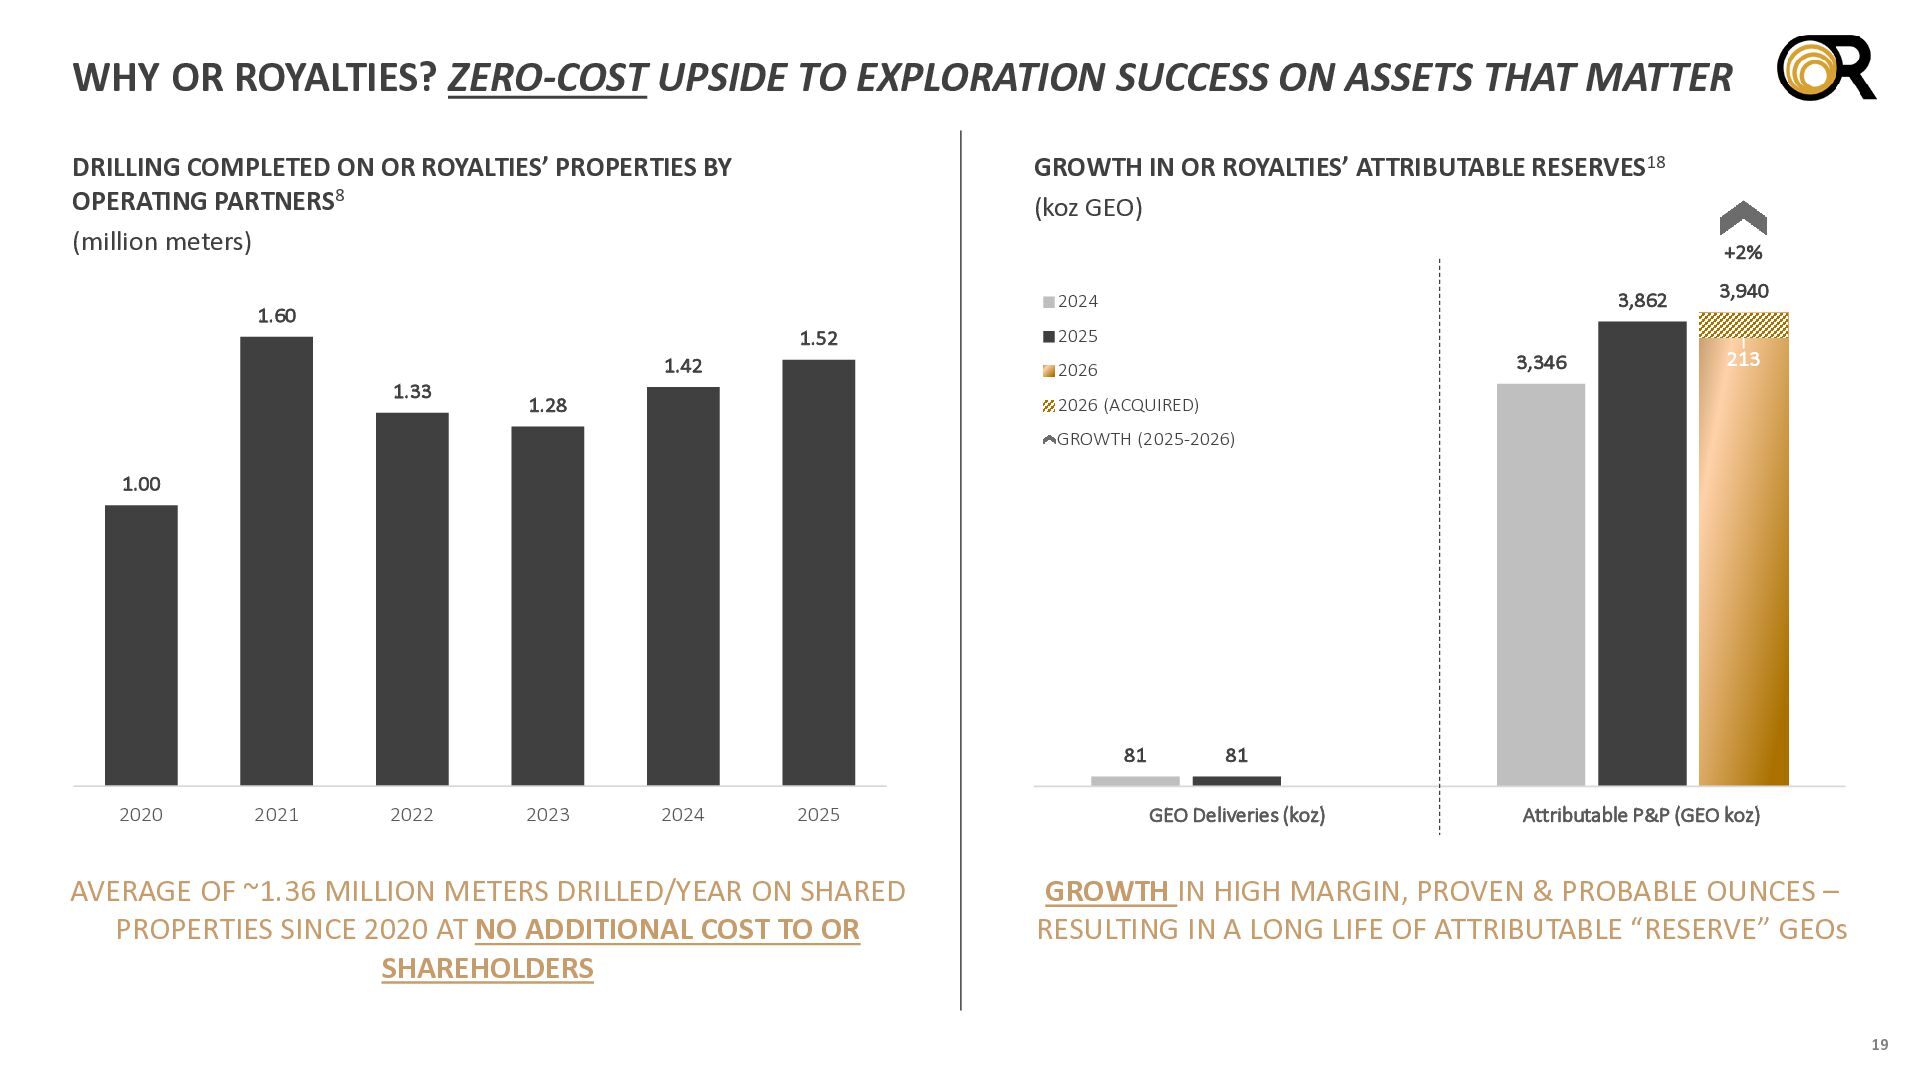
  18. WHY OR ROYALTIES? ZERO-COST UPSIDE TO EXPLORATION SUCCESS ON ASSETS

    THAT MATTER DRILLING COMPLETED ON OR ROYALTIES’ PROPERTIES BY OPERATING PARTNERS8 (million meters) GROWTH IN OR ROYALTIES’ ATTRIBUTABLE RESERVES18 (koz GEO) +2% 3,862 2024 1.60 1.52 1.33 1.42 2025 3,346 2026 1.28 3,940 213 2026 (ACQUIRED) GROWTH (2025-2026) 1.00 81 2020 2021 2022 2023 2024 2025 AVERAGE OF ~1.36 MILLION METERS DRILLED/YEAR ON SHARED PROPERTIES SINCE 2020 AT NO ADDITIONAL COST TO OR SHAREHOLDERS 81 Deliveries (koz) GEO Deliveries (koz) Proven & Probable (koz) Attributable P&P (GEO koz) GROWTH IN HIGH MARGIN, PROVEN & PROBABLE OUNCES – RESULTING IN A LONG LIFE OF ATTRIBUTABLE “RESERVE” GEOs 19
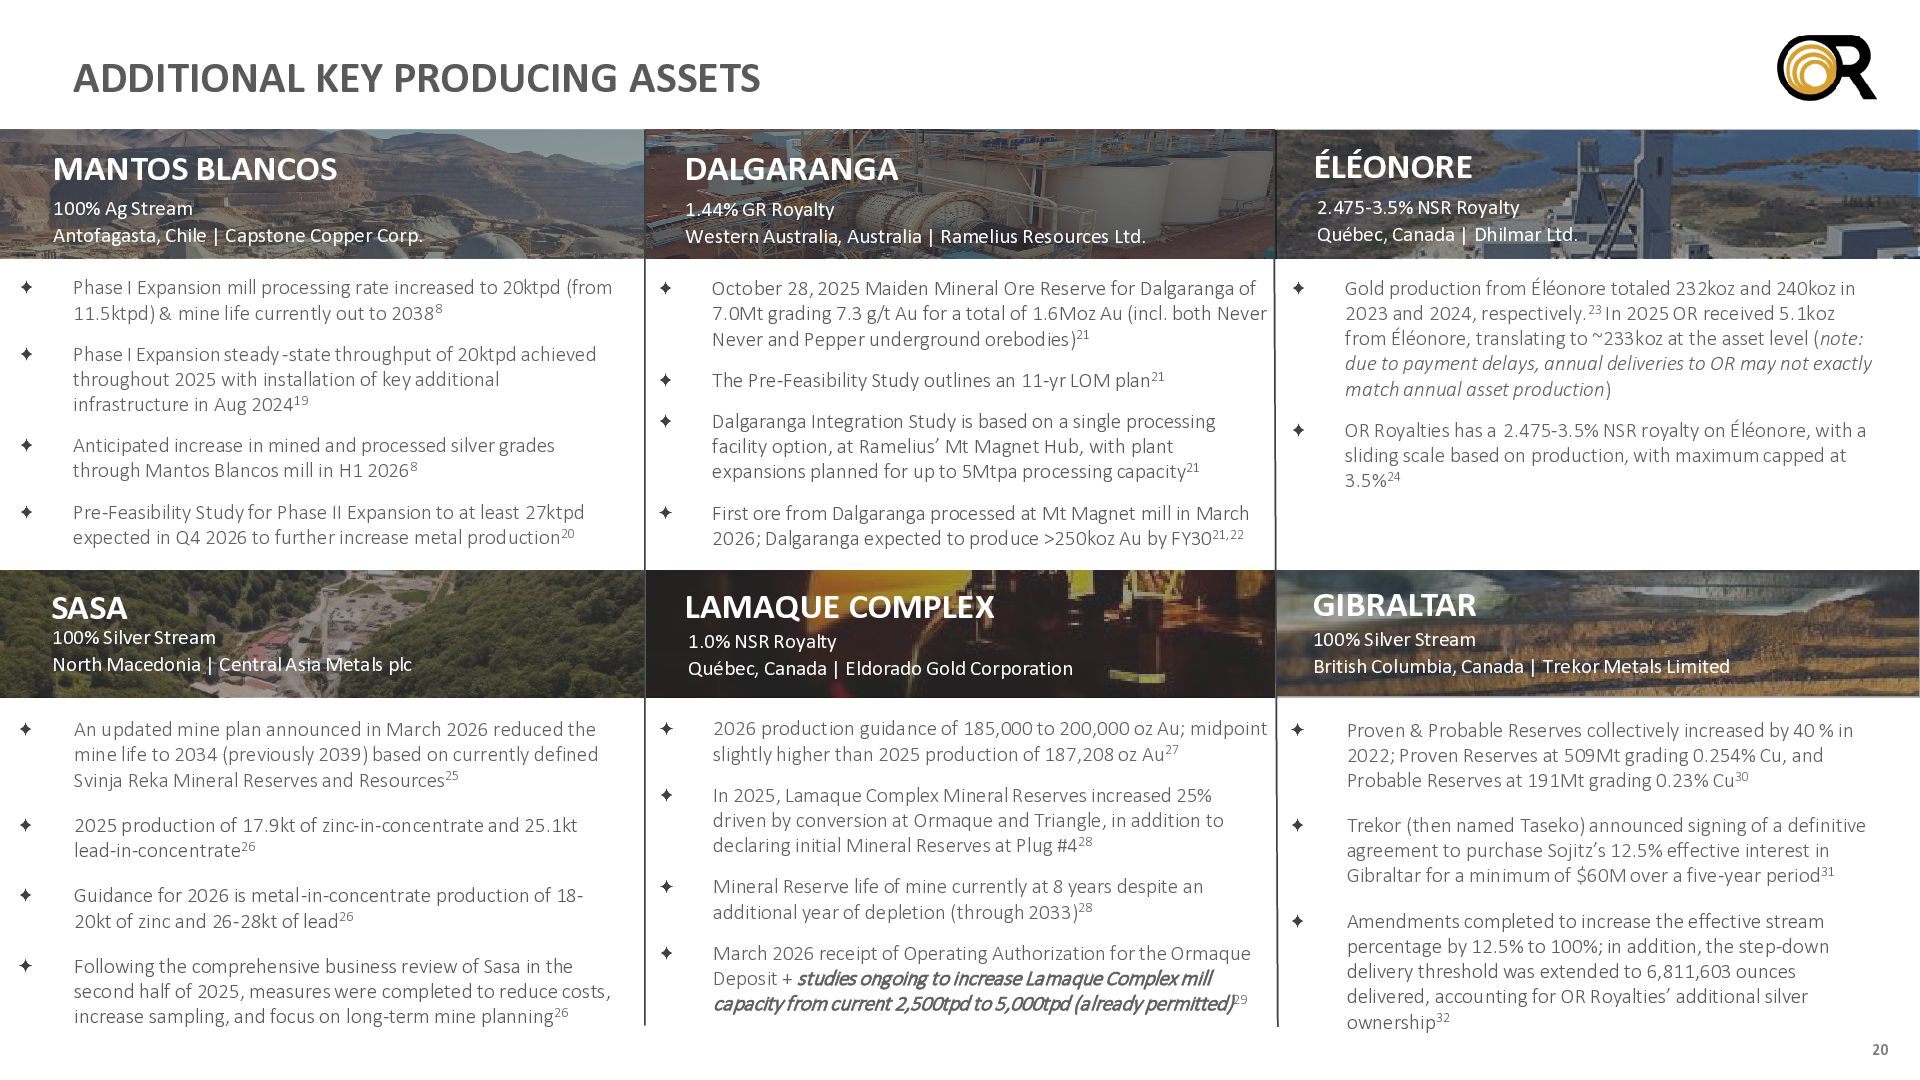
  19. ADDITIONAL KEY PRODUCING ASSETS MANTOS BLANCOS DALGARANGA ÉLÉONORE 100% Ag

    Stream Antofagasta, Chile | Capstone Copper Corp. . Phase I Expansion mill processing rate increased to 20ktpd (from 11.5ktpd) & mine life currently out to 20388 1.44% GR Royalty Western Australia, Australia | Ramelius Resources Ltd. . October 28, 2025 Maiden Mineral Ore Reserve for Dalgaranga of 7.0Mt grading 7.3 g/t Au for a total of 1.6Moz Au (incl. both Never Never and Pepper underground orebodies)21 2.475-3.5% NSR Royalty Québec, Canada | Dhilmar Ltd. . Gold production from Éléonore totaled 232koz and 240koz in 2023 and 2024, respectively.23 In 2025 OR received 5.1koz from Éléonore, translating to ~233koz at the asset level (note: due to payment delays, annual deliveries to OR may not exactly match annual asset production) Phase I Expansion steady -state throughput of 20ktpd achieved throughout 2025 with installation of key additional infrastructure in Aug 202419 The Pre-Feasibility Study outlines an 11-yr LOM plan21 Anticipated increase in mined and processed silver grades through Mantos Blancos mill in H1 20268 Dalgaranga Integration Study is based on a single processing facility option, at Ramelius’ Mt Magnet Hub, with plant expansions planned for up to 5Mtpa processing capacity21 Pre-Feasibility Study for Phase II Expansion to at least 27ktpd expected in Q4 2026 to further increase metal production20 First ore from Dalgaranga processed at Mt Magnet mill in March 2026; Dalgaranga expected to produce >250koz Au by FY3021,22 SASA 100% Silver Stream North Macedonia | Central Asia Metals plc An updated mine plan announced in March 2026 reduced the mine life to 2034 (previously 2039) based on currently defined Svinja Reka Mineral Reserves and Resources25 LAMAQUE COMPLEX 1.0% NSR Royalty Québec, Canada | Eldorado Gold Corporation 2026 production guidance of 185,000 to 200,000 oz Au; midpoint slightly higher than 2025 production of 187,208 oz Au27 2025 production of 17.9kt of zinc-in-concentrate and 25.1kt lead-in-concentrate26 In 2025, Lamaque Complex Mineral Reserves increased 25% driven by conversion at Ormaque and Triangle, in addition to declaring initial Mineral Reserves at Plug #428 Guidance for 2026 is metal-in-concentrate production of 1820kt of zinc and 26-28kt of lead26 Mineral Reserve life of mine currently at 8 years despite an additional year of depletion (through 2033)28 Following the comprehensive business review of Sasa in the second half of 2025, measures were completed to reduce costs, increase sampling, and focus on long-term mine planning26 March 2026 receipt of Operating Authorization for the Ormaque Deposit + studies ongoing to increase Lamaque Complex mill capacity from current 2,500tpd to 5,000tpd (already permitted)29 OR Royalties has a 2.475-3.5% NSR royalty on Éléonore, with a sliding scale based on production, with maximum capped at 3.5%24 GIBRALTAR 100% Silver Stream British Columbia, Canada | Trekor Metals Limited Proven & Probable Reserves collectively increased by 40 % in 2022; Proven Reserves at 509Mt grading 0.254% Cu, and Probable Reserves at 191Mt grading 0.23% Cu30 Trekor (then named Taseko) announced signing of a definitive agreement to purchase Sojitz’s 12.5% effective interest in Gibraltar for a minimum of $60M over a five-year period31 Amendments completed to increase the effective stream percentage by 12.5% to 100%; in addition, the step-down delivery threshold was extended to 6,811,603 ounces delivered, accounting for OR Royalties’ additional silver ownership32 20
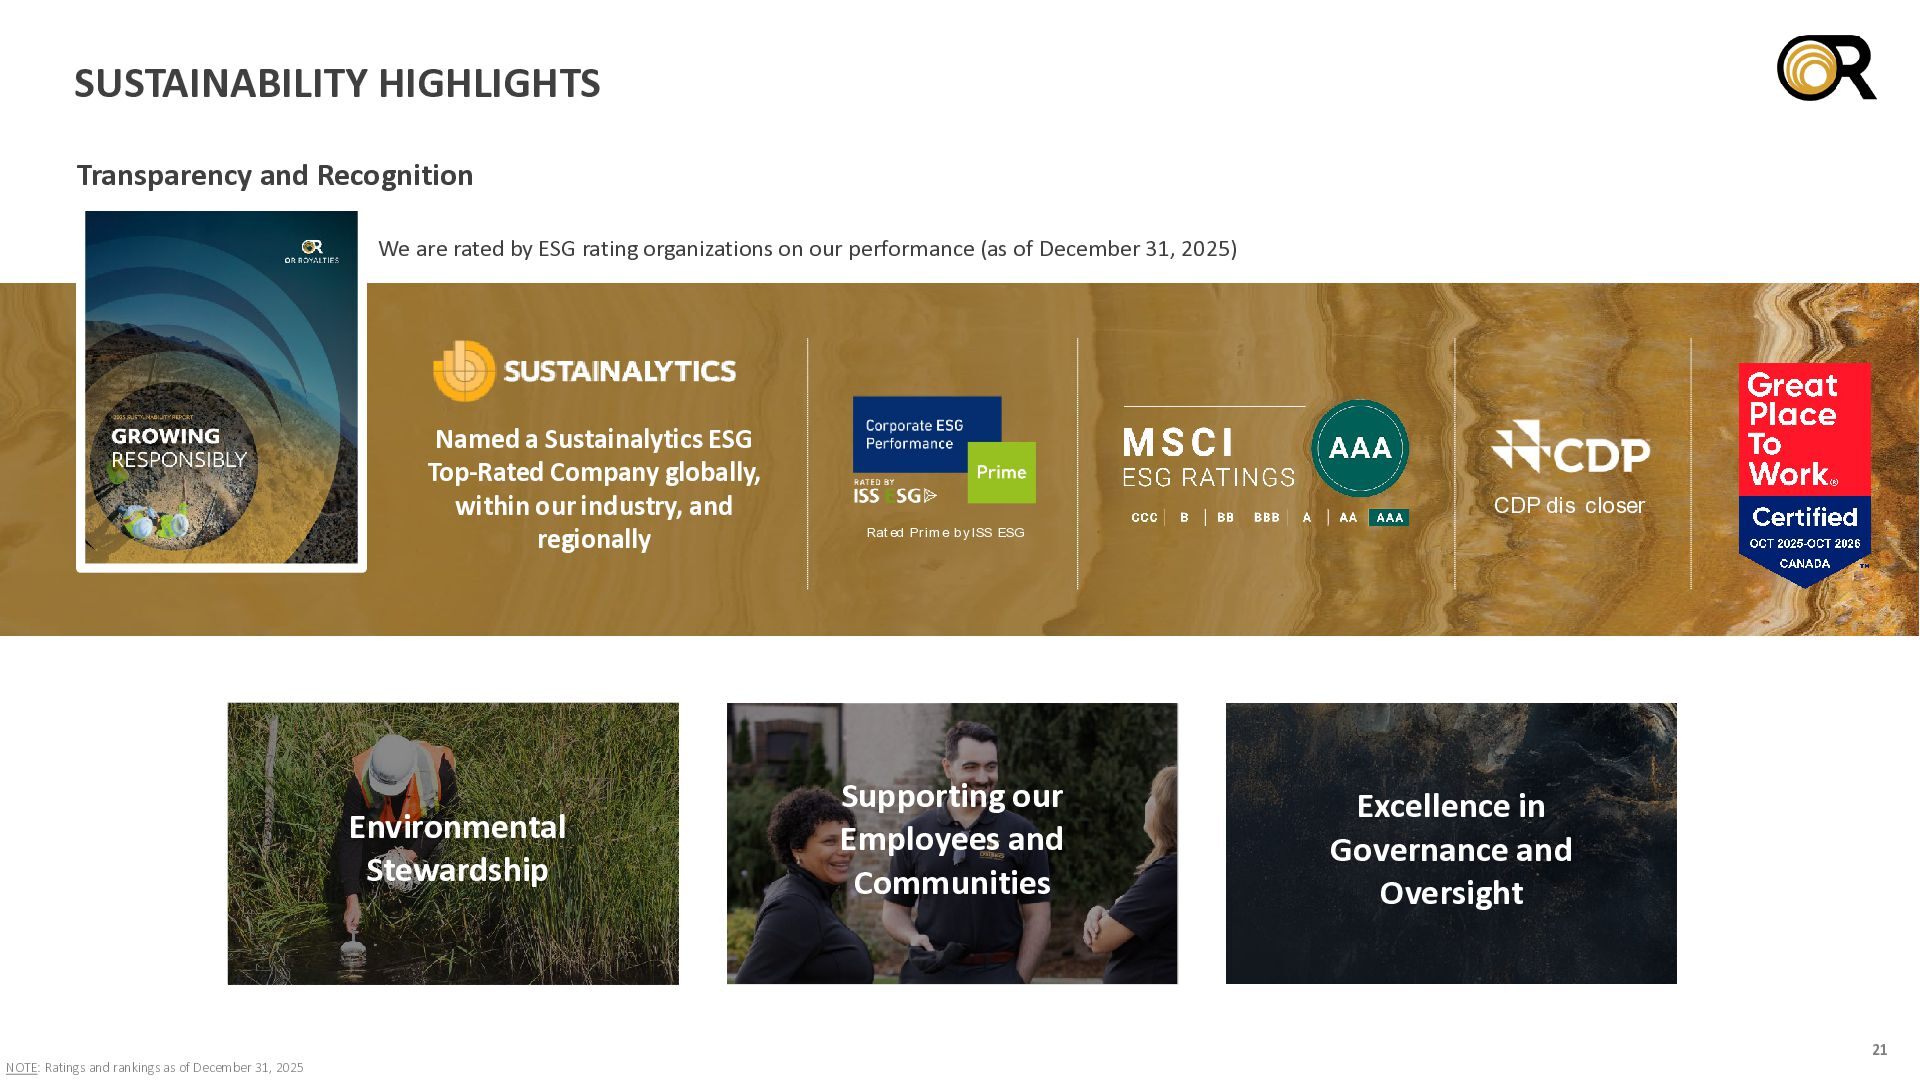
  20. SUSTAINABILITY HIGHLIGHTS Transparency and Recognition We are rated by ESG

    rating organizations on our performance (as of December 31, 2025) Named a Sustainalytics ESG Top-Rated Company globally, within our industry, and regionally Environmental Stewardship NOTE: Ratings and rankings as of December 31, 2025 CDP dis closer Rat ed Prim e by ISS ESG Supporting our Employees and Communities Excellence in Governance and Oversight 21
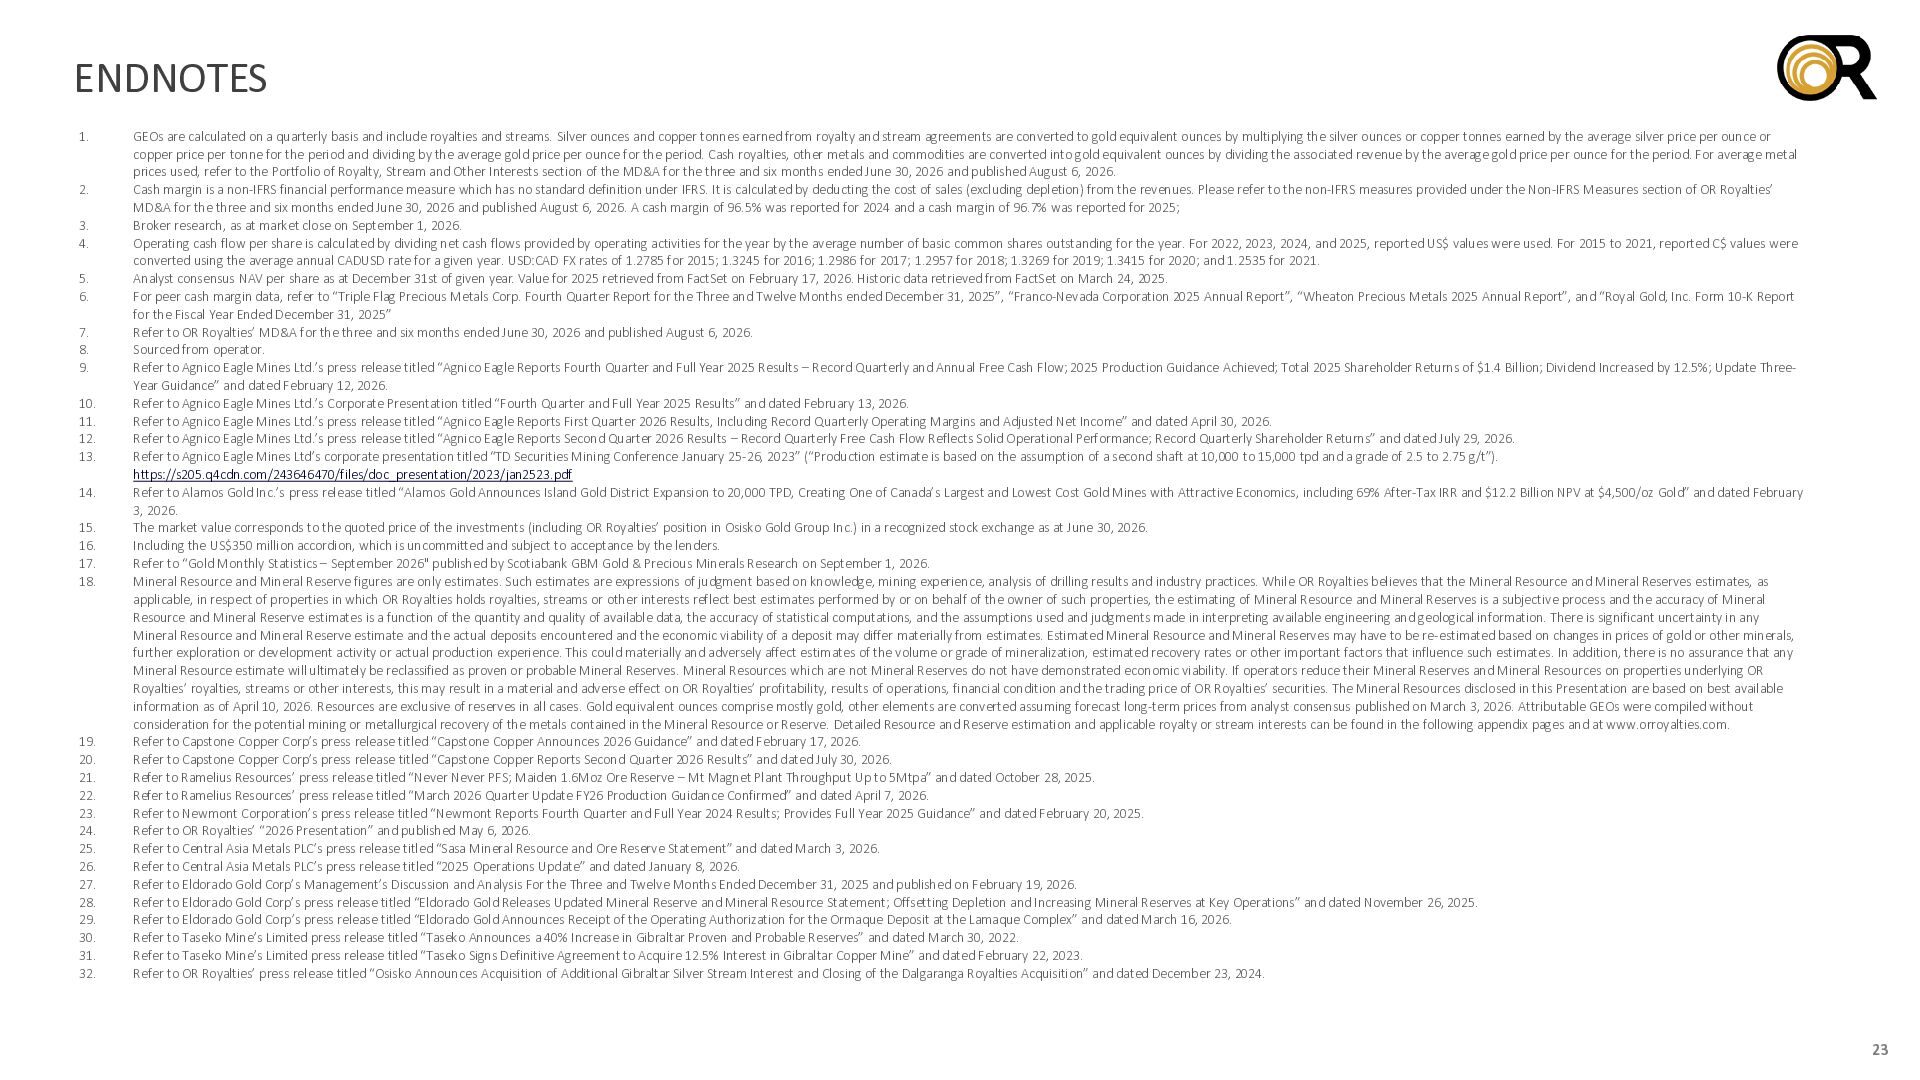
  21. ENDNOTES 1. 2. 3. 4. 5. 6. 7. 8. 9.

    10. 11. 12. 13. 14. 15. 16. 17. 18. 19. 20. 21. 22. 23. 24. 25. 26. 27. 28. 29. 30. 31. 32. GEOs are calculated on a quarterly basis and include royalties and streams. Silver ounces and copper tonnes earned from royalty and stream agreements are converted to gold equivalent ounces by multiplying the silver ounces or copper tonnes earned by the average silver price per ounce or copper price per tonne for the period and dividing by the average gold price per ounce for the period. Cash royalties, other metals and commodities are converted into gold equivalent ounces by dividing the associated revenue by the average gold price per ounce for the period. For average metal prices used, refer to the Portfolio of Royalty, Stream and Other Interests section of the MD&A for the three and six months ended June 30, 2026 and published August 6, 2026. Cash margin is a non-IFRS financial performance measure which has no standard definition under IFRS. It is calculated by deducting the cost of sales (excluding depletion) from the revenues. Please refer to the non-IFRS measures provided under the Non-IFRS Measures section of OR Royalties’ MD&A for the three and six months ended June 30, 2026 and published August 6, 2026. A cash margin of 96.5% was reported for 2024 and a cash margin of 96.7% was reported for 2025; Broker research, as at market close on September 1, 2026. Operating cash flow per share is calculated by dividing net cash flows provided by operating activities for the year by the average number of basic common shares outstanding for the year. For 2022, 2023, 2024, and 2025, reported US$ values were used. For 2015 to 2021, reported C$ values were converted using the average annual CADUSD rate for a given year. USD:CAD FX rates of 1.2785 for 2015; 1.3245 for 2016; 1.2986 for 2017; 1.2957 for 2018; 1.3269 for 2019; 1.3415 for 2020; and 1.2535 for 2021. Analyst consensus NAV per share as at December 31st of given year. Value for 2025 retrieved from FactSet on February 17, 2026. Historic data retrieved from FactSet on March 24, 2025. For peer cash margin data, refer to “Triple Flag Precious Metals Corp. Fourth Quarter Report for the Three and Twelve Months ended December 31, 2025”, “Franco-Nevada Corporation 2025 Annual Report”, “Wheaton Precious Metals 2025 Annual Report”, and “Royal Gold, Inc. Form 10-K Report for the Fiscal Year Ended December 31, 2025” Refer to OR Royalties’ MD&A for the three and six months ended June 30, 2026 and published August 6, 2026. Sourced from operator. Refer to Agnico Eagle Mines Ltd.’s press release titled “Agnico Eagle Reports Fourth Quarter and Full Year 2025 Results – Record Quarterly and Annual Free Cash Flow; 2025 Production Guidance Achieved; Total 2025 Shareholder Returns of $1.4 Billion; Dividend Increased by 12.5%; Update ThreeYear Guidance” and dated February 12, 2026. Refer to Agnico Eagle Mines Ltd.’s Corporate Presentation titled “Fourth Quarter and Full Year 2025 Results” and dated February 13, 2026. Refer to Agnico Eagle Mines Ltd.’s press release titled “Agnico Eagle Reports First Quarter 2026 Results, Including Record Quarterly Operating Margins and Adjusted Net Income” and dated April 30, 2026. Refer to Agnico Eagle Mines Ltd.’s press release titled “Agnico Eagle Reports Second Quarter 2026 Results – Record Quarterly Free Cash Flow Reflects Solid Operational Performance; Record Quarterly Shareholder Returns” and dated July 29, 2026. Refer to Agnico Eagle Mines Ltd’s corporate presentation titled “TD Securities Mining Conference January 25-26, 2023” (“Production estimate is based on the assumption of a second shaft at 10,000 to 15,000 tpd and a grade of 2.5 to 2.75 g/t”). https://s205.q4cdn.com/243646470/files/doc_presentation/2023/jan2523.pdf Refer to Alamos Gold Inc.’s press release titled “Alamos Gold Announces Island Gold District Expansion to 20,000 TPD, Creating One of Canada’s Largest and Lowest Cost Gold Mines with Attractive Economics, including 69% After-Tax IRR and $12.2 Billion NPV at $4,500/oz Gold” and dated February 3, 2026. The market value corresponds to the quoted price of the investments (including OR Royalties’ position in Osisko Gold Group Inc.) in a recognized stock exchange as at June 30, 2026. Including the US$350 million accordion, which is uncommitted and subject to acceptance by the lenders. Refer to “Gold Monthly Statistics – September 2026" published by Scotiabank GBM Gold & Precious Minerals Research on September 1, 2026. Mineral Resource and Mineral Reserve figures are only estimates. Such estimates are expressions of judgment based on knowledge, mining experience, analysis of drilling results and industry practices. While OR Royalties believes that the Mineral Resource and Mineral Reserves estimates, as applicable, in respect of properties in which OR Royalties holds royalties, streams or other interests reflect best estimates performed by or on behalf of the owner of such properties, the estimating of Mineral Resource and Mineral Reserves is a subjective process and the accuracy of Mineral Resource and Mineral Reserve estimates is a function of the quantity and quality of available data, the accuracy of statistical computations, and the assumptions used and judgments made in interpreting available engineering and geological information. There is significant uncertainty in any Mineral Resource and Mineral Reserve estimate and the actual deposits encountered and the economic viability of a deposit may differ materially from estimates. Estimated Mineral Resource and Mineral Reserves may have to be re-estimated based on changes in prices of gold or other minerals, further exploration or development activity or actual production experience. This could materially and adversely affect estimates of the volume or grade of mineralization, estimated recovery rates or other important factors that influence such estimates. In addition, there is no assurance that any Mineral Resource estimate will ultimately be reclassified as proven or probable Mineral Reserves. Mineral Resources which are not Mineral Reserves do not have demonstrated economic viability. If operators reduce their Mineral Reserves and Mineral Resources on properties underlying OR Royalties’ royalties, streams or other interests, this may result in a material and adverse effect on OR Royalties’ profitability, results of operations, financial condition and the trading price of OR Royalties’ securities. The Mineral Resources disclosed in this Presentation are based on best available information as of April 10, 2026. Resources are exclusive of reserves in all cases. Gold equivalent ounces comprise mostly gold, other elements are converted assuming forecast long-term prices from analyst consensus published on March 3, 2026. Attributable GEOs were compiled without consideration for the potential mining or metallurgical recovery of the metals contained in the Mineral Resource or Reserve. Detailed Resource and Reserve estimation and applicable royalty or stream interests can be found in the following appendix pages and at www.orroyalties.com. Refer to Capstone Copper Corp’s press release titled “Capstone Copper Announces 2026 Guidance” and dated February 17, 2026. Refer to Capstone Copper Corp’s press release titled “Capstone Copper Reports Second Quarter 2026 Results” and dated July 30, 2026. Refer to Ramelius Resources’ press release titled “Never Never PFS; Maiden 1.6Moz Ore Reserve – Mt Magnet Plant Throughput Up to 5Mtpa” and dated October 28, 2025. Refer to Ramelius Resources’ press release titled “March 2026 Quarter Update FY26 Production Guidance Confirmed” and dated April 7, 2026. Refer to Newmont Corporation’s press release titled “Newmont Reports Fourth Quarter and Full Year 2024 Results; Provides Full Year 2025 Guidance” and dated February 20, 2025. Refer to OR Royalties’ “2026 Presentation” and published May 6, 2026. Refer to Central Asia Metals PLC’s press release titled “Sasa Mineral Resource and Ore Reserve Statement” and dated March 3, 2026. Refer to Central Asia Metals PLC’s press release titled “2025 Operations Update” and dated January 8, 2026. Refer to Eldorado Gold Corp’s Management’s Discussion and Analysis For the Three and Twelve Months Ended December 31, 2025 and published on February 19, 2026. Refer to Eldorado Gold Corp’s press release titled “Eldorado Gold Releases Updated Mineral Reserve and Mineral Resource Statement; Offsetting Depletion and Increasing Mineral Reserves at Key Operations” and dated November 26, 2025. Refer to Eldorado Gold Corp’s press release titled “Eldorado Gold Announces Receipt of the Operating Authorization for the Ormaque Deposit at the Lamaque Complex” and dated March 16, 2026. Refer to Taseko Mine’s Limited press release titled “Taseko Announces a 40% Increase in Gibraltar Proven and Probable Reserves” and dated March 30, 2022. Refer to Taseko Mine’s Limited press release titled “Taseko Signs Definitive Agreement to Acquire 12.5% Interest in Gibraltar Copper Mine” and dated February 22, 2023. Refer to OR Royalties’ press release titled “Osisko Announces Acquisition of Additional Gibraltar Silver Stream Interest and Closing of the Dalgaranga Royalties Acquisition” and dated December 23, 2024. 23
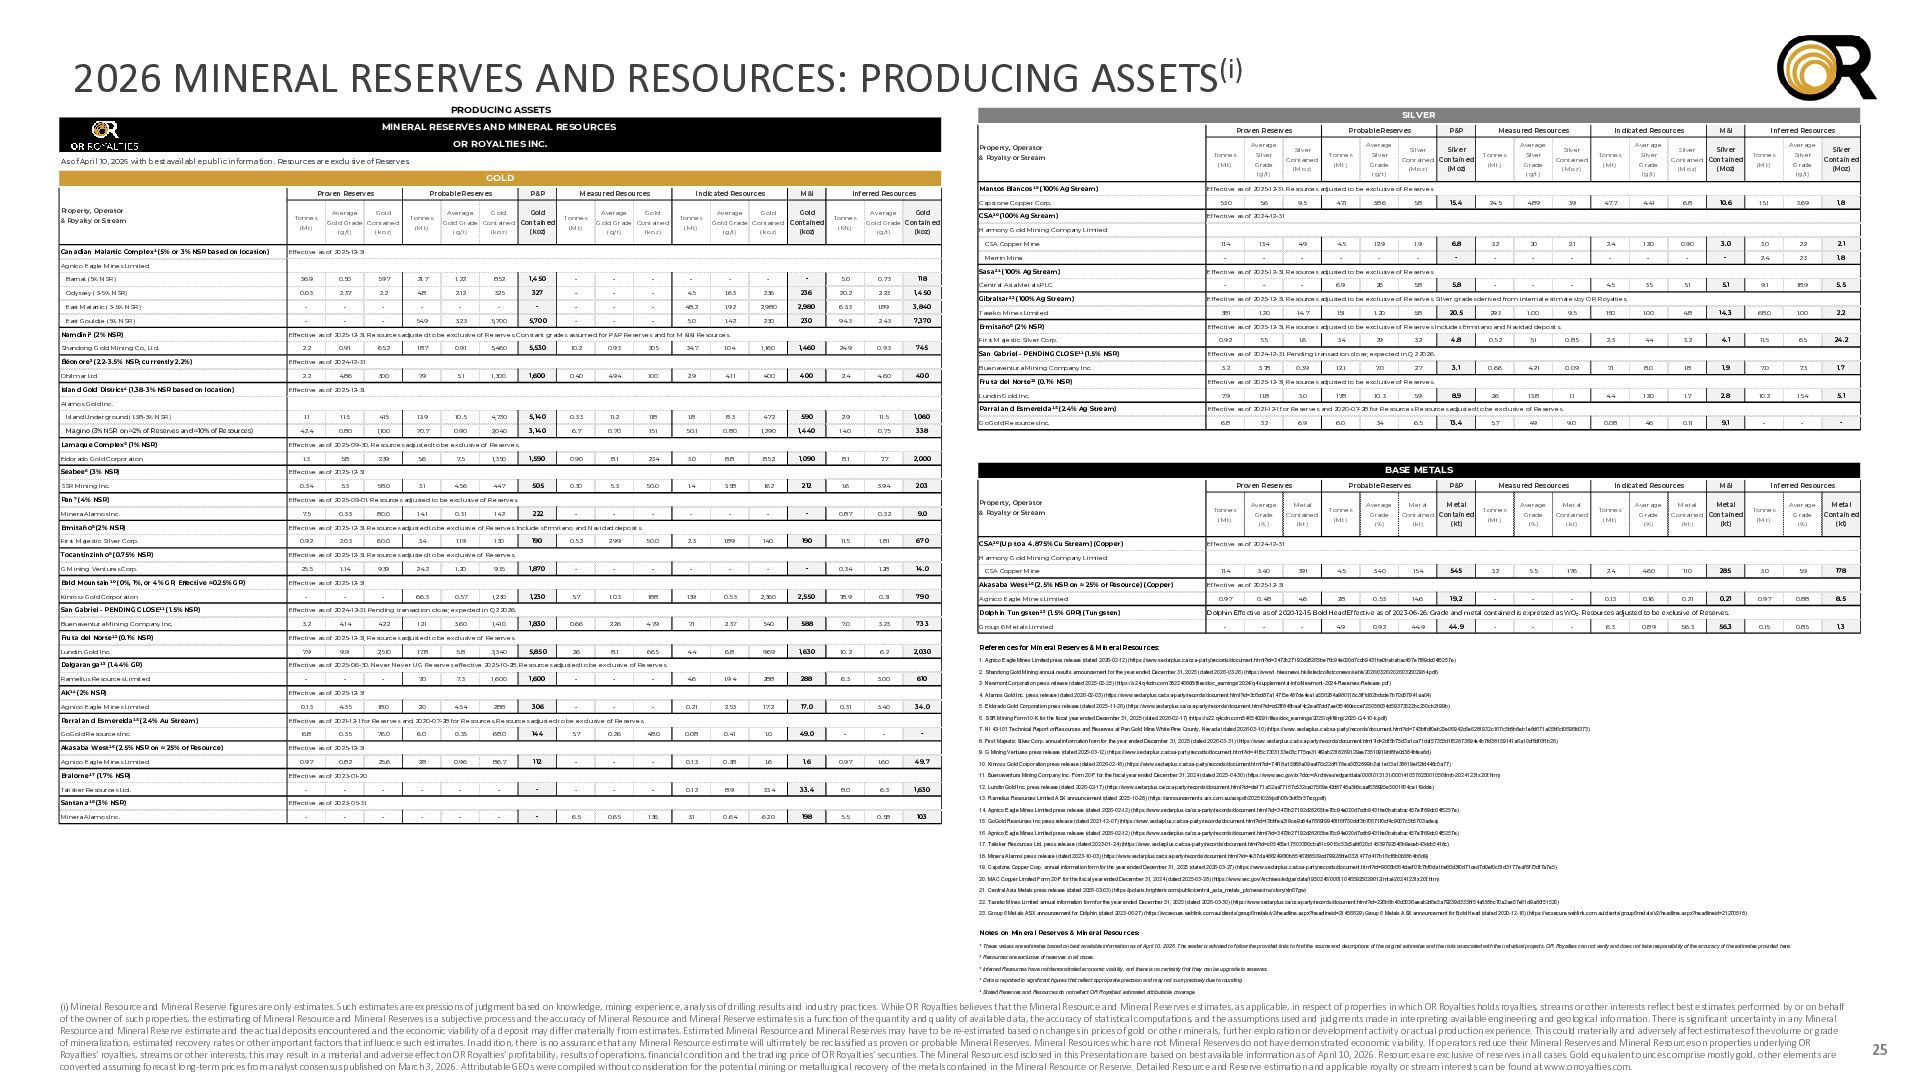
  22. 2026 MINERAL RESERVES AND RESOURCES: PRODUCING ASSETS(i) PRODUCING ASSETS SILVER

    MINERAL RESERVES AND MINERAL RESOURCES Proven Reserves OR ROYALTIES INC. Property, Operator & Royalty or Stream As of April 10, 2026 with best available public information. Resources are exclusive of Reserves. Average Tonnes Silver (Mt) Grade Probable Reserves P&P Average Gold Measured Resources Indicated Resources M&I Average Gold Mantos Blancos¹⁹ (100% Ag Stream) Inferred Resources Capstone Copper Corp. Property, Operator & Royalty or Stream Canadian Malartic Complex¹ (5% or 3% NSR based on location) Tonnes (Mt) Average Gold Gold Grade Contained (g/t) (koz) Tonnes (Mt) Gold Gold Grade Contained Contained (g/t) (koz) (koz) Tonnes (Mt) Average Gold Gold Grade Contained (g/t) (koz) Tonnes (Mt) Gold Gold Grade Contained Contained (g/t) (koz) (koz) Tonnes (Mt) Average Gold Gold Grade Contained (g/t) (koz) Effective as of 2025-12-31 Agnico Eagle Mines Limited Barnat (5% NSR) 36.9 0.50 597 21.7 1.22 852 1,450 - - - - - - - 5.0 0.73 118 Odyssey (3-5% NSR) 0.03 2.37 2.2 4.8 2.12 325 327 - - - 4.5 1.63 236 236 20.2 2.23 1,450 - - - - - - - - - - 48.2 1.92 2,980 2,980 63.3 1.89 3,840 - - - 54.9 3.23 5,700 5,700 - - - 5.0 1.42 230 230 94.3 2.43 7,370 East Malartic (3-5% NSR) East Gouldie (5% NSR) Namdini² (2% NSR) Shandong Gold Mining Co., Ltd. Éléonore³ (2.2-3.5% NSR; currently 2.2%) Dhilmar Ltd Island Gold District⁴ (1.38-3% NSR based on location) Effective as of 2025-12-31. Resources adjusted to be exclusive of Reserves. Constant grades assumed for P&P Reserves and for M&I&I Resources. 2.2 0.91 65.2 187 0.91 5,460 5,530 10.2 0.93 305 34.7 1.04 1,160 1,460 24.9 0.93 745 300 7.9 5.1 1,300 1,600 0.40 4.94 100 2.9 4.11 400 400 2.4 4.60 400 Effective as of 2024-12-31 2.2 4.86 Effective as of 2025-12-31. Magino (3% NSR on ≈2% of Reserves and ≈10% of Resources) Lamaque Complex⁵ (1% NSR) Eldorado Gold Corporation Seabee⁶ (3% NSR) SSR Mining Inc. Pan⁷ (4% NSR) Minera Alamos Inc. Ermitaño⁸ (2% NSR) First Majestic Silver Corp. Tocantinzinho⁹ (0.75% NSR) G Mining Ventures Corp. Bald Mountain¹⁰ (0%, 1%, or 4% GR; Effective ≈0.25% GR) Kinross Gold Corporation San Gabriel - PENDING CLOSE¹¹ (1.5% NSR) Buenaventura Mining Company Inc. Fruta del Norte¹² (0.1% NSR) Lundin Gold Inc. Dalgaranga¹³ (1.44% GR) Ramelius Resources Limited AK¹⁴ (2% NSR) Agnico Eagle Mines Limited Parral and Esmerelda¹⁵ (2.4% Au Stream) GoGold Resources Inc. Akasaba West¹⁶ (2.5% NSR on ≈ 25% of Resource) Agnico Eagle Mines Limited Bralorne¹⁷ (1.7% NSR) Talisker Resources Ltd. Santana¹⁸ (3% NSR) Minera Alamos Inc. CSA²⁰ (100% Ag Stream) Contained (Moz) 1.1 11.5 415 13.9 10.5 4,730 5,140 0.33 11.2 118 1.8 8.3 472 590 2.9 11.5 1,060 42.4 0.80 1,100 70.7 0.90 2,040 3,140 6.7 0.70 151 50.1 0.80 1,290 1,440 14.0 0.75 338 Average Tonnes Silver (Mt) Grade (g/t) P&P Silver Silver Contained Contained (Moz) (Moz) Measured Resources Average Tonnes Silver (Mt) Grade Indicated Resources Silver Contained (Moz) (g/t) Average Tonnes Silver (Mt) Grade (g/t) M&I Silver Silver Contained Contained (Moz) (Moz) Inferred Resources Average Tonnes Silver (Mt) Grade (g/t) Silver Contained (Moz) Effective as of 2025-12-31. Resources adjusted to be exclusive of Reserves. 53.0 5.6 9.5 47.1 3.86 5.8 15.4 24.5 4.89 3.9 47.7 4.41 6.8 10.6 15.1 3.69 1.8 Effective as of 2024-12-31 Harmony Gold Mining Company Limited CSA Copper Mine 11.4 13.4 4.9 4.5 12.9 1.9 6.8 3.2 20 2.1 2.4 12.0 0.90 3.0 3.0 22 2.1 Merrin Mine - - - - - - - - - - - - - - 2.4 23 1.8 5.8 - - - 4.5 35 5.1 5.1 9.1 18.9 5.5 Sasa²¹ (100% Ag Stream) Central Asia Metals PLC Gibraltar²² (100% Ag Stream) Taseko Mines Limited Ermitaño⁸ (2% NSR) First Majestic Silver Corp. San Gabriel - PENDING CLOSE¹¹ (1.5% NSR) Buenaventura Mining Company Inc. Fruta del Norte¹² (0.1% NSR) Lundin Gold Inc. Alamos Gold Inc. Island Underground (1.38-3% NSR) Silver (g/t) GOLD Proven Reserves Probable Reserves Parral and Esmerelda¹⁵ (2.4% Ag Stream) GoGold Resources Inc. Effective as of 2025-12-31. Resources adjusted to be exclusive of Reserves. - - - 6.9 26 5.8 Effective as of 2025-12-31. Resources adjusted to be exclusive of Reserves. Silver grades derived from internal estimates by OR Royalties. 381 1.20 14.7 151 1.20 20.5 5.8 9.5 150 1.00 4.8 14.3 68.0 1.00 2.2 4.8 0.52 51 0.85 2.3 44 3.2 4.1 11.5 65 24.2 3.1 0.66 4.21 0.09 7.1 8.0 1.8 1.9 7.0 7.3 1.7 8.9 2.6 13.8 1.1 4.4 12.0 1.7 2.8 10.2 15.4 5.1 9.0 0.08 46 0.11 9.1 - - - 293 1.00 Effective as of 2025-12-31. Resources adjusted to be exclusive of Reserves. Includes Ermitano and Navidad deposits. 0.92 55 1.6 3.4 29 3.2 Effective as of 2024-12-31. Pending transaction close; expected in Q2 2026. 3.2 3.78 0.39 12.1 7.0 2.7 Effective as of 2025-12-31, Resources adjusted to be exclusive of Reserves. 7.9 11.8 3.0 17.8 10.3 5.9 Effective as of 2021-12-1 for Reserves and 2020-07-28 for Resources. Resources adjusted to be exclusive of Reserves. 6.8 32 6.9 6.0 34 13.4 6.5 5.7 49 Effective as of 2025-09-30. Resources adjusted to be exclusive of Reserves. 1.3 5.8 239 5.6 7.5 1,350 1,590 0.90 8.1 234 3.0 8.8 852 1,090 8.1 7.7 2,000 58.0 3.1 4.56 447 505 0.30 5.3 50.0 1.4 3.58 162 212 1.6 3.94 203 BASE METALS Effective as of 2025-12-31 0.34 5.3 Effective as of 2025-09-01. Resources adjusted to be exclusive of Reserves. 7.5 0.33 80.0 14.1 0.31 142 Proven Reserves Property, Operator 222 - - - - - - - 0.87 0.32 9.0 & Royalty or Stream Effective as of 2025-12-31. Resources adjusted to be exclusive of Reserves. Includes Ermitano and Navidad deposits. 0.92 2.03 60.0 3.4 1.19 130 190 0.52 2.99 50.0 2.3 1.89 140 190 11.5 1.81 670 Effective as of 2025-12-31. Resources adjusted to be exclusive of Reserves. 25.5 1.14 - 24.2 1.20 935 1,870 - - - - - - - 0.34 1.28 14.0 - 66.3 0.57 1,230 1,230 5.7 1.03 188 139 0.53 2,360 2,550 78.9 0.31 790 4.14 1,830 0.66 2.26 47.9 7.1 2.37 540 588 7.0 3.23 733 5,850 2.6 8.1 665 4.4 6.8 969 1,630 10.2 6.2 2,030 CSA Copper Mine Akasaba West¹⁶ (2.5% NSR on ≈ 25% of Resource) (Copper) Effective as of 2024-12-31. Pending transaction close; expected in Q2 2026. 3.2 422 12.1 3.60 1,410 (Mt) Average Metal Grade Contained (%) (kt) P&P Average Metal Tonnes (Mt) Grade Metal Contained Contained Measured Resources Tonnes (Mt) Average Metal Grade Contained (%) (kt) Indicated Resources M&I Average Metal Tonnes (Mt) (%) (kt) (kt) 3.40 154 545 3.2 5.5 176 2.4 19.2 - - - 0.13 Grade Metal Contained Contained (%) (kt) (kt) 4.60 110 285 0.21 Inferred Resources Average Metal Grade Contained (%) (kt) 3.0 5.9 178 0.97 0.88 8.5 0.15 0.85 1.3 Tonnes (Mt) Effective as of 2024-12-31 Harmony Gold Mining Company Limited 939 Effective as of 2025-12-31 - CSA²⁰ (Up to a 4.875% Cu Stream) (Copper) Tonnes Probable Reserves Agnico Eagle Mines Limited Dolphin Tungsten²³ (1.5% GRR) (Tungsten) Group 6 Metals Limited 11.4 3.40 391 4.5 Effective as of 2025-12-31 0.97 0.48 4.6 2.8 0.53 14.6 0.16 0.21 Dolphin Effective as of 2020-12-15. Bold Head Effective as of 2023-06-26. Grade and metal contained is expressed as WO₃. Resources adjusted to be exclusive of Reserves. - - - 4.9 0.92 44.9 44.9 - - - 6.3 0.89 56.3 56.3 Effective as of 2025-12-31, Resources adjusted to be exclusive of Reserves. 7.9 9.9 2,510 17.8 5.8 3,340 1. Agnico Eagle Mines Limited press release (dated 2026-02-12) (https://www.sedarplus.ca/csa-party/records/document.html?id=3473b27192d28265be76c94e020d7cdb9431be0bababac457e7f89dc04f5257e) Effective as of 2025-06-30. Never Never UG Reserves effective 2025-10-28. Resources adjusted to be exclusive of Reserves. - - - 7.0 7.3 1,600 1,600 - - - 4.6 1.94 288 288 6.3 3.00 610 18.0 2.0 4.54 288 306 - - - 0.21 2.53 17.2 17.0 0.31 3.40 34.0 Effective as of 2025-12-31 0.13 4.35 0.35 0.82 6.0 0.35 68.0 144 5.7 0.26 48.0 0.08 0.41 1.0 49.0 - - - 25.6 2.8 0.96 86.7 112 - - - 0.13 0.38 1.6 1.6 0.97 1.60 49.7 - - - - - - - - - 0.12 8.9 33.4 33.4 8.0 6.3 1,630 - - - - - - 6.5 0.65 136 3.1 0.64 62.0 198 5.5 0.58 103 7. NI 43-101 Technical Report onResources and Reserves at Pan Gold Mine White Pine County, Nevada (dated 2026-03-10) (https://www.sedarplus.ca/csa-party/records/document.html?id=743bffdf0eb23e06942c6e6281932c167c5b8b8eb1e8d671a05b6cf0696fd373) 8. First Majestic Silver Corp. annual information form for the year ended December 31, 2025 (dated 2026-03-31) (https://www.sedarplus.ca/csa-party/records/document.html?id=2df5b75d3a1ca71daf57353d1f52873894e4b7fd38159141a6a10cf6df0f1b26) 10. Kinross Gold Corporation press release (dated 2026-02-18) (https://www.sedarplus.ca/csa-party/records/document.html?id=74f18a15888a09aaf70c22df178ea5032899b3a11e03a138619e62fd448c5a77) 11. Buenaventura Mining Company Inc. Form 20-F for the fiscal year ended December 31, 2024 (dated 2025-04-30) (https://www.sec.gov/ix?doc=/Archives/edgar/data/0001013131/000141057825001056/tmb-20241231x20f.htm) 12. Lundin Gold Inc. press release (dated 2026-02-17) (https://www.sedarplus.ca/csa-party/records/document.html?id=de171a52aa77167c532ce07569e43d8748a3b8caaf638995e5001664ce119dde) 13. Ramelius Resources Limited ASX announcement (dated 2025-10-28) (https://announcements.asx.com.au/asxpdf/20251028/pdf/06r3xt65r37rsq.pdf) Effective as of 2023-05-31 - 5. Eldorado Gold Corporation press release (dated 2025-11-26) (https://www.sedarplus.ca/csa-party/records/document.html?id=cd2ff848baaf4c2ea67dd7ae0f5480ecce725058034d59373522bc250cb2199b) 9. G Mining Ventures press release (dated 2025-03-12) (https://www.sedarplus.ca/csa-party/records/document.html?id=41f5c7303133e03c775ce314f9ab2318269129ae73510919bf8fe0d384bfea8d) Effective as of 2023-01-20 - 3. Newmont Corporation press release (dated 2025-02-25) (https://s24.q4cdn.com/382246808/files/doc_earnings/2024/q4/supplemental-info/Newmont-2024-Reserves-Release.pdf) 6. SSR Mining Form 10-K for the fiscal year ended December 31, 2025 (dated 2026-02-17) (https://s22.q4cdn.com/546540291/files/doc_earnings/2025/q4/filing/2025-Q4-10-k.pdf) 76.0 Effective as of 2025-12-31 0.97 2. Shandong Gold Mining annual results announcement for the year ended December 31, 2025 (dated 2026-03-26) (https://www1.hkexnews.hk/listedco/listconews/sehk/2026/0326/2026032602984.pdf) 4. Alamos Gold Inc. press release (dated 2026-02-03) (https://www.sedarplus.ca/csa-party/records/document.html?id=3c6cd87a14715e487de4ea1a556284a980118c3ff1d82bdcde7b70d37941aa04) Effective as of 2021-12-1 for Reserves and 2020-07-28 for Resources. Resources adjusted to be exclusive of Reserves. 6.8 References for Mineral Reserves & Mineral Resources: 14. Agnico Eagle Mines Limited press release (dated 2026-02-12) (https://www.sedarplus.ca/csa-party/records/document.html?id=3473b27192d28265be76c94e020d7cdb9431be0bababac457e7f89dc04f5257e) 15. GoGold Resources Inc press release (dated 2021-12-07) (https://www.sedarplus.ca/csa-party/records/document.html?id=f3bbfea319ce9a84a7669f99481f6f750ddf3b70671f0cf4c9007c5b5703adea) 16. Agnico Eagle Mines Limited press release (dated 2026-02-12) (https://www.sedarplus.ca/csa-party/records/document.html?id=3473b27192d28265be76c94e020d7cdb9431be0bababac457e7f89dc04f5257e) 17. Talisker Resources Ltd. press release (dated 2023-01-24) (https://www.sedarplus.ca/csa-party/records/document.html?id=c05465e17503330cba81c9015c53c5afd620c14539792546b9eceb43dcb5418c) 18. Minera Alamos press release (dated 2023-10-03) (https://www.sedarplus.ca/csa-party/records/document.html?id=4e37da4862496f0b85467d8509cd79928bfe0321477d417b16cf8b0b38b4b6d9) 19. Capstone Copper Corp. annual information form for the year ended December 31, 2025 (dated 2026-03-27) (https://www.sedarplus.ca/csa-party/records/document.html?id=9665b664dacf07c7bf6da1be66d3f0d71ced7d0ef0c61d3177ea78f73df7a7e5) 20. MAC Copper Limited Form 20-F for the fiscal year ended December 31, 2024 (dated 2025-03-28) (https://www.sec.gov/Archives/edgar/data/1950246/000110465925029012/mtal-20241231x20f.htm) 21. Central Asia Metals press release (dated 2026-03-03) (https://polaris.brighterir.com/public/central_asia_metals_plc/news/rns/story/xln67gw) 22. Taseko Mines Limited annual information form for the year ended December 31, 2025 (dated 2026-03-30) (https://www.sedarplus.ca/csa-party/records/document.html?id=226b8b40d3036aeab2d6e5a79239d333bf54a838bc70a2ae57e61d9a80f51520) 23. Group 6 Metals ASX announcement for Dolphin (dated 2023-06-27) (https://wcsecure.weblink.com.au/clients/group6metals/v2/headline.aspx?headlineid=21456629) Group 6 Metals ASX announcement for Bold Head (dated 2020-12-16) (https://wcsecure.weblink.com.au/clients/group6metals/v2/headline.aspx?headlineid=21270518) Notes on Mineral Reserves & Mineral Resources: * These values are estimates based on best available information as of April 10, 2026. The reader is advised to follow the provided links to find the source and descriptions of the original estimates and the risks associated with the individual projects. OR Royalties can not verify and does not take responsibility of the accuracy of the estimates provided here. * Resources are exclusive of reserves in all cases. * Inferred Resources have not demonstrated economic viability, and there is no certainty that they can be upgrade to reserves. * Data is reported to significant figures that reflect appropriate precision and may not sum precisely due to rounding * Stated Reserves and Resources do not reflect OR Royalties' estimated attributable coverage (i) Mineral Resource and Mineral Reserve figures are only estimates. Such estimates are expressions of judgment based on knowledge, mining experience, analysis of drilling results and industry practices. While OR Royalties believes that the Mineral Resource and Mineral Reserves estimates, as applicable, in respect of properties in which OR Royalties holds royalties, streams or other interests reflect best estimates performed by or on behalf of the owner of such properties, the estimating of Mineral Resource and Mineral Reserves is a subjective process and the accuracy of Mineral Resource and Mineral Reserve estimates is a function of the quantity and quality of available data, the accuracy of statistical computations, and the assumptions used and judgments made in interpreting available engineering and geological information. There is significant uncertainty in any Mineral Resource and Mineral Reserve estimate and the actual deposits encountered and the economic viability of a deposit may differ materially from estimates. Estimated Mineral Resource and Mineral Reserves may have to be re-estimated based on changes in prices of gold or other minerals, further exploration or development activity or actual production experience. This could materially and adversely affect estimates of the volume or grade of mineralization, estimated recovery rates or other important factors that influence such estimates. In addition, there is no assurance that any Mineral Resource estimate will ultimately be reclassified as proven or probable Mineral Reserves. Mineral Resources which are not Mineral Reserves do not have demonstrated economic viability. If operators reduce their Mineral Reserves and Mineral Resources on properties underlying OR Royalties’ royalties, streams or other interests, this may result in a material and adverse effect on OR Royalties’ profitability, results of operations, financial condition and the trading price of OR Royalties’ securities. The Mineral Resources disclosed in this Presentation are based on best available information as of April 10, 2026. Resources are exclusive of reserves in all cases. Gold equivalent ounces comprise mostly gold, other elements are converted assuming forecast long-term prices from analyst consensus published on March 3, 2026. Attributable GEOs were compiled without consideration for the potential mining or metallurgical recovery of the metals contained in the Mineral Resource or Reserve. Detailed Resource and Reserve estimation and applicable royalty or stream interests can be found at www.orroyalties.com. 25
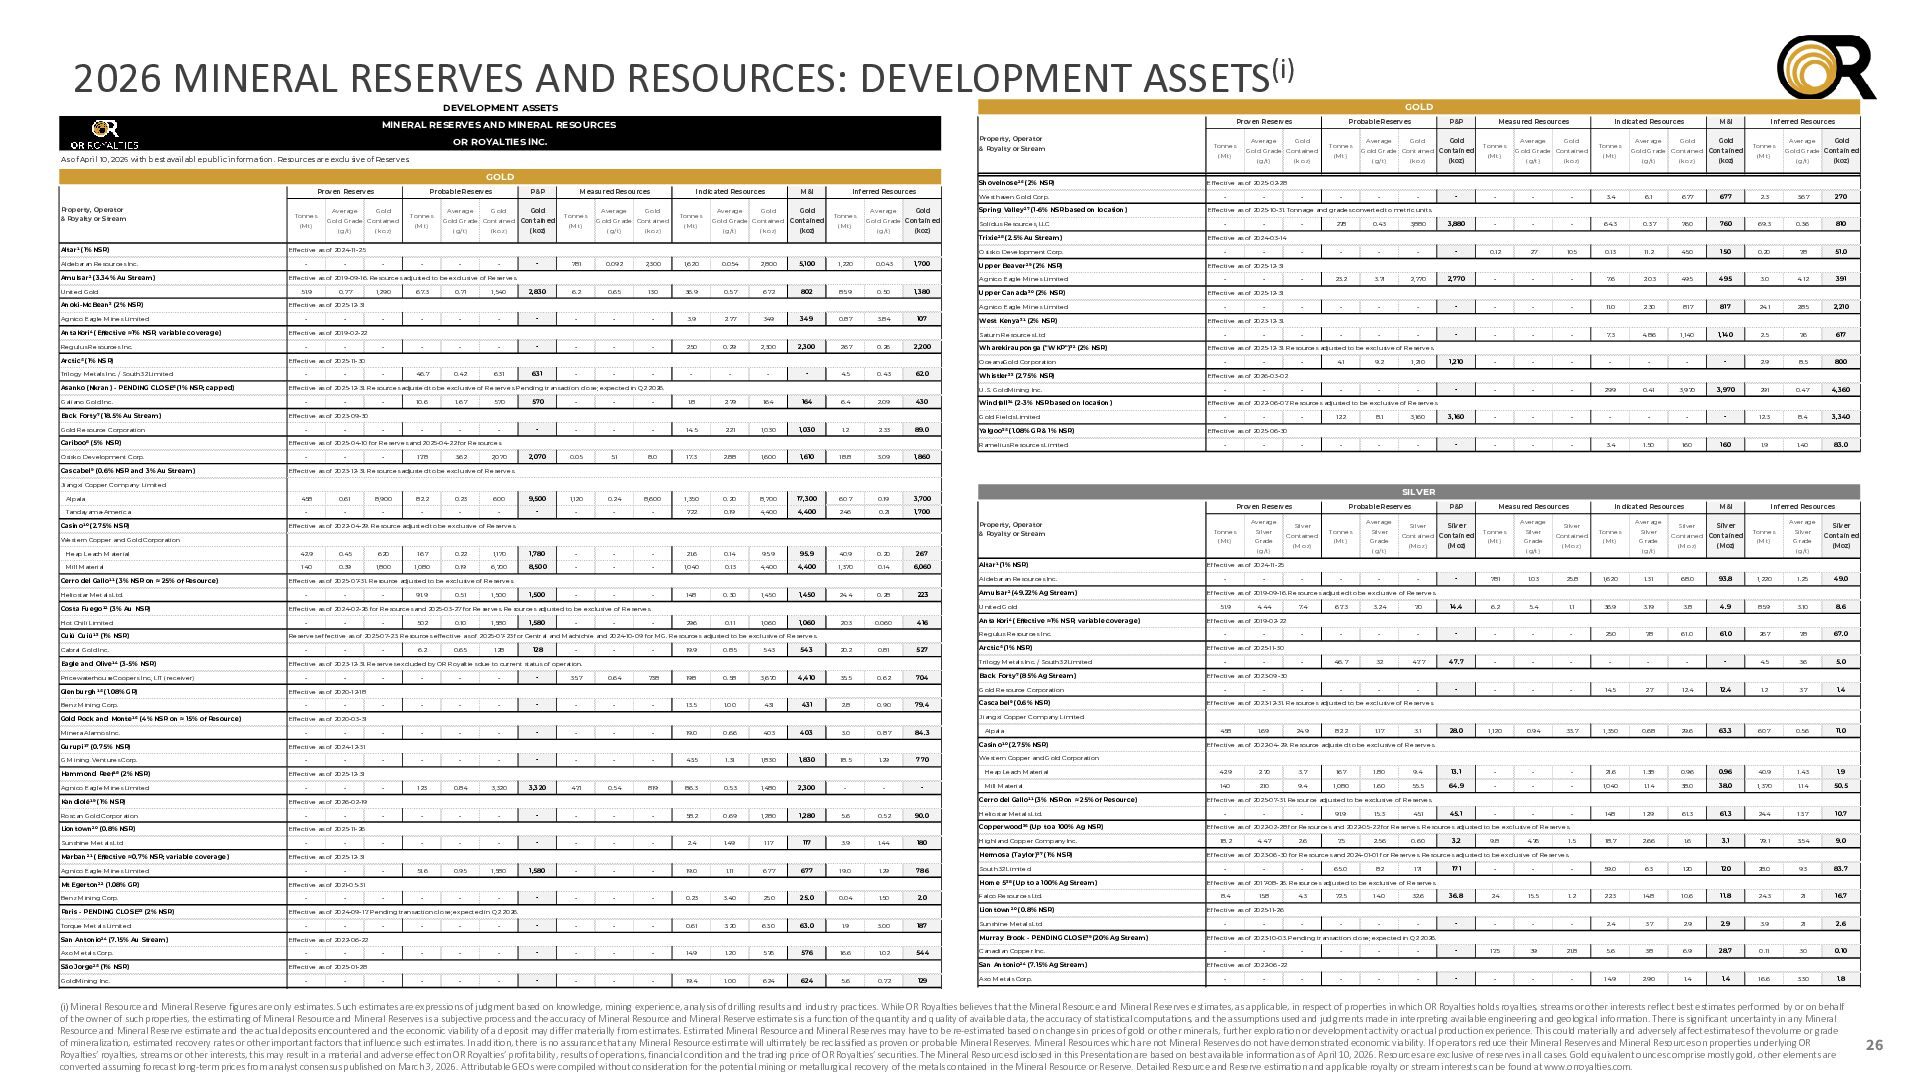
  23. 2026 MINERAL RESERVES AND RESOURCES: DEVELOPMENT ASSETS(i) GOLD DEVELOPMENT ASSETS

    Proven Reserves MINERAL RESERVES AND MINERAL RESOURCES Property, Operator OR ROYALTIES INC. & Royalty or Stream As of April 10, 2026 with best available public information. Resources are exclusive of Reserves. GOLD Proven Reserves Property, Operator & Royalty or Stream Altar¹ (1% NSR) Aldebaran Resources Inc. Amulsar² (3.34% Au Stream) United Gold Anoki-McBean³ (2% NSR) Agnico Eagle Mines Limited AntaKori⁴ (Effective ≈1% NSR; variable coverage) Regulus Resources Inc. Arctic⁵ (1% NSR) Trilogy Metals Inc. / South32 Limited Asanko (Nkran) - PENDING CLOSE⁶ (1% NSR; capped) Galiano Gold Inc. Back Forty⁷ (18.5% Au Stream) Gold Resource Corporation Cariboo⁸ (5% NSR) Osisko Development Corp. Cascabel⁹ (0.6% NSR and 3% Au Stream) Tonnes (Mt) Average Gold Gold Grade Contained (g/t) (koz) Shovelnose²⁶ (2% NSR) Probable Reserves P&P Measured Resources Indicated Resources M&I Inferred Resources Average Gold Average Average Gold Average Tonnes (Mt) Gold Gold Grade Contained Contained (g/t) (koz) (koz) Tonnes (Mt) Gold Gold Grade Contained (g/t) (koz) Tonnes (Mt) Gold Gold Grade Contained Contained (g/t) (koz) (koz) Tonnes (Mt) Westhaven Gold Corp. Gold Gold Grade Contained (g/t) (koz) Effective as of 2024-11-25 - - 0.77 - 1,290 - 67.3 - 0.71 - 1,540 - 781 0.092 2,300 1,620 0.054 2,800 5,100 1,220 0.043 1,700 2,830 6.2 0.65 130 36.9 0.57 672 802 85.9 0.50 1,380 - - - - - - - - - - 3.9 2.77 349 349 0.87 3.84 107 - - - - - - - - 250 0.29 2,300 2,300 267 0.26 2,200 - - - - - - 4.5 0.43 62.0 - 10.6 1.67 570 570 - - - 1.8 2.79 164 164 6.4 2.09 430 - - - - - - - - 14.5 2.21 1,030 1,030 1.2 2.33 89.0 - 46.7 0.42 631 631 - - - - - Whistler³³ (2.75% NSR) Windfall³⁴ (2-3% NSR based on location) Gold Fields Limited Effective as of 2025-04-10 for Reserves and 2025-04-22 for Resources. - Wharekirauponga ("WKP")³² (2% NSR) U.S. GoldMining Inc. Effective as of 2023-09-30 - West Kenya³¹ (2% NSR) OceanaGold Corporation Effective as of 2025-12-31. Resources adjusted to be exclusive of Reserves. Pending transaction close; expected in Q2 2026. - Upper Canada³⁰ (2% NSR) Saturn Resources Ltd Effective as of 2025-11-30 - Upper Beaver²⁹ (2% NSR) Agnico Eagle Mines Limited Effective as of 2019-02-22 - Trixie²⁸ (2.5% Au Stream) Agnico Eagle Mines Limited Effective as of 2025-12-31 - Solidus Resources, LLC Osisko Development Corp. Effective as of 2019-09-16. Resources adjusted to be exclusive of Reserves. 51.9 Spring Valley²⁷ (1-6% NSR based on location) - 17.8 3.62 2,070 Yalgoo³⁵ (1.08% GR & 1% NSR) Ramelius Resources Limited 2,070 0.05 5.1 8.0 17.3 2.88 1,600 1,610 18.8 3.09 1,860 Tonnes (Mt) Average Gold Gold Grade Contained (g/t) (koz) Probable Reserves P&P Average Gold Tonnes (Mt) Gold Grade Contained Contained (g/t) (koz) (koz) - - - Tandayama-Ameríca Casino¹⁰ (2.75% NSR) 458 0.61 8,900 82.2 0.23 600 9,500 1,120 0.24 8,600 1,350 0.20 8,700 17,300 607 0.19 3,700 - - - - - - - - - - 722 0.19 4,400 4,400 246 0.21 1,700 0.45 620 167 0.22 1,170 1,780 - - - 21.6 0.14 95.9 95.9 40.9 0.20 267 Mill Material 140 0.39 1,800 1,080 0.19 6,700 8,500 - - - 1,040 0.13 4,400 4,400 1,370 0.14 6,060 1,500 - - - 148 0.30 1,450 1,450 24.4 0.28 223 296 0.11 1,060 1,060 203 0.060 416 Hot Chili Limited Cuiú Cuiú¹³ (1% NSR) Cabral Gold Inc. Eagle and Olive¹⁴ (3-5% NSR) PricewaterhouseCoopers Inc., LIT (receiver) Glenburgh¹⁵ (1.08% GR) Benz Mining Corp. Gold Rock and Monte¹⁶ (4% NSR on ≈ 15% of Resource) Minera Alamos Inc. Gurupi¹⁷ (0.75% NSR) G Mining Ventures Corp. Hammond Reef¹⁸ (2% NSR) Agnico Eagle Mines Limited Kandiolé¹⁹ (1% NSR) Roscan Gold Corporation Liontown²⁰ (0.8% NSR) Sunshine Metals Ltd Marban²¹ (Effective ≈0.7% NSR; variable coverage) Agnico Eagle Mines Limited Mt Egerton²² (1.08% GR) Benz Mining Corp. Paris - PENDING CLOSE²³ (2% NSR) Torque Metals Limited San Antonio²⁴ (7.15% Au Stream) Axo Metals Corp. São Jorge²⁵ (1% NSR) GoldMining Inc. Gold Grade Contained (g/t) (koz) - - Indicated Resources M&I Average Gold Tonnes (Mt) Gold Gold Grade Contained Contained (g/t) (koz) (koz) 3.4 6.1 677 677 Inferred Resources Tonnes (Mt) Average Gold Gold Grade Contained (g/t) (koz) - - - - - 2.3 3.67 270 - - - 278 0.43 3,880 3,880 - - - 64.3 0.37 760 760 69.3 0.36 810 - - - - - 0.12 27 105 0.13 11.2 45.0 150 0.20 7.8 51.0 - 23.2 3.71 2,770 2,770 - - - 7.6 2.03 495 495 3.0 4.12 391 - - - - - - - - 11.0 2.30 817 817 24.1 2.85 2,210 Effective as of 2024-03-14 - - Effective as of 2025-12-31 - - Effective as of 2025-12-31 - - Effective as of 2023-12-31. - - - - - - 7.3 4.86 1,140 1,140 2.5 7.6 617 - 4.1 9.2 1,210 1,210 - - - - - - - 2.9 8.5 800 - - - - - - - - 299 0.41 3,970 3,970 291 0.47 4,360 - - - - Effective as of 2025-12-31. Resources adjusted to be exclusive of Reserves. - - Effective as of 2026-03-02 - - Effective as of 2022-06-07. Resources adjusted to be exclusive of Reserves. - - - 12.2 8.1 3,160 3,160 - - - - - - - 12.3 8.4 3,340 - - - - - - - - 3.4 1.50 160 160 1.9 1.40 83.0 Effective as of 2025-06-30 - - - - 91.9 0.51 1,500 - - - 502 0.10 1,580 1,580 - - - - - - 19.9 0.85 543 543 20.2 0.81 527 - - - - - 35.7 0.64 738 198 0.58 3,670 4,410 35.5 0.62 704 - - - - - - - - 13.5 1.00 431 431 2.8 0.90 79.4 - 6.2 0.65 128 128 - - - - - - - - - - - - 19.0 0.66 403 403 3.0 0.87 84.3 - - - - - - - - - - 43.5 1.31 1,830 1,830 18.5 1.29 770 - 123 0.84 3,320 3,320 47.1 0.54 819 86.3 0.53 1,480 2,300 - - - - - - - - - - - 58.2 0.69 1,280 1,280 5.6 0.52 90.0 Effective as of 2025-12-31 - - - - - - - - - - - 2.4 1.49 117 117 3.9 1.44 180 - - - - - (Moz) (Mt) Grade (g/t) P&P Silver Silver Contained Contained Measured Resources Average Tonnes Silver (Mt) Grade Indicated Resources Silver Contained Average Tonnes Silver (Mt) Grade (Moz) (Moz) - - 781 1.03 25.8 1,620 1.31 (g/t) (Moz) (g/t) M&I Silver Silver Contained Contained Inferred Resources Average Tonnes Silver (Mt) Grade (Moz) (Moz) 68.0 93.8 1,220 1.25 (g/t) Silver Contained (Moz) Effective as of 2024-11-25 - - - - - 49.0 Effective as of 2019-09-16. Resources adjusted to be exclusive of Reserves. 51.9 4.44 7.4 67.3 3.24 7.0 14.4 6.2 5.4 1.1 36.9 3.19 3.8 4.9 85.9 3.10 8.6 - - - - - - - - 250 7.8 61.0 61.0 267 7.8 67.0 - 46.7 32 47.7 47.7 - - - - - - - 4.5 36 5.0 - - - - - - - - 14.5 27 12.4 12.4 1.2 37 1.4 28.0 1,120 0.94 33.7 1,350 0.68 29.6 63.3 607 0.56 11.0 Effective as of 2019-02-22 - - Effective as of 2025-11-30 - - Effective as of 2023-09-30 - - Effective as of 2023-12-31. Resources adjusted to be exclusive of Reserves. 167 1.80 9.4 13.1 - - - 21.6 1.38 0.96 0.96 40.9 1.43 1.9 1.60 55.5 64.9 - - - 1,040 1.14 38.0 38.0 1,370 1.14 50.5 45.1 - - - 148 12.9 61.3 61.3 24.4 13.7 10.7 Heliostar Metals Ltd. Highland Copper Company Inc. 1,580 - - - 19.0 1.11 677 677 19.0 1.29 786 - - - - 0.23 3.40 25.0 25.0 0.04 1.50 2.0 Falco Resources Ltd. - - - - 0.61 3.20 63.0 63.0 1.9 3.00 187 Horne 5³⁸ (Up to a 100% Ag Stream) Liontown²⁰ (0.8% NSR) Sunshine Metals Ltd Murray Brook - PENDING CLOSE³⁹ (20% Ag Stream) - - - - - - - 14.9 1.20 576 576 16.6 1.02 544 - - - - - - - - 19.4 1.00 624 624 5.6 0.72 129 3.1 1,080 - - 1.17 3.7 1,580 - 82.2 9.4 - - 24.9 2.10 0.95 - 1.69 2.70 - - 458 Effective as of 2022-04-29. Resource adjusted to be exclusive of Reserves. 140 51.6 Canadian Copper Inc. San Antonio²⁴ (7.15% Ag Stream) Effective as of 2025-01-28 - Contained Silver 42.9 - Effective as of 2022-06-22 - Grade Average Tonnes Mill Material - Effective as of 2024-09-17. Pending transaction close; expected in Q2 2026. - (Mt) Silver Heap Leach Material South32 Limited Effective as of 2021-05-31 - Silver Western Copper and Gold Corporation Hermosa (Taylor)³⁷ (1% NSR) Effective as of 2025-12-31 - Alpala Copperwood³⁶ (Up to a 100% Ag NSR) Effective as of 2025-11-26 - Cascabel⁹ (0.6% NSR) Cerro del Gallo¹¹ (3% NSR on ≈ 25% of Resource) Effective as of 2026-02-19 - Back Forty⁷ (85% Ag Stream) Casino¹⁰ (2.75% NSR) Effective as of 2024-12-31 - Probable Reserves Jiangxi Copper Company Limited Effective as of 2020-03-31 - Arctic⁵ (1% NSR) Gold Resource Corporation Effective as of 2020-12-18 - AntaKori⁴ (Effective ≈1% NSR; variable coverage) Trilogy Metals Inc. / South32 Limited Effective as of 2023-12-31. Reserves excluded by OR Royalties due to current status of operation. - Amulsar² (49.22% Ag Stream) Regulus Resources Inc. Reserves effective as of 2025-07-23. Resources effective as of 2025-07-23 for Central and Machichie and 2024-10-09 for MG. Resources adjusted to be exclusive of Reserves. - Altar¹ (1% NSR) United Gold Effective as of 2024-02-26 for Resources and 2025-03-27 for Reserves. Resources adjusted to be exclusive of Reserves. Average Tonnes (g/t) Aldebaran Resources Inc. Effective as of 2025-07-31. Resource adjusted to be exclusive of Reserves. - SILVER & Royalty or Stream 42.9 Costa Fuego¹² (3% Au NSR) Gold Effective as of 2025-10-31. Tonnage and grades converted to metric units. Proven Reserves Property, Operator Effective as of 2022-04-29. Resource adjusted to be exclusive of Reserves. Heap Leach Material Heliostar Metals Ltd. (Mt) Average Effective as of 2023-12-31. Resources adjusted to be exclusive of Reserves. Western Copper and Gold Corporation Cerro del Gallo¹¹ (3% NSR on ≈ 25% of Resource) Measured Resources Tonnes Effective as of 2025-02-28 Jiangxi Copper Company Limited Alpala Gold Axo Metals Corp. Effective as of 2025-07-31. Resource adjusted to be exclusive of Reserves. - - - 91.9 15.3 45.1 Effective as of 2022-02-28 for Resources and 2022-05-22 for Reserves. Resources adjusted to be exclusive of Reserves. 18.2 4.47 2.6 7.5 2.56 0.60 3.2 18.7 2.66 1.6 3.1 79.1 3.54 9.0 171 - - - 59.0 63 120 120 28.0 93 83.7 9.8 4.76 1.5 Effective as of 2023-06-30 for Resources and 2024-01-01 for Reserves. Resources adjusted to be exclusive of Reserves. - - - 65.0 82 171 Effective as of 2017-08-26. Resources adjusted to be exclusive of Reserves. 8.4 15.8 4.3 72.5 14.0 32.6 36.8 2.4 15.5 1.2 22.3 14.8 10.6 11.8 24.3 21 16.7 - - - - - - - - 2.4 37 2.9 2.9 3.9 21 2.6 Effective as of 2025-11-26 - - Effective as of 2023-10-03. Pending transaction close; expected in Q2 2026. - - - - - - - 17.5 39 21.8 5.6 38 6.9 28.7 0.11 30 0.10 - - - - - - - - 14.9 2.90 1.4 1.4 16.6 3.30 1.8 Effective as of 2022-06-22 - - (i) Mineral Resource and Mineral Reserve figures are only estimates. Such estimates are expressions of judgment based on knowledge, mining experience, analysis of drilling results and industry practices. While OR Royalties believes that the Mineral Resource and Mineral Reserves estimates, as applicable, in respect of properties in which OR Royalties holds royalties, streams or other interests reflect best estimates performed by or on behalf of the owner of such properties, the estimating of Mineral Resource and Mineral Reserves is a subjective process and the accuracy of Mineral Resource and Mineral Reserve estimates is a function of the quantity and quality of available data, the accuracy of statistical computations, and the assumptions used and judgments made in interpreting available engineering and geological information. There is significant uncertainty in any Mineral Resource and Mineral Reserve estimate and the actual deposits encountered and the economic viability of a deposit may differ materially from estimates. Estimated Mineral Resource and Mineral Reserves may have to be re-estimated based on changes in prices of gold or other minerals, further exploration or development activity or actual production experience. This could materially and adversely affect estimates of the volume or grade of mineralization, estimated recovery rates or other important factors that influence such estimates. In addition, there is no assurance that any Mineral Resource estimate will ultimately be reclassified as proven or probable Mineral Reserves. Mineral Resources which are not Mineral Reserves do not have demonstrated economic viability. If operators reduce their Mineral Reserves and Mineral Resources on properties underlying OR Royalties’ royalties, streams or other interests, this may result in a material and adverse effect on OR Royalties’ profitability, results of operations, financial condition and the trading price of OR Royalties’ securities. The Mineral Resources disclosed in this Presentation are based on best available information as of April 10, 2026. Resources are exclusive of reserves in all cases. Gold equivalent ounces comprise mostly gold, other elements are converted assuming forecast long-term prices from analyst consensus published on March 3, 2026. Attributable GEOs were compiled without consideration for the potential mining or metallurgical recovery of the metals contained in the Mineral Resource or Reserve. Detailed Resource and Reserve estimation and applicable royalty or stream interests can be found at www.orroyalties.com. 26
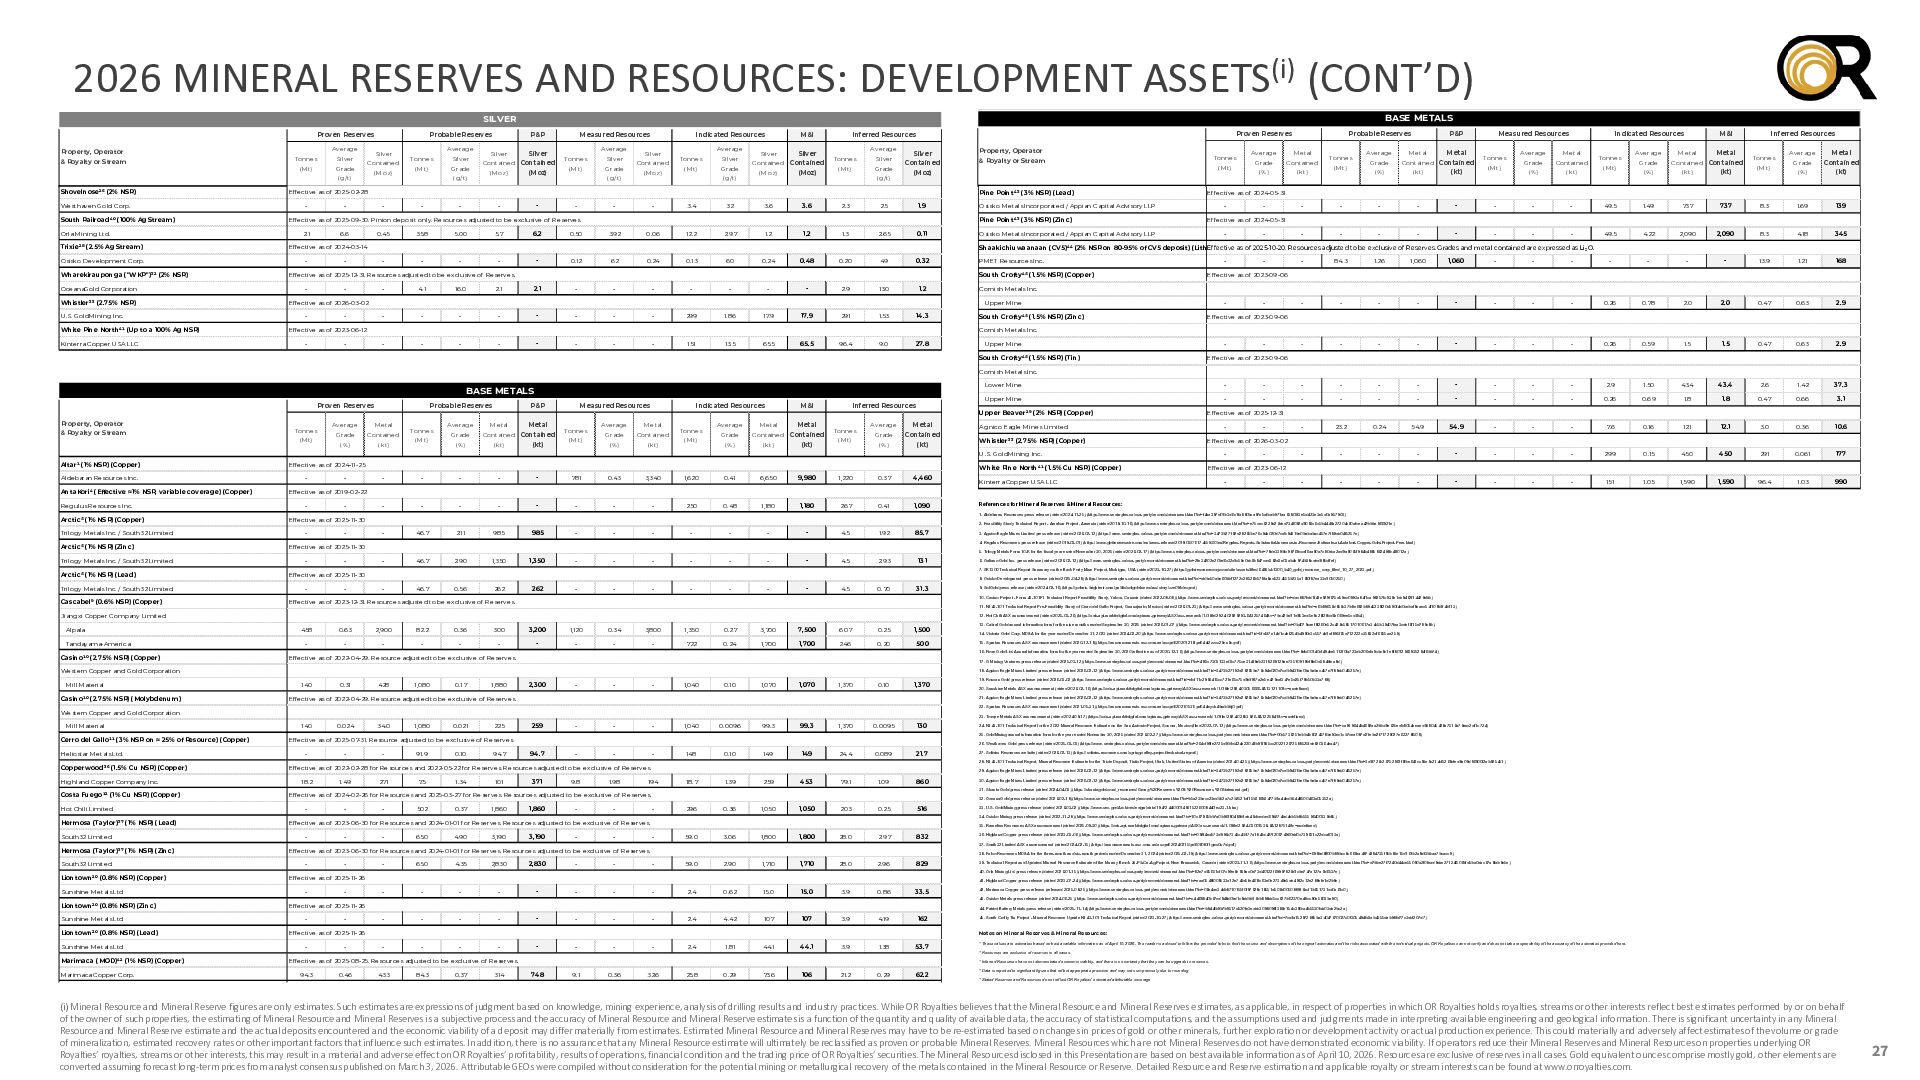
  24. 2026 MINERAL RESERVES AND RESOURCES: DEVELOPMENT ASSETS(i) (CONT’D) BASE METALS

    SILVER Property, Operator & Royalty or Stream Proven Reserves Probable Reserves Average Average Tonnes Silver (Mt) Grade Silver Contained (Moz) (g/t) Shovelnose²⁶ (2% NSR) Westhaven Gold Corp. South Railroad⁴⁰ (100% Ag Stream) Orla Mining Ltd. Trixie²⁸ (2.5% Ag Stream) Osisko Development Corp. Wharekirauponga ("WKP")³² (2% NSR) OceanaGold Corporation Whistler³³ (2.75% NSR) U.S. GoldMining Inc. White Pine North⁴¹ (Up to a 100% Ag NSR) Kinterra Copper USA LLC Tonnes Silver (Mt) Grade (g/t) P&P Silver Silver Contained Contained (Moz) (Moz) Measured Resources Indicated Resources Average Average Tonnes Silver (Mt) Grade (g/t) Silver Contained (Moz) Tonnes Silver (Mt) Grade (g/t) M&I Silver Silver Contained Contained (Moz) (Moz) Proven Reserves Inferred Resources Average Tonnes Silver (Mt) Grade (g/t) Silver Contained - - - - 3.4 32 3.6 3.6 2.3 25 1.9 0.45 35.8 5.00 5.7 6.2 0.50 3.92 0.06 12.2 2.97 1.2 1.2 1.3 2.65 0.11 - - - - - 0.12 62 0.24 0.13 60 0.24 0.48 0.20 49 0.32 - - - - - - - - - Grade Contained (%) (kt) P&P Average Metal Tonnes (Mt) Grade Metal Contained Contained (%) (kt) (kt) Measured Resources Tonnes (Mt) Average Metal Grade Contained (%) (kt) Indicated Resources M&I Average Metal Tonnes (Mt) Grade (%) Metal Contained Contained (kt) (kt) Inferred Resources Tonnes (Mt) Average Metal Grade Contained (%) (kt) - - - - - - - - - - 49.5 1.49 737 737 8.3 1.69 139 - - - - - - - - 49.5 4.22 2,090 2,090 8.3 4.18 345 Effective as of 2024-05-31 - PMET Resources Inc. - 4.1 16.0 2.1 2.1 - - - - - - - 2.9 13.0 1.2 Cornish Metals Inc. - - - - - - - - 299 1.86 17.9 17.9 291 1.53 14.3 South Crofty⁴⁵ (1.5% NSR) (Zinc) - - - - 84.3 1.26 1,060 1,060 - - - - - - - 13.9 1.21 168 - - - - - - - - 0.26 0.78 2.0 2.0 0.47 0.63 2.9 - - - - - - - - 0.26 0.59 1.5 1.5 0.47 0.63 2.9 37.3 Effective as of 2023-09-06 Upper Mine Effective as of 2023-06-12 - Metal Effective as of 2024-05-31 Osisko Metals Incorporated / Appian Capital Advisory LLP South Crofty⁴⁵ (1.5% NSR) (Copper) Effective as of 2026-03-02 - Average Shaakichiuwaanaan (CV5)⁴⁴ (2% NSR on 80-95% of CV5 deposit) (LithEffective as of 2025-10-20. Resources adjusted to be exclusive of Reserves. Grades and metal contained are expressed as Li₂O. Effective as of 2025-12-31. Resources adjusted to be exclusive of Reserves. - (Mt) Osisko Metals Incorporated / Appian Capital Advisory LLP Pine Point⁴³ (3% NSR) (Zinc) Effective as of 2024-03-14 - & Royalty or Stream Pine Point⁴³ (3% NSR) (Lead) Effective as of 2025-09-30. Pinion deposit only. Resources adjusted to be exclusive of Reserves. 6.6 Tonnes (Moz) Effective as of 2025-02-28 2.1 Property, Operator Probable Reserves - - Effective as of 2023-09-06 Cornish Metals Inc. - - - - - - - - - 151 13.5 65.5 65.5 96.4 27.8 9.0 Upper Mine South Crofty⁴⁵ (1.5% NSR) (Tin) - - Effective as of 2023-09-06 Cornish Metals Inc. Lower Mine BASE METALS Proven Reserves Property, Operator & Royalty or Stream Tonnes (Mt) Average Metal Grade Contained (%) (kt) Probable Reserves P&P Measured Resources Average Metal Average Metal Grade Contained (%) (kt) Tonnes (Mt) Grade (%) Metal Contained Contained (kt) (kt) Tonnes (Mt) Upper Mine Indicated Resources M&I Inferred Resources Average Metal Average Metal Grade Contained (%) (kt) Tonnes (Mt) Grade (%) Metal Contained Contained (kt) (kt) Tonnes (Mt) Upper Beaver²⁹ (2% NSR) (Copper) Agnico Eagle Mines Limited Aldebaran Resources Inc. AntaKori⁴ (Effective ≈1% NSR; variable coverage) (Copper) Regulus Resources Inc. Arctic⁵ (1% NSR) (Copper) Trilogy Metals Inc. / South32 Limited Arctic⁵ (1% NSR) (Zinc) Trilogy Metals Inc. / South32 Limited Arctic⁵ (1% NSR) (Lead) Trilogy Metals Inc. / South32 Limited Cascabel⁹ (0.6% NSR) (Copper) Effective as of 2024-11-25 Whistler³³ (2.75% NSR) (Copper) - - White Pine North⁴¹ (1.5% Cu NSR) (Copper) - - - - - 781 0.43 3,340 1,620 0.41 6,650 9,980 1,220 0.37 4,460 Tandayama-Ameríca Casino¹⁰ (2.75% NSR) (Copper) - - - - - - - - - - 250 0.48 1,180 1,180 267 0.41 1,090 - 46.7 2.11 985 985 - - - - - - - 4.5 1.92 85.7 Casino¹⁰ (2.75% NSR) (Molybdenum) - - Cerro del Gallo¹¹ (3% NSR on ≈ 25% of Resource) (Copper) Heliostar Metals Ltd. Copperwood³⁶ (1.5% Cu NSR) (Copper) Highland Copper Company Inc. Costa Fuego¹² (1% Cu NSR) (Copper) Hot Chili Limited Hermosa (Taylor)³⁷ (1% NSR) (Lead) South32 Limited Hermosa (Taylor)³⁷ (1% NSR) (Zinc) South32 Limited Liontown²⁰ (0.8% NSR) (Copper) Sunshine Metals Ltd Liontown²⁰ (0.8% NSR) (Zinc) Sunshine Metals Ltd Liontown²⁰ (0.8% NSR) (Lead) Sunshine Metals Ltd Marimaca (MOD)⁴² (1% NSR) (Copper) Marimaca Copper Corp. - - - - - - 2.9 1.50 43.4 43.4 2.6 1.42 - - - - - - 0.26 0.69 1.8 1.8 0.47 0.66 3.1 - 23.2 0.24 54.9 54.9 - - - 7.6 0.16 12.1 12.1 3.0 0.36 10.6 - - - - - - - - 299 0.15 450 450 291 0.061 177 - - - - - - - - 151 1.05 1,590 1,590 96.4 1.03 990 - Effective as of 2026-03-02 - - Effective as of 2023-06-12 Kinterra Copper USA LLC - - - 46.7 2.90 1,350 1,350 - - - - - - - 4.5 2.93 131 - - 46.7 0.56 262 262 - - - - - - - 4.5 0.70 31.3 5. Trilogy Metals Form 10-K for the fiscal year ended November 30, 2025 (dated 2026-02-17) (https://www.sedarplus.ca/csa-party/records/document.html?id=78de339bfc98769ccdf6aa90a7c80dca2ad9a9065f984b4885862498b41f012a) - 6. Galiano Gold Inc. press release (dated 2026-02-12) (https://www.sedarplus.ca/csa-party/records/document.html?id=2fe34202e20bd6c32dfc59c0dc6b847cad382d3e03ab4e974b38cded885cffef) 7. SK1300 Technical Report Summary on the Back Forty Mine Project, Michigan, USA (dated 2023-10-27) (https://goldresourcecorp.com/site/assets/files/6493/sk1300_b40_gold_resource_corp_filed_10_27_2023.pdf) Effective as of 2025-11-30 - 3. Agnico Eagle Mines Limited press release (dated 2026-02-12) (https://www.sedarplus.ca/csa-party/records/document.html?id=3473b27192d28265be76c94e020d7cdb9431be0bababac457e7f89dc04f5257e) 4. Regulus Resources press release (dated 2019-03-01) (https://www.globenewswire.com/en/news-release/2019/03/01/1745593/0/en/Regulus-Reports-Substantial-Increase-in-Resource-Estimate-at-Antakori-Copper-Gold-Project-Peru.html) Effective as of 2025-11-30 - References for Mineral Reserves & Mineral Resources: 2. Feasibility Study Technical Report - Amulsar Project, Armenia (dated 2019-10-16) (https://www.sedarplus.ca/csa-party/records/document.html?id=e75cec6229d26ded734f082d9083c6c5b4446a27204c60afcea42bbba966921e) 8. Osisko Development press release (dated 2025-04-28) (https://www.sedarplus.ca/csa-party/records/document.html?id=ddbc50abe60bbf1272c28526b578fa8ad5234555b235a16f0f87ea33d1050250) 9. SolGold press release (dated 2024-02-16) (https://polaris.brighterir.com/public/solgold/news/rns/story/xze09lx/export) 10. Casino Project - Form 43-101F1 Technical Report Feasibility Study, Yukon, Canada (dated 2022-08-08) (https://www.sedarplus.ca/csa-party/records/document.html?id=dac887fdd1f41e929f675d59ec0993a84f1ca98257fc936e1dc9462f14429dbb) Effective as of 2023-12-31. Resources adjusted to be exclusive of Reserves. 11. NI 43-101 Technical Report Pre-Feasibility Study of Cerro del Gallo Project, Guanajuato, Mexico (dated 2026-01-23) (https://www.sedarplus.ca/csa-party/records/document.html?id=e6b89656d856c37b8e682b8945239f20d590f4d0cebaf8eaec54f108b1f4b113) 12. Hot Chili ASX announcement (dated 2025-03-26) (https://cdn-api.markitdigital.com/apiman-gateway/ASX/asx-research/1.0/file/2924-02929293-6A1257464&v=7bc42bd11d853ed5e8c28f2ffcd6a069ee5cd6b4) 458 0.63 2,900 82.2 0.36 300 3,200 1,120 0.34 3,800 1,350 0.27 3,700 7,500 607 0.25 1,500 - - - - - - - - - - 722 0.24 1,700 1,700 246 0.20 500 13. Cabral Gold annual information form for the nine months ended September 30, 2025 (dated 2026-01-07) (https://www.sedarplus.ca/csa-party/records/document.html?id=0b4079caef8f260e52c428c58517010617a34c5b39407faa3cdef6f15d789c8b). 14. Victoria Gold Corp. MD&A for the year ended December 31, 2023 (dated 2024-02-20) (https://www.sedarplus.ca/csa-party/records/document.html?id=5fd5f7e14d1c4ef254b4990e3c5574d1af895f65d712222c35832df6655aa259) 15. Spartan Resources ASX announcement (dated 2020-12-18) (https://announcements.asx.com.au/asxpdf/20201218/pdf/44r2zzcx29zn9x.pdf) 16. Fiore Gold Ltd. Annual information form for the year ended September 30, 2020 (effective as of 2020-12-16) (https://www.sedarplus.ca/csa-party/records/document.html?id=8dfc00140cf494ce5112f0fa723ab206efa9cbc8c1e8f8012963935284f6bb74) Effective as of 2022-04-29. Resource adjusted to be exclusive of Reserves. 17. G Mining Ventures press release (dated 2025-03-12) (https://www.sedarplus.ca/csa-party/records/document.html?id=41f5c7303133e03c775ce314f9ab2318269129ae73510919bf8fe0d384bfea8d) 18. Agnico Eagle Mines Limited press release (dated 2026-02-12) (https://www.sedarplus.ca/csa-party/records/document.html?id=3473b27192d28265be76c94e020d7cdb9431be0bababac457e7f89dc04f5257e) 140 0.31 428 1,080 0.17 1,880 2,300 - - - 1,040 0.10 1,070 1,070 1,370 0.10 1,370 Effective as of 2022-04-29. Resource adjusted to be exclusive of Reserves. 19. Roscan Gold press release (dated 2026-03-02) (https://www.sedarplus.ca/csa-party/records/document.html?id=cfcf11c2993415cc721e65c75d9df917a2e5e429caf347e5d25f79b50b33a788) 20. Sunshine Metals ASX announcement (dated 2026-02-16) (https://cdn-api.markitdigital.com/apiman-gateway/ASX/asx-research/1.0/file/2924-03056666-6A1312110&v=undefined) 21. Agnico Eagle Mines Limited press release (dated 2026-02-12) (https://www.sedarplus.ca/csa-party/records/document.html?id=3473b27192d28265be76c94e020d7cdb9431be0bababac457e7f89dc04f5257e) 22. Spartan Resources ASX announcement (dated 2021-05-31) (https://announcements.asx.com.au/asxpdf/20210531/pdf/44wyvh4bmbbbj0.pdf) Western Copper and Gold Corporation Mill Material - 1. Aldebaran Resources press release (dated 2024-11-25) (https://www.sedarplus.ca/csa-party/records/document.html?id=f4aa397d01b3d6c1fa880bca97e5afbab971aa63803f3e5d423e3e5d0a957903) Effective as of 2025-11-30 Western Copper and Gold Corporation Mill Material - Effective as of 2019-02-22 Jiangxi Copper Company Limited Alpala - - U.S. GoldMining Inc. Altar¹ (1% NSR) (Copper) - Effective as of 2025-12-31 23. Torque Metals ASX announcement (dated 2024-09-17) (https://cdn-api.markitdigital.com/apiman-gateway/ASX/asx-research/1.0/file/2924-02853926-6A1225841&v=undefined) 140 0.024 34.0 1,080 0.021 225 259 - - - 1,040 0.0096 99.3 99.3 1,370 0.0095 130 94.7 - - - 148 0.10 149 149 24.4 0.089 21.7 - - - 91.9 0.10 94.7 194 18.7 1.39 259 453 79.1 1.09 860 - 296 0.36 1,050 1,050 203 0.25 516 - 59.0 3.06 1,800 1,800 28.0 2.97 832 26. Westhaven Gold press release (dated 2025-03-03) (https://www.sedarplus.ca/csa-party/records/document.html?id=264cf99fe2725d9b1d424a22041b91f935cc202212672588525fde820364ea47) 1.49 271 7.5 1.34 101 371 9.8 1.98 29. Agnico Eagle Mines Limited press release (dated 2026-02-12) (https://www.sedarplus.ca/csa-party/records/document.html?id=3473b27192d28265be76c94e020d7cdb9431be0bababac457e7f89dc04f5257e) - - 502 0.37 1,860 1,860 - - 32. OceanaGold press release (dated 2026-02-18) (https://www.sedarplus.ca/csa-party/records/document.html?id=b5a23bacc23edb52a7c2b2521df15b386b3477b1a44edb344ff500463a05352a) - - 65.0 4.90 3,190 3,190 - - 35. Ramelius Resources ASX announcement (dated 2025-09-30) (https://cdn-api.markitdigital.com/apiman-gateway/ASX/asx-research/1.0/file/2924-03001538-6A1287514&v=undefined) - 38. Falco Resources MD&A for the three-month and six-month periods ended December 31, 2024 (dated 2025-02-19) (https://www.sedarplus.ca/csa-party/records/document.html?id=698bd6ff00b89bcc8c666aa4874184735f95b83e15d161b2a8df3bbaa7bcacc9) - 65.0 4.35 2,830 2,830 - - - 59.0 2.90 1,710 1,710 28.0 2.96 829 - - - - - - - - 2.4 0.62 15.0 15.0 3.9 0.86 33.5 - - - - - - - - - 2.4 4.42 107 107 3.9 4.19 162 - - - - - - - - 2.4 1.81 44.1 44.1 3.9 1.38 53.7 748 9.1 0.36 32.6 25.8 0.29 73.6 106 21.2 0.29 62.2 41. Highland Copper press release (dated 2023-07-24) (https://www.sedarplus.ca/csa-party/records/document.html?id=eaa0548f008533a12e743d5fe461fc63e0e27349e5de4912c12e288efe1d2b8e) - 44. Patriot Battery Metals press release (dated 2025-11-14) (https://www.sedarplus.ca/csa-party/records/document.html?id=b944fb9b7b9517d520fe3eddc3098098f386e154c39fba4b5530fda03de2bc2a) Effective as of 2025-11-26 - - 0.46 45. South Crofty Tin Project - Mineral Resource Update NI 43-101 Technical Report (dated 2023-10-27) (https://www.sedarplus.ca/csa-party/records/document.html?id=7cdfa152972885ba34047670027c0f305494fd3ab4355dab98fd77c3dcf207d7) Notes on Mineral Reserves & Mineral Resources: Effective as of 2025-08-25. Resources adjusted to be exclusive of Reserves. 94.3 42. Marimaca Copper press release (released 2025-08-25) (https://www.sedarplus.ca/csa-party/records/document.html?id=06e4ae34db8710155f0f97628c18551d506d005088916acf1b651731cd0a61c0) 43. Osisko Metals press release (dated 2024-06-25) (https://www.sedarplus.ca/csa-party/records/document.html?id=c4468840b67cd948d0bd1c8ddbb16cb898dd5cc627b62370e48cc90e5603ba90) Effective as of 2025-11-26 - 39. Technical Report and Updated Mineral Resource Estimate of the Murray Brook Zn-Pb-Cu-Ag Project, New Brunswick, Canada (dated 2023-11-16) (https://www.sedarplus.ca/csa-party/records/document.html?id=d7bbe27f7240d44ce55090a2f0fead9dae27124f506bfd5ba0dac67a8fab9e5e) 40. Orla Mining Ltd. press release (dated 2026-01-15) (https://www.sedarplus.ca/csa-party/records/document.html?id=82e7d65651cf07c99e6e939ac0d73d40122f69997826d1cbd747a127a6d6537e) Effective as of 2025-11-26 - 36. Highland Copper press release (dated 2023-03-06) (https://www.sedarplus.ca/csa-party/records/document.html?id=092f4ed573d996c7343c4b177a1843d427f20674960dd0c739631c22dcaf013a) 37. South32 Limited ASX announcement (dated 2024-02-15) (https://announcements.asx.com.au/asxpdf/20240215/pdf/060f0t1gws0n7d.pdf) Effective as of 2023-06-30 for Resources and 2024-01-01 for Reserves. Resources adjusted to be exclusive of Reserves. - 33. U.S. GoldMining press release (dated 2026-03-02) (https://www.sec.gov/Archives/edgar/data/1947244/000149315226008440/ex23-1.htm) 34. Osisko Mining press release (dated 2022-11-28) (https://www.sedarplus.ca/csa-party/records/document.html?id=10c67965bb7a0b96f80489b1de46cfcedad69b274bd4eb5b8b55596400339b85) Effective as of 2023-06-30 for Resources and 2024-01-01 for Reserves. Resources adjusted to be exclusive of Reserves. - 30. Agnico Eagle Mines Limited press release (dated 2026-02-12) (https://www.sedarplus.ca/csa-party/records/document.html?id=3473b27192d28265be76c94e020d7cdb9431be0bababac457e7f89dc04f5257e) 31. Shanta Gold press release (dated 2024-04-03) (https://shantagold.com/_resources/Group%20Reserves%20&%20Resources%20Statement.pdf) Effective as of 2024-02-26 for Resources and 2025-03-27 for Reserves. Resources adjusted to be exclusive of Reserves. - 27. Solidus Resources website (dated 2026-02-13) (https://solidus-resources.com/spring-valley-project/technical-report/) 28. NI 43-101 Technical Report, Mineral Resource Estimate for the Trixie Deposit, Tintic Project, Utah, United States of America (dated 2024-04-25) (https://www.sedarplus.ca/csa-party/records/document.html?id=3d1f726c26752961f6fbe641cc93e9c214cf5268cfed8a09d86900f2ab925451) Effective as of 2022-02-28 for Resources and 2022-05-22 for Reserves. Resources adjusted to be exclusive of Reserves. 18.2 24. NI 43-101 Technical Report for the 2022 Mineral Resource Estimate on the San Antonio Project, Sonora, Mexico (filed 2022-07-12) (https://www.sedarplus.ca/csa-party/records/document.html?id=ca919644b4692aa2bbd9e625edb8054aeaed938045428a7516a79aec2df1c724) 25. GoldMining annual information form for the year ended November 30, 2025 (dated 2026-02-27) (https://www.sedarplus.ca/csa-party/records/document.html?id=00c5736251ebb4b6024378be93ec1cb7cea087d21ebd2f71729027e62278f508) Effective as of 2025-07-31. Resource adjusted to be exclusive of Reserves. 433 84.3 0.37 314 * These values are estimates based on best available information as of April 10, 2026. The reader is advised to follow the provided links to find the source and descriptions of the original estimates and the risks associated with the individual projects. OR Royalties can not verify and does not take responsibility of the accuracy of the estimates provided here. * Resources are exclusive of reserves in all cases. * Inferred Resources have not demonstrated economic viability, and there is no certainty that they can be upgrade to reserves. * Data is reported to significant figures that reflect appropriate precision and may not sum precisely due to rounding * Stated Reserves and Resources do not reflect OR Royalties' estimated attributable coverage (i) Mineral Resource and Mineral Reserve figures are only estimates. Such estimates are expressions of judgment based on knowledge, mining experience, analysis of drilling results and industry practices. While OR Royalties believes that the Mineral Resource and Mineral Reserves estimates, as applicable, in respect of properties in which OR Royalties holds royalties, streams or other interests reflect best estimates performed by or on behalf of the owner of such properties, the estimating of Mineral Resource and Mineral Reserves is a subjective process and the accuracy of Mineral Resource and Mineral Reserve estimates is a function of the quantity and quality of available data, the accuracy of statistical computations, and the assumptions used and judgments made in interpreting available engineering and geological information. There is significant uncertainty in any Mineral Resource and Mineral Reserve estimate and the actual deposits encountered and the economic viability of a deposit may differ materially from estimates. Estimated Mineral Resource and Mineral Reserves may have to be re-estimated based on changes in prices of gold or other minerals, further exploration or development activity or actual production experience. This could materially and adversely affect estimates of the volume or grade of mineralization, estimated recovery rates or other important factors that influence such estimates. In addition, there is no assurance that any Mineral Resource estimate will ultimately be reclassified as proven or probable Mineral Reserves. Mineral Resources which are not Mineral Reserves do not have demonstrated economic viability. If operators reduce their Mineral Reserves and Mineral Resources on properties underlying OR Royalties’ royalties, streams or other interests, this may result in a material and adverse effect on OR Royalties’ profitability, results of operations, financial condition and the trading price of OR Royalties’ securities. The Mineral Resources disclosed in this Presentation are based on best available information as of April 10, 2026. Resources are exclusive of reserves in all cases. Gold equivalent ounces comprise mostly gold, other elements are converted assuming forecast long-term prices from analyst consensus published on March 3, 2026. Attributable GEOs were compiled without consideration for the potential mining or metallurgical recovery of the metals contained in the Mineral Resource or Reserve. Detailed Resource and Reserve estimation and applicable royalty or stream interests can be found at www.orroyalties.com. 27
  25. 2026 MINERAL RESERVES AND RESOURCES: EXPLORATION ASSETS(i) EXPLORATION ASSETS BASE

    METALS MINERAL RESERVES AND MINERAL RESOURCES Proven Reserves OR ROYALTIES INC. Property, Operator As of April 10, 2026 with best available public information. Resources are exclusive of Reserves. & Royalty or Stream GOLD Proven Reserves Property, Operator & Royalty or Stream Bachelor (Hewfran)¹ (2% NSR on ≈ 15% of Bachelor Resource) Bonterra Resources Inc. Bonnefond² (2.5% NSR) Eldorado Gold Corporation Cameron Lake³ (1% NSR) Seva Mining Corp. Cassiar North (Taurus)⁴ (2.5% NSR on ≈ 40% of Resource) Cassiar Gold Corp. Coulon⁵ (3% NSR) Electric Elements Mining Corp. Eastmain⁶ (1.15% NSR; capped) Benz Mining Corp. Greater Shasta-Newberry (Shasta)⁷ (1% NSR) TDG Gold Corp. Lorraine⁸ (2% NSR) NorthWest Copper Corp. Tonnes (Mt) Average Probable Reserves Gold Gold Grade Contained (g/t) (koz) Tonnes (Mt) Average P&P Gold Gold Gold Grade Contained Contained (g/t) (koz) (koz) Measured Resources Tonnes (Mt) Average Indicated Resources Gold Gold Grade Contained (g/t) (koz) Tonnes (Mt) Average M&I Gold Gold Gold Grade Contained Contained (g/t) (koz) (koz) Inferred Resources Tonnes (Mt) Average Coulon⁵ (3% NSR) (Copper) Gold Gold Grade Contained (g/t) (koz) Effective as of 2026-02-18 - - - - - - - 0.68 3.99 86.9 0.23 3.53 25.9 113 0.20 4.45 28.2 - - - - - - - - 0.51 4.48 74.0 74.0 2.7 4.87 423 Effective as of 2017-01-17 - - - - - - - 3.4 2.75 297 2.2 2.39 167 464 6.5 2.54 533 - - - - - - - - 8.8 1.45 410 410 63.2 0.95 1,930 Brunswick Exploration Inc. - - - - - - - - 3.7 0.25 29.5 29.5 10.1 0.18 58.2 Marble Mountain Ventures LLC Effective as of 2009-04-03 - Oracle Ridge¹¹ (3% NSR) (Copper) Effective as of 2024-02-07. - Silver Swan and Golden Swan¹⁹ (0.76% NSR) (Nickel) - - - - - - - - 1.3 9.0 380 380 3.8 5.1 620 - - - - - - - - 12.6 0.99 401 401 15.4 0.77 382 - - - - - - - - 13.0 0.16 68.0 68.0 45.5 0.099 145 - - - - - - - - 74.2 0.50 1,190 1,190 49.7 0.34 548 - - - - - - - - 10.7 3.28 1,130 1,130 7.3 2.70 600 - - - - - 3.1 0.18 18.0 12.2 0.18 71.0 89.0 13.0 0.13 53.0 - - - - - - - - - - - - 20.0 1.67 1,070 - - - - - - - - 18.6 0.73 433 433 3.2 0.58 60.8 - 29.2 0.88 825 825 - - - - - - - 0.37 0.47 5.6 Effective as of 2024-12-29 - Horizon Minerals Ltd. West Desert¹⁶ (1.5% NSR) (Copper) - Effective as of 2022-06-22 - NorthWest Copper Corp. Mirage¹⁸ (3% NSR on ≈ 50% of Resource) (Lithium) - - Electric Elements Mining Corp. NioBay Metals Inc. Lorraine⁸ (2% NSR) (Copper) Effective as of 2022-09-15 - Electric Elements Mining Corp. James Bay Niobium¹⁷ (1% NSR) (Niobium) - - Coulon⁵ (3% NSR) (Lead) Coulon⁵ (3% NSR) (Zinc) Effective as of 2025-09-31 - Electric Elements Mining Corp. - American West Metals Limited West Desert¹⁶ (1.5% NSR) (Zinc) American West Metals Limited Tonnes (Mt) Average Metal Grade Contained (%) (kt) Probable Reserves P&P Average Metal Tonnes (Mt) Grade Metal Contained Contained (%) (kt) (kt) Measured Resources Tonnes (Mt) Average Metal Grade Contained (%) (kt) Indicated Resources M&I Average Metal Tonnes (Mt) Grade Metal Contained Contained (%) (kt) (kt) Inferred Resources Tonnes Average Metal Grade Contained (%) (kt) (Mt) Effective as of 2009-04-03 - - - - - - - - - - 3.7 1.27 46.7 46.7 10.1 1.33 134 - - - - - - - - 3.7 0.40 14.7 14.7 10.1 0.19 19.1 Effective as of 2009-04-03 - - Effective as of 2009-04-03 - - - - - - 3.7 3.61 133 133 10.1 3.92 394 - - - - - - - - 29.7 0.53 158 158 33.8 0.52 177 - - - - - - - - Effective as of 2020-07-09. Grade and metal contained expressed as Nb₂O₅ - - Effective as of 2022-06-22 - - - - - - 13.0 0.55 70.8 70.8 45.5 0.43 194 - - - - - - - - - - - - 52.2 1.08 563 - - - - - 3.1 1.40 43.0 12.2 1.36 166 209 13.0 1.32 171 - - - - - 0.68 0.92 6.2 0.25 7.1 17.7 23.9 0.06 2.75 1.5 - - - - - - - - 27.3 0.14 40.6 40.6 6.3 0.13 8.5 - - - - - - - - 27.3 3.79 1,040 1,040 6.3 4.01 254 Effective as of 2026-01-07. Grades and metal contained are expressed as Li₂O. - - Effective as of 2023-11-21 - - Effective as of 2025-03-31. - - Effective as of 2023-02-01 - - Effective as of 2023-02-01 - - Nutmeg Mountain (formerly Almaden)⁹ (0.5% NSR and 30% Au Offta Effective as of 2025-08-29 NevGold Corp. Ollachea¹⁰ (1% NSR) Minera IRL Limited Oracle Ridge¹¹ (3% NSR) Marble Mountain Ventures LLC Raven¹² (3-5% NSR) PricewaterhouseCoopers Inc., LIT (receiver) Sandman¹³ (5% NSR on ≈ 20% of Resource) Borealis Mining Company Ltd. Yenipazar¹⁴ (50% Au Offtake) Aldridge Mineral Mining Inc. - - - - 2. Eldorado Gold press release (dated 2025-11-26) (https://www.sedarplus.ca/csa-party/records/document.html?id=cd2ff848baaf4c2ea67dd7ae0f5480ecce725058034d59373522bc250cb2199b) Effective as of 2023-11-21 - - Effective as of 2021-01-20 7. NI 43-101 2025 Updated Resource Estimate for the Shasta Deposit (dated 2025-02-01) (https://www.sedarplus.ca/csa-party/records/document.html?id=6a4617546afd865af1eb5068ed7d5011dd93bc9e359daeba774e821a5188be95) 8. NorthWest Copper press release (dated 2022-07-27) (https://www.sedarplus.ca/csa-party/records/document.html?id=ef748da58f229819ce29c5821012a4cbbbabb14c89af399d7ae5517ab50c32e8) 9. NevGold press release (dated 2025-09-18) (https://www.sedarplus.ca/csa-party/records/document.html?id=ffd0cd19f8e7c042ecdf3984aef4d20c383f3d075357b04afc7adc35ffcc79db) - 10. Minera IRL press release (dated 2021-07-19) (https://www.sedarplus.ca/csa-party/records/document.html?id=899d30e21282218f353e3c18d833aaadcf6752f68c9c02e1bea1a58f182c9f7f) 11. Eagle Mountain Mining ASX announcement (dated 2023-11-21) (https://announcements.asx.com.au/asxpdf/20231121/pdf/05xknj9xr61x4k.pdf) Effective as of 2012-11-26 - 5. Technical Report and Resource Estimate on the Coulon Property, James Bay Area, Middle North Quebec (dated 2009-05-28) (https://www.sedarplus.ca/csa-party/records/document.html?id=7c0861e7d850a72b3e53f9cc46df5978834182e0ee8ae21fc102f394c501abb9) 6. Technical Report and Updated Mineral Resource Estimate of the Eastmain Gold Mine Property, James Bay District, Quebec (dated 2023-07-07) (https://www.sedarplus.ca/csa-party/records/document.html?id=746fcaef6d15cc628596505f0a9514334c036d92fb5efba382d6e2b3ad7b7a41) Effective as of 2022-09-15 - 3. First Mining Gold press release (dated 2017-03-22) (https://www.sedarplus.ca/csa-party/records/document.html?id=f0a7d000ea58d8b8e9dfd485ae1827ec8a9d158cca8a26c180b7d926d98fa3e3) 4. NI 43-101 Technical Report on the Cassiar Gold Property (dated 2025-06-08) (https://www.sedarplus.ca/csa-party/records/document.html?id=a3acceb34a87f4be0ba47594a864e288c1ed055b7c086cfae584e4c1f58f5ce7) - - References for Mineral Reserves & Mineral Resources: 1. Bonterra Resources press release (dated 2026-04-01) (https://www.sedarplus.ca/csa-party/records/document.html?id=3d8d1a339e2ca216734e0a7d386b4ce61e4e5282d0e136b992ce1c26b3d6fb7b) Effective as of 2021-06-30 - 12. Victoria Gold Corp press release (dated 2022-09-15) (https://www.sedarplus.ca/csa-party/records/document.html?id=53a8ddce06014eef828d65238622c4125beed5089c82978ad134439893210e01) 13. Mineral Resource Estimate and NI43-101 Technical Report - Sandman Gold Property, Nevada, USA (dated 2021-01-20) (https://www.sedarplus.ca/csa-party/records/document.html?id=52d9d9b187c7ce906152920dc4c26b4767bf1d29f2787b68d17dc95eb2db8712) 14. NI 43-101 Technical Report on the Yenipazar Optimization Study, Yozgat Province, Turkey (effective date of 2014-04-15) (https://www.sedarplus.ca/csa-party/records/document.html?id=5064cb73e1a15be38526d1098ddbc4b22213ab3d720685245047dcfcb48d5a6a) 15. Horizon Minerals ASX announcement (dated 2025-04-29) (https://cdn-api.markitdigital.com/apiman-gateway/ASX/asx-research/1.0/file/2924-02940118-6A1261807&v=undefined) 16. American West Metals ASX announcement (dated 2023-02-09) (https://announcements.asx.com.au/asxpdf/20231213/pdf/05yhrjghhnhlr0.pdf) SILVER Property, Operator & Royalty or Stream Proven Reserves Probable Reserves Average Average Tonnes Silver (Mt) Grade Silver Contained (g/t) Coulon⁵ (3% NSR) Electric Elements Mining Corp. Greater Shasta-Newberry (Shasta)⁷ (1% NSR) TDG Gold Corp. Nimbus¹⁵ (100% Ag Offtake) Horizon Minerals Limited Oracle Ridge¹¹ (3% NSR) Marble Mountain Ventures LLC West Desert¹⁶ (1.5% NSR) American West Metals Limited (Moz) Tonnes Silver (Mt) Grade (g/t) 17. Technical Report on the James Bay Niobium Project, Cochrane District, Northeastern Ontario, Canada (dated 2020-08-23) (https://www.sedarplus.ca/csa-party/records/document.html?id=cdd11bc4049e0aeabb0afe4d060523d03a15f0dd1527ba0cc1c596a75b1b1176) P&P Silver Silver Contained Contained (Moz) (Moz) Measured Resources Indicated Resources Average Average Tonnes Silver (Mt) Grade (g/t) Silver Contained (Moz) Tonnes Silver (Mt) Grade (g/t) Silver M&I Silver Contained Contained (Moz) (Moz) Inferred Resources Average Tonnes Silver (Mt) Grade (g/t) 18. NI 43-101 Technical Report on the Mirage Project (dated 2026-02-26) (https://www.sedarplus.ca/csa-party/records/document.html?id=06c492523791ec9bdf31187b30c29a32e4143819756404d53178462f0de20c4e) Silver Contained (Moz) - * Resources are exclusive of reserves in all cases. - - - - - - - - 3.7 37 4.4 4.4 10.1 35 11.2 - - - - - - - - 12.6 35 14.2 14.2 15.4 29 14.2 - - - - - - 3.6 102 11.9 3.2 47 4.9 16.7 5.3 21 3.5 - - - - - 3.1 13.9 1.4 12.2 12.0 4.7 6.1 13.0 9.5 4.0 - - - - - - - - 27.3 9.5 8.4 8.4 6.3 7.1 1.4 * Inferred Resources have not demonstrated economic viability, and there is no certainty that they can be upgrade to reserves. * Data is reported to significant figures that reflect appropriate precision and may not sum precisely due to rounding Effective as of 2024-12-29 - Notes on Mineral Reserves & Mineral Resources: * These values are estimates based on best available information as of April 10, 2026. The reader is advised to follow the provided links to find the source and descriptions of the original estimates and the risks associated with the individual projects. OR Royalties can not verify and does not take responsibility of the accuracy of the estimates provided here. Effective as of 2009-04-03 - 19. Horizon Minerals ASX announcement (dated 2025-04-29) (https://cdn-api.markitdigital.com/apiman-gateway/ASX/asx-research/1.0/file/2924-02940118-6A1261807&v=undefined) * Stated Reserves and Resources do not reflect OR Royalties' estimated attributable coverage Effective as of 2025-03-31. - - Effective as of 2023-11-21 - - Effective as of 2023-02-01 - - (i) Mineral Resource and Mineral Reserve figures are only estimates. Such estimates are expressions of judgment based on knowledge, mining experience, analysis of drilling results and industry practices. While OR Royalties believes that the Mineral Resource and Mineral Reserves estimates, as applicable, in respect of properties in which OR Royalties holds royalties, streams or other interests reflect best estimates performed by or on behalf of the owner of such properties, the estimating of Mineral Resource and Mineral Reserves is a subjective process and the accuracy of Mineral Resource and Mineral Reserve estimates is a function of the quantity and quality of available data, the accuracy of statistical computations, and the assumptions used and judgments made in interpreting available engineering and geological information. There is significant uncertainty in any Mineral Resource and Mineral Reserve estimate and the actual deposits encountered and the economic viability of a deposit may differ materially from estimates. Estimated Mineral Resource and Mineral Reserves may have to be re-estimated based on changes in prices of gold or other minerals, further exploration or development activity or actual production experience. This could materially and adversely affect estimates of the volume or grade of mineralization, estimated recovery rates or other important factors that influence such estimates. In addition, there is no assurance that any Mineral Resource estimate will ultimately be reclassified as proven or probable Mineral Reserves. Mineral Resources which are not Mineral Reserves do not have demonstrated economic viability. If operators reduce their Mineral Reserves and Mineral Resources on properties underlying OR Royalties’ royalties, streams or other interests, this may result in a material and adverse effect on OR Royalties’ profitability, results of operations, financial condition and the trading price of OR Royalties’ securities. The Mineral Resources disclosed in this Presentation are based on best available information as of April 10, 2026. Resources are exclusive of reserves in all cases. Gold equivalent ounces comprise mostly gold, other elements are converted assuming forecast long-term prices from analyst consensus published on March 3, 2026. Attributable GEOs were compiled without consideration for the potential mining or metallurgical recovery of the metals contained in the Mineral Resource or Reserve. Detailed Resource and Reserve estimation and applicable royalty or stream interests can be found at www.orroyalties.com. 28