Upgrade to Pro — share decks privately, control downloads, hide ads and more …

UHM Nitrogen Footprint project

UHM Nitrogen Footprint project

Presentation to UHMSC on 215/17.

Philip Johnson

February 16, 2017
Tweet

More Decks by Philip Johnson

Other Decks in Education

Transcript

  1. University of Hawaii
    Nitrogen Footprint Project
    Team Members (so far):
    Students - Mahealani Wilson, Jillian Cristobal,
    Annika Little, Kelsey Barrow, Alexa Foster
    Faculty - Rebecca Ryals

    View Slide

  2. What is Nitrogen?
    Reactive nitrogen is all forms of nitrogen 
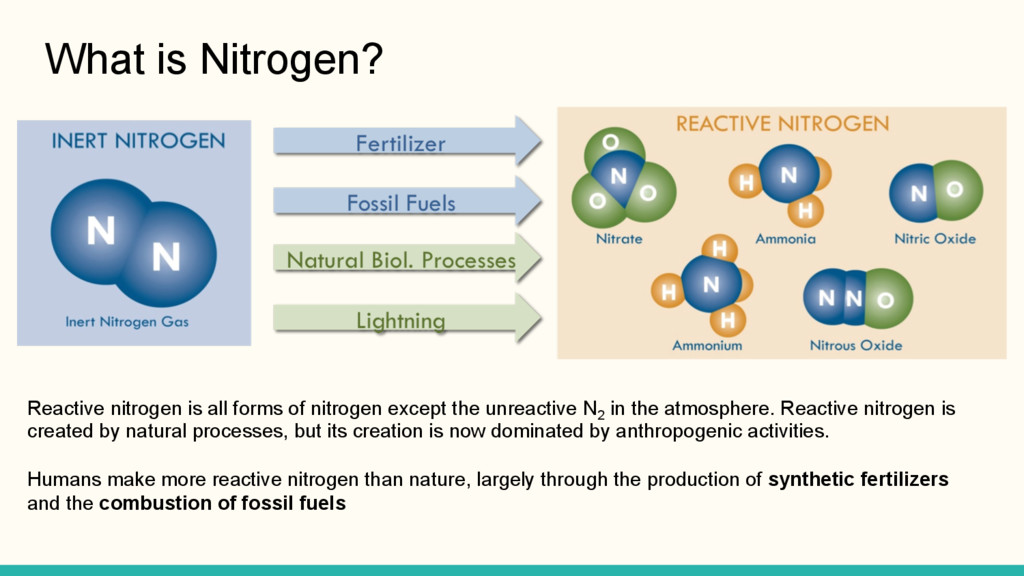
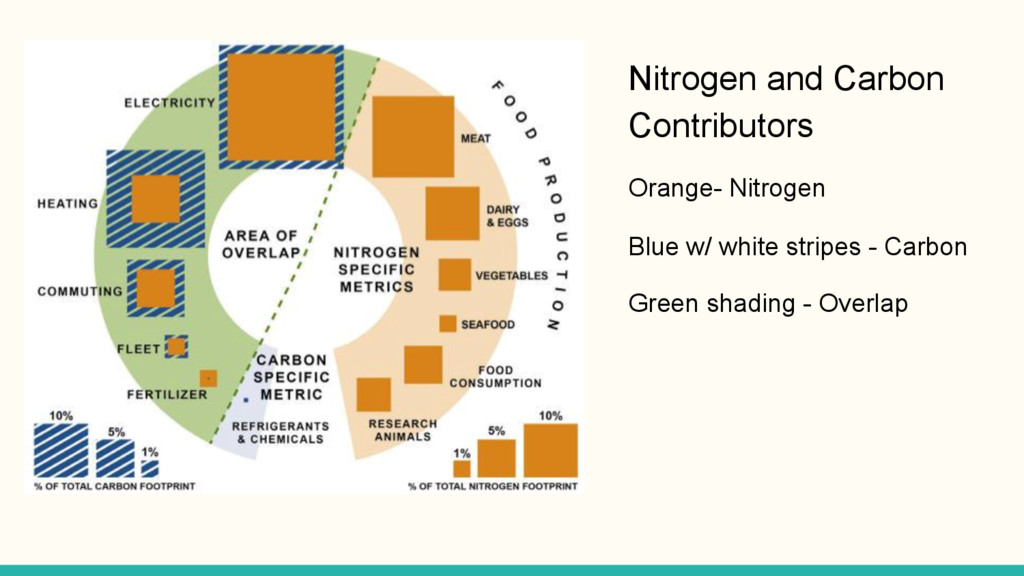
except the unreactive N2
    in the atmosphere. Reactive nitrogen is
    created by natural processes, but its creation is now dominated by anthropogenic activities.
    Humans make more reactive nitrogen than nature, largely through the production of synthetic fertilizers
    and the combustion of fossil fuels

    View Slide

  3. Reactive nitrogen has important benefits and
    many unintended consequences.

    View Slide

  4. Once in the environment, reactive nitrogen contributes to a
    cascade of negative impacts to human and ecosystem health.
    Understanding and managing sources of
    reactive nitrogen will reduce these negative impacts.

    View Slide

  5. What is a “Nitrogen Footprint?”
    ❖ How is Nitrogen Anthropogenically Produced?
    ➢  Combustion of fuels for electricity and transportation
    ➢  Cultivation of legumes w/ biological nitrogen fixation
    ➢  Production to synthetic fertilizers

    View Slide

  6. Nitrogen Footprint Project ❖ Measuring sectors of a University
    ➢  Food 
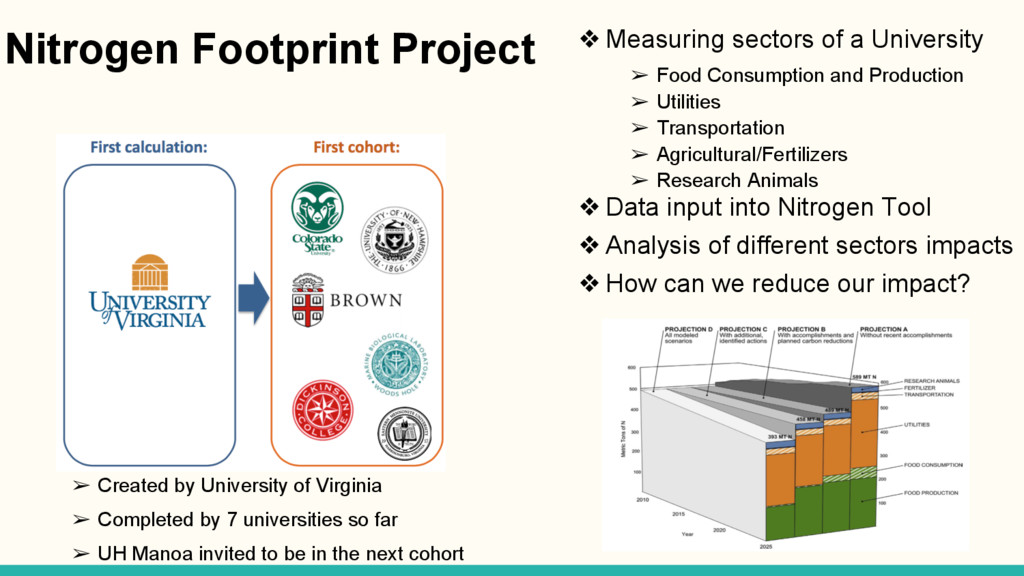
Consumption and Production
    ➢  Utilities
    ➢  Transportation
    ➢  Agricultural/Fertilizers
    ➢  Research Animals
    ❖ Data input into Nitrogen Tool
    ❖ Analysis of different sectors impacts
    ❖ How can we reduce our impact?
    ➢  Created by University of Virginia
    ➢  Completed by 7 universities so far
    ➢  UH Manoa invited to be in the next cohort

    View Slide

  7. Nitrogen and Carbon
    Contributors
    Orange- Nitrogen
    Blue w/ white stripes - Carbon
    Green shading - Overlap

    View Slide

  8. What makes the UHM N-Footprint Project unique?
    ❖ Difference from other 
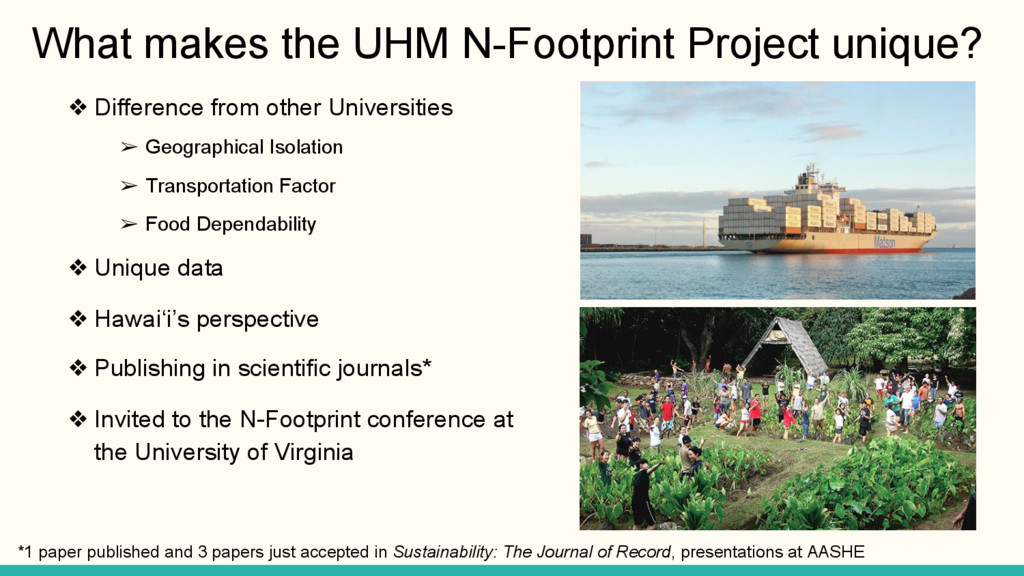
Universities
    ➢  Geographical Isolation
    ➢  Transportation Factor
    ➢  Food Dependability
    ❖ Unique data
    ❖ Hawaiʻi’s perspective
    ❖ Publishing in scientific journals*
    ❖ Invited to the N-Footprint conference at
    the University of Virginia
    *1 paper published and 3 papers just accepted in Sustainability: The Journal of Record, presentations at AASHE

    View Slide

  9. Next steps for the
    UH Nitrogen Footprint Project
    ❖ Contact officials 
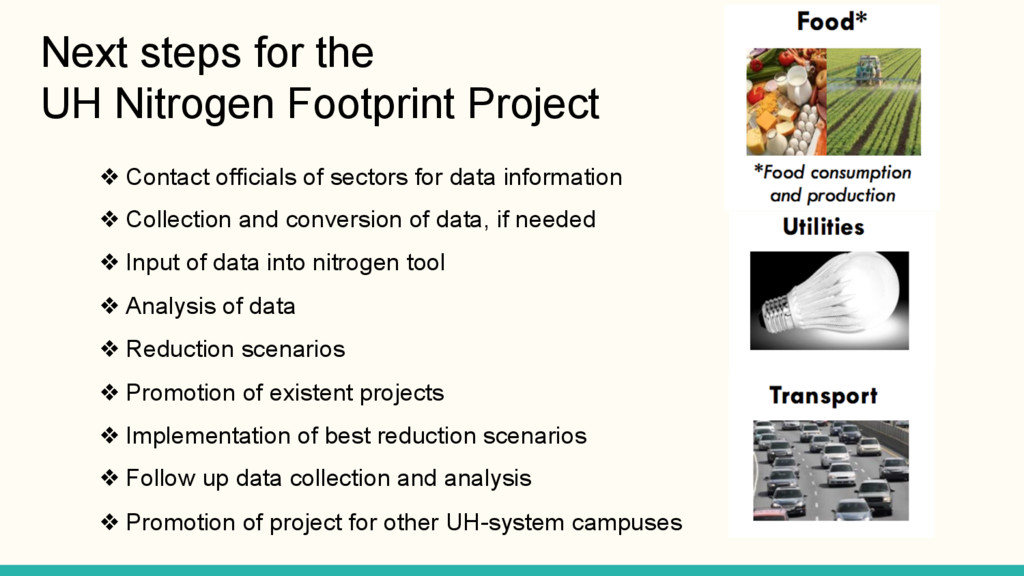
of sectors for data information
    ❖ Collection and conversion of data, if needed
    ❖ Input of data into nitrogen tool
    ❖ Analysis of data
    ❖ Reduction scenarios
    ❖ Promotion of existent projects
    ❖ Implementation of best reduction scenarios
    ❖ Follow up data collection and analysis
    ❖ Promotion of project for other UH-system campuses

    View Slide

  10. Timeline
    Data Collection
    (Now)
    Baseline N Footprint
    Assessment
    (Mid March 
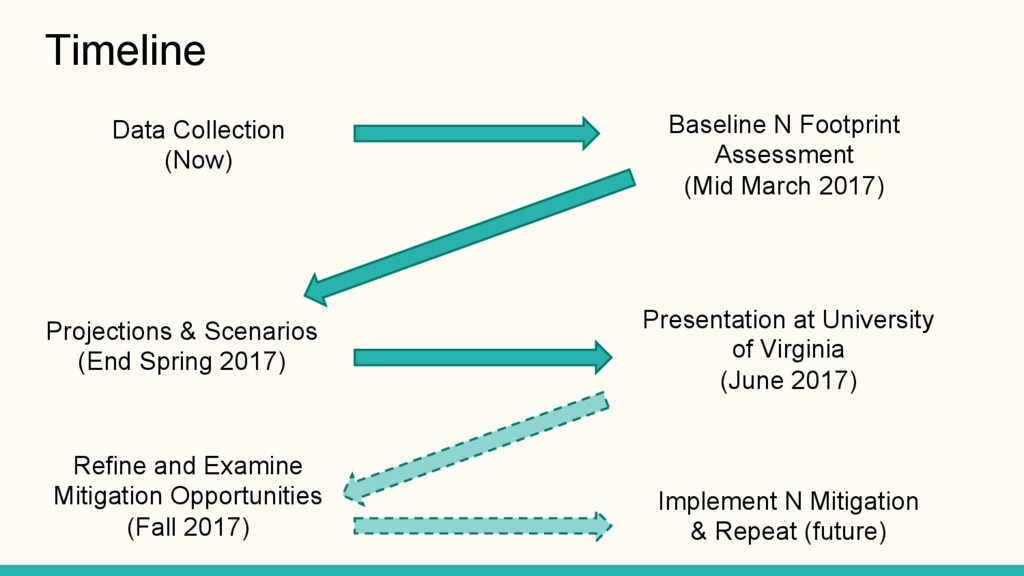
2017)
    Projections & Scenarios
    (End Spring 2017)
    Presentation at University
    of Virginia
    (June 2017)
    Refine and Examine
    Mitigation Opportunities
    (Fall 2017)
    Implement N Mitigation
    & Repeat (future)

    View Slide

  11. UH Nitrogen Footprint Project is collaborative and
    links many sustainability initiatives across campus.
    We look forward to working with you!
    Mahealani Wilson: [email protected]
    Jillian Cristobal: [email protected]
    Annika Little: [email protected]
    Kelsey Barrow: [email protected]
    Alexa Foster: [email protected]
    Dr. Rebecca Ryals: [email protected]

    View Slide