Upgrade to Pro — share decks privately, control downloads, hide ads and more …

Exploring Web Standards for Data Visualization

Exploring Web Standards for Data Visualization

Talk at Strata in Santa Clara, CA on February 2013

Nicolas Garcia Belmonte

February 27, 2013
Tweet

More Decks by Nicolas Garcia Belmonte

Other Decks in Technology

Transcript

  1. Why so many standards for Graphics? SVG CSS 2D Canvas

    WebGL HTML JavaScript Thursday, February 28, 13
  2. What is the right standard for my Visualization? SVG CSS

    2D Canvas WebGL HTML JavaScript Thursday, February 28, 13
  3. Visual Component # of Elements Shape Complexity Interactive Standard Chosen

    Tweet Histogram Choropleth Map Small (~40) Small (~50) Simple: (Rectangle) Complex: (Concave, Convex, Connected, Disconnected) Yes Yes HTML SVG Thursday, February 28, 13
  4. Mobility Flow in France Per State and County Mobility Data

    for France Thursday, February 28, 13
  5. Mobility Flow in France Per State and County Mobility Data

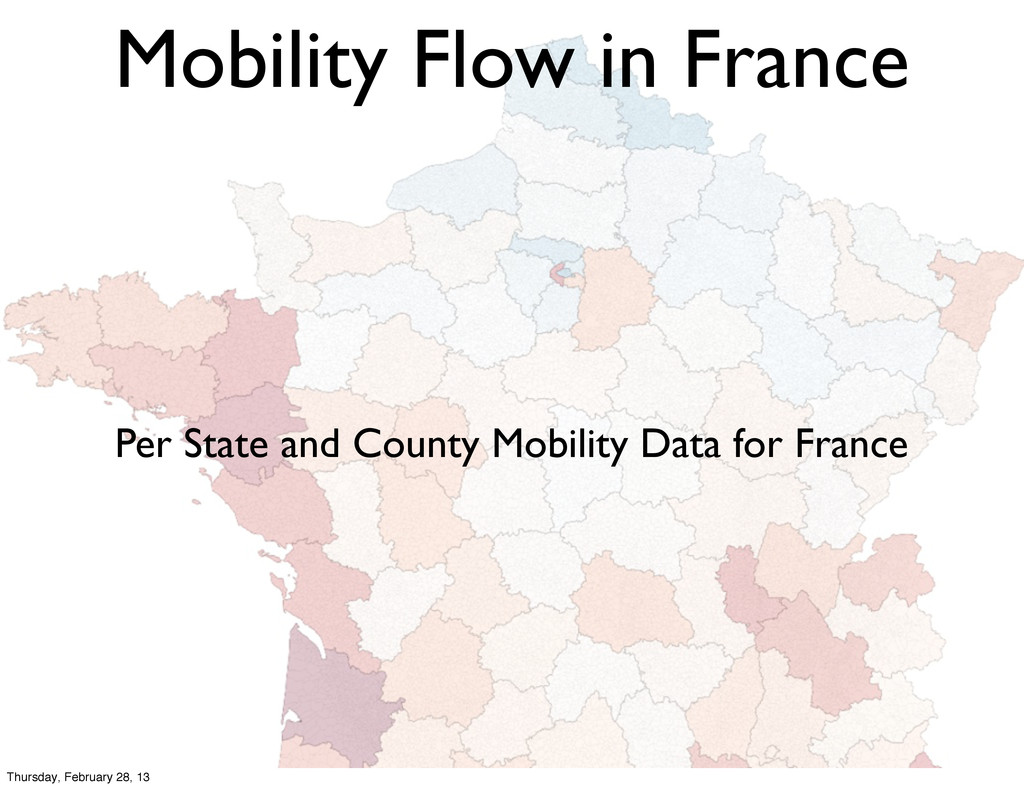
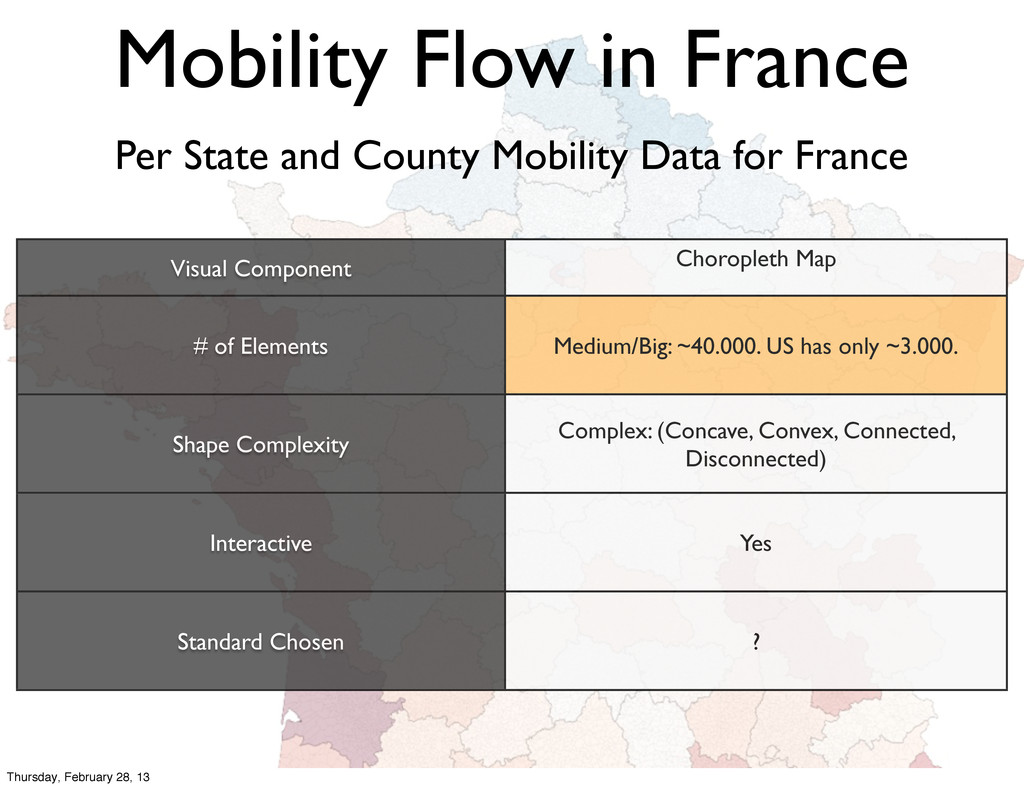
    for France Visual Component # of Elements Shape Complexity Interactive Standard Chosen Choropleth Map Medium/Big: ~40.000. US has only ~3.000. Complex: (Concave, Convex, Connected, Disconnected) Yes ? Thursday, February 28, 13
  6. Mobility Flow in France • Use Layered Images to render

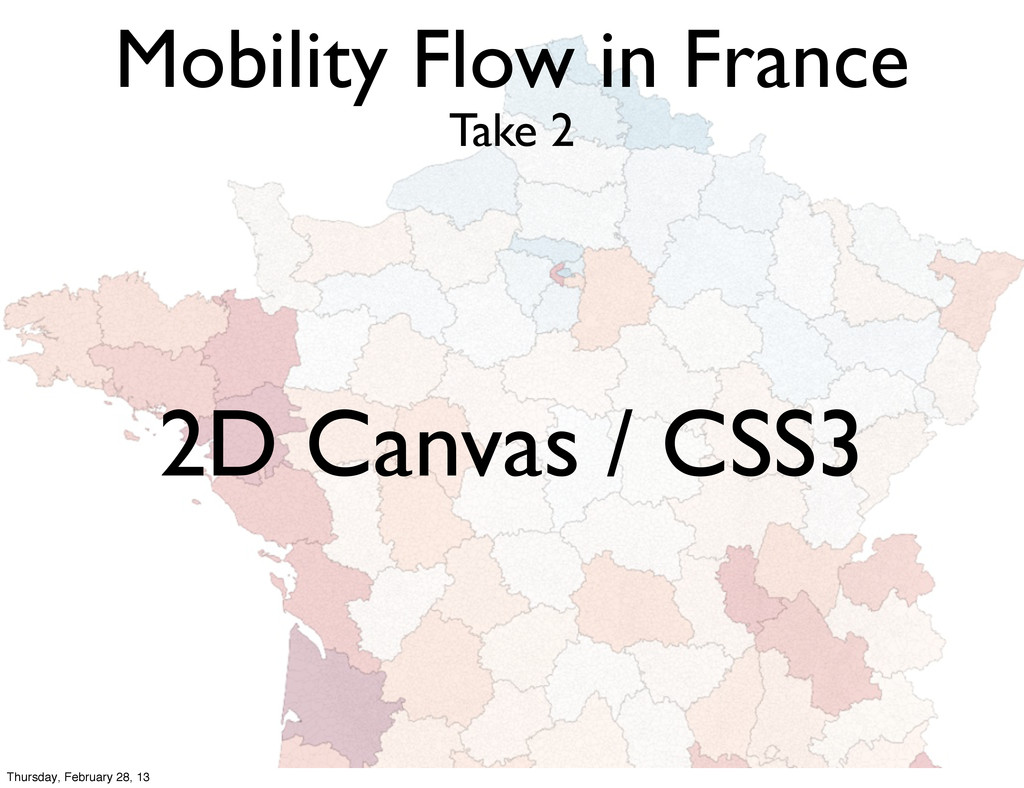
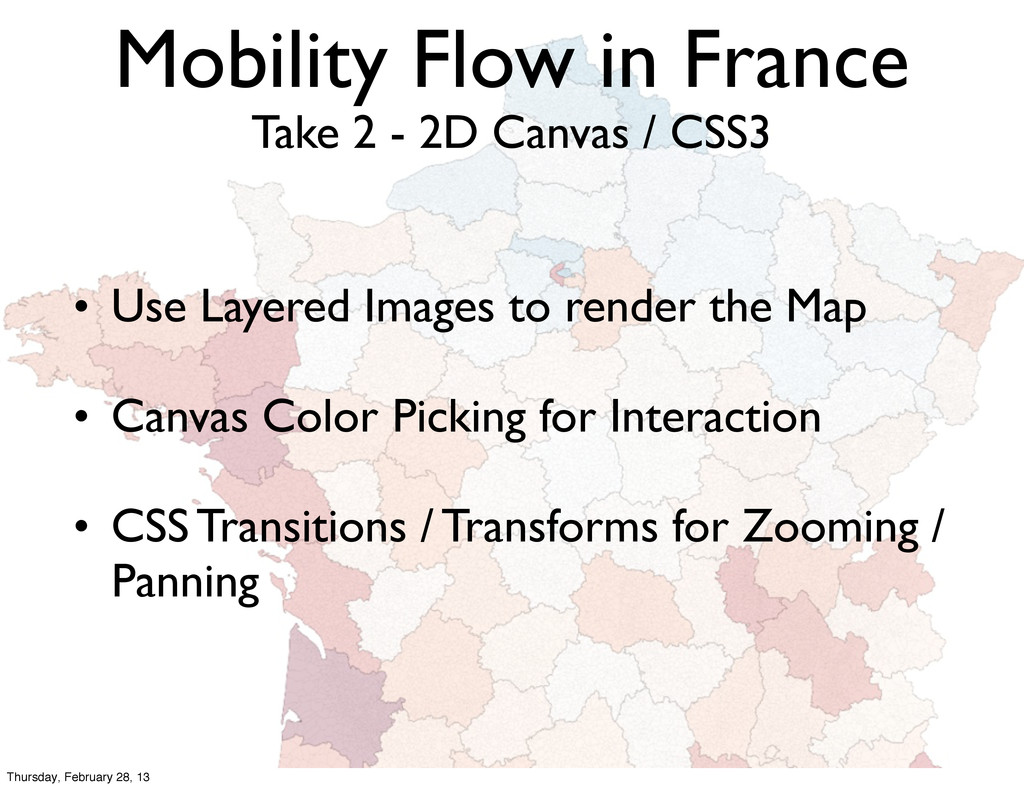
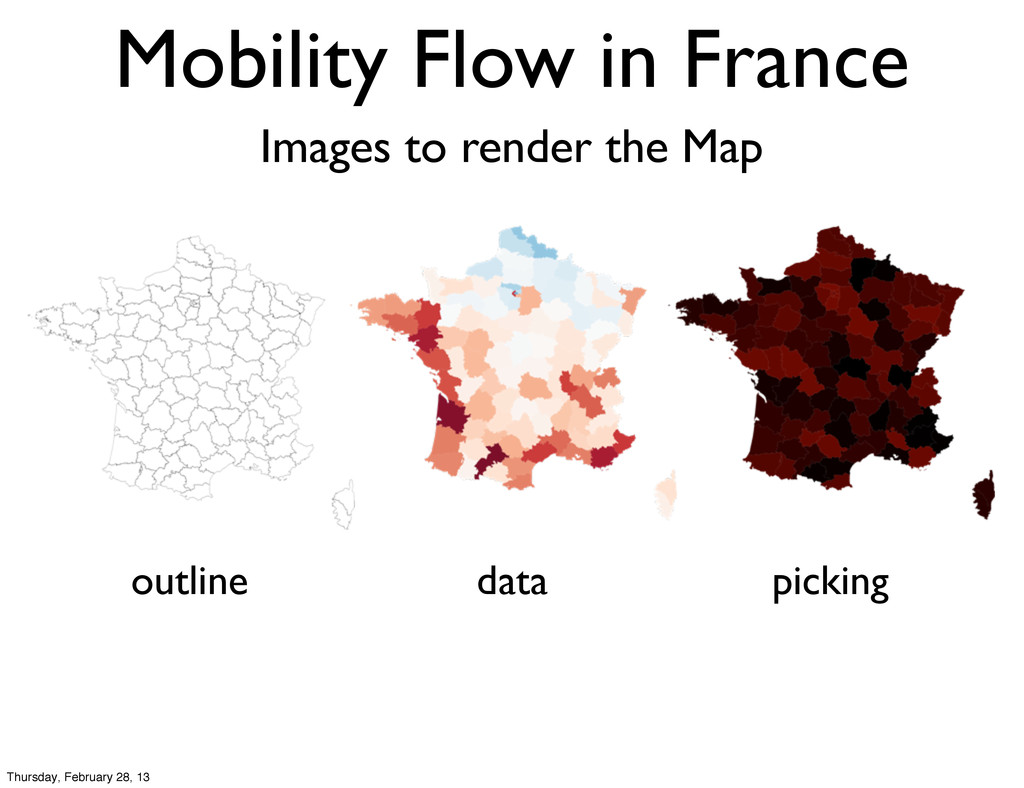
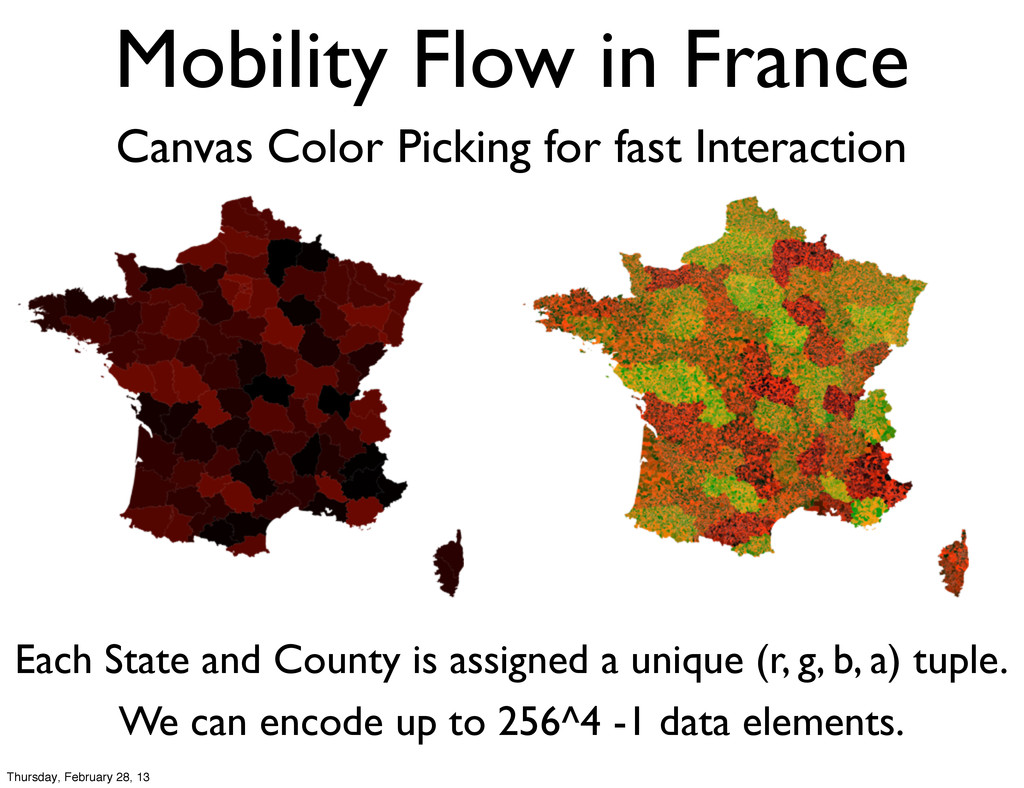
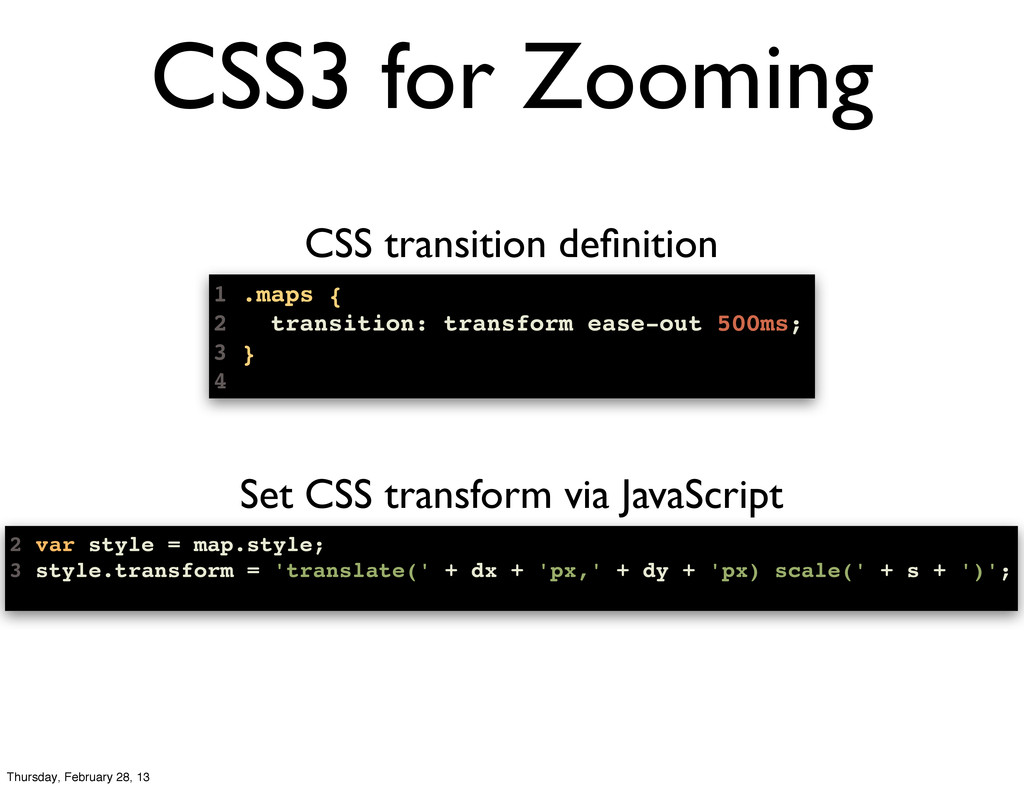
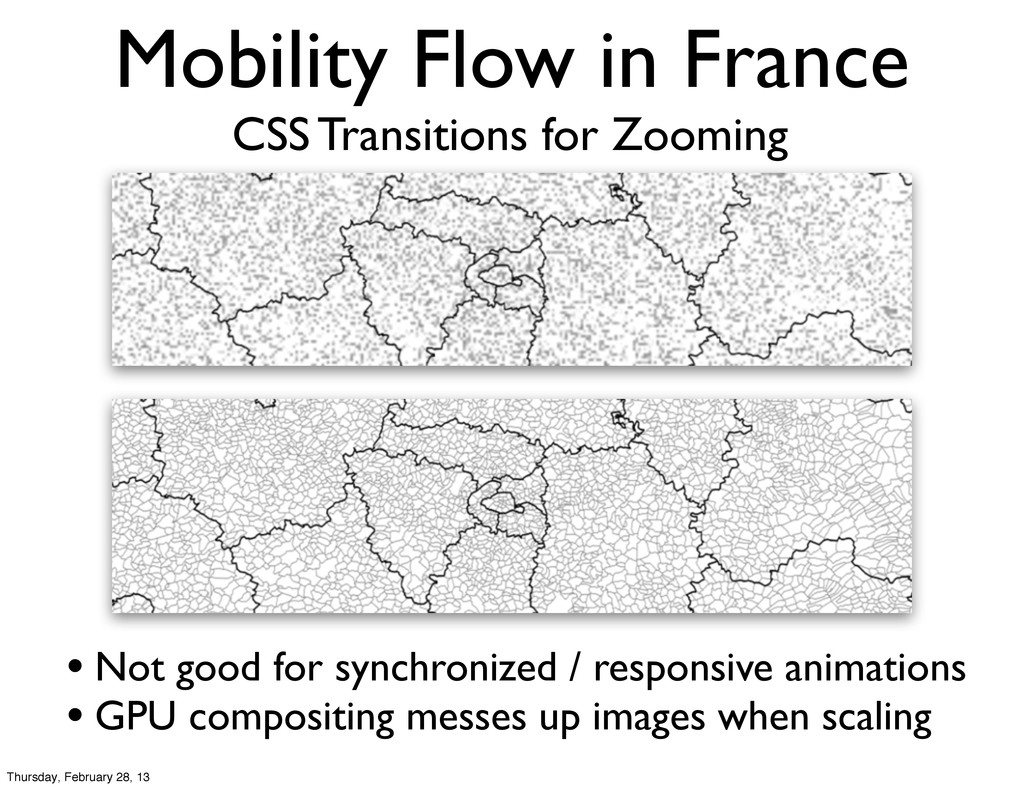
    the Map • Canvas Color Picking for Interaction • CSS Transitions / Transforms for Zooming / Panning Take 2 - 2D Canvas / CSS3 Thursday, February 28, 13
  7. Mobility Flow in France Images to render the Map outline

    data picking Thursday, February 28, 13
  8. Mobility Flow in France Canvas Color Picking for fast Interaction

    Each State and County is assigned a unique (r, g, b, a) tuple. We can encode up to 256^4 -1 data elements. Thursday, February 28, 13
  9. Canvas An HTML Element In which you can paste images

    <canvas id='map' width='500' height='500'></canvas> 1 var canvas = document.querySelector('#map'), 2 ctx = canvas.getContext('2d'), 3 img = new Image(); 4 5 img.src = 'map.jpg'; 6 img.onload = function() { 7 ctx.drawImage(img, 0, 0); 8 }; var pixelArray = ctx.getImageData(0, 0, width, height); And then retrieve it’s pixels Thursday, February 28, 13
  10. 2D Canvas Color Picking for fast Interaction 3 counties.forEach(function(county, i)

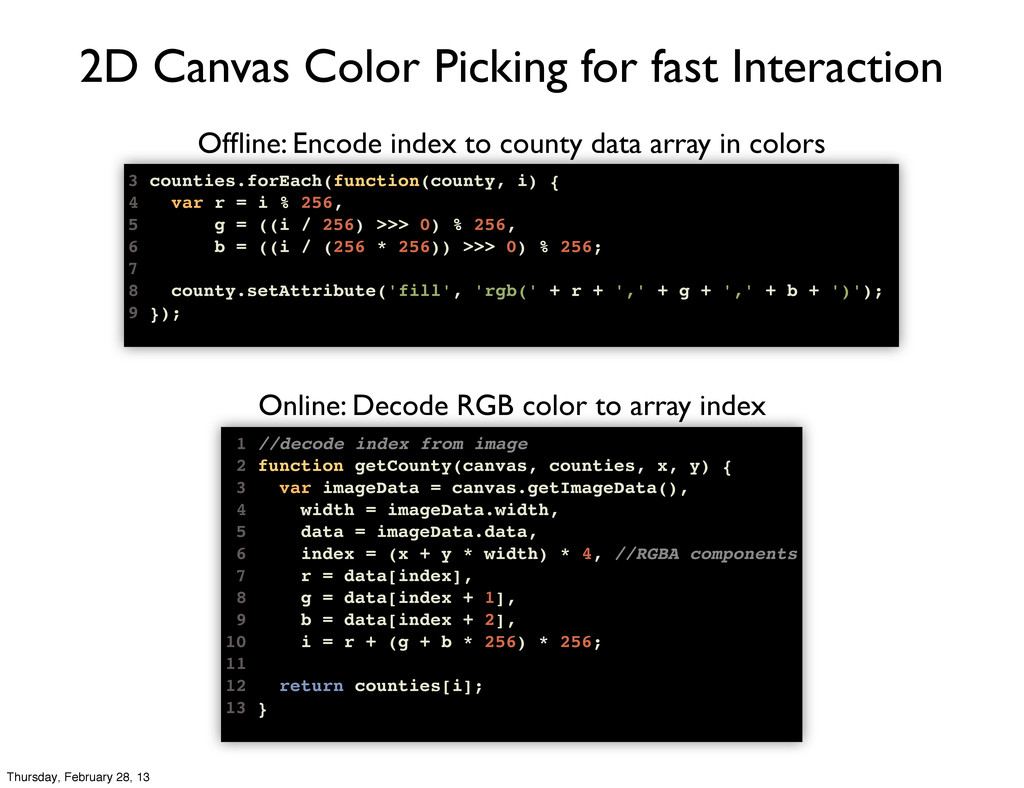
    { 4 var r = i % 256, 5 g = ((i / 256) >>> 0) % 256, 6 b = ((i / (256 * 256)) >>> 0) % 256; 7 8 county.setAttribute('fill', 'rgb(' + r + ',' + g + ',' + b + ')'); 9 }); 1 //decode index from image 2 function getCounty(canvas, counties, x, y) { 3 var imageData = canvas.getImageData(), 4 width = imageData.width, 5 data = imageData.data, 6 index = (x + y * width) * 4, //RGBA components 7 r = data[index], 8 g = data[index + 1], 9 b = data[index + 2], 10 i = r + (g + b * 256) * 256; 11 12 return counties[i]; 13 } Offline: Encode index to county data array in colors Online: Decode RGB color to array index Thursday, February 28, 13
  11. CSS3 for Zooming 1 .maps { 2 transition: transform ease-out

    500ms; 3 } 4 2 var style = map.style; 3 style.transform = 'translate(' + dx + 'px,' + dy + 'px) scale(' + s + ')'; CSS transition definition Set CSS transform via JavaScript Thursday, February 28, 13
  12. Mobility Flow in France CSS Transitions for Zooming • Not

    good for synchronized / responsive animations • GPU compositing messes up images when scaling Thursday, February 28, 13
  13. Mobility Flow in France WebGL •Same image tile principle •More

    control on animations •More control on GPU management Thursday, February 28, 13
  14. JavaScript Fragment Shader WebGL JS API Vertex Shader GLSL API

    GLSL API How does WebGL work? ...and why is it so fast? Thursday, February 28, 13
  15. Data Facts • 1200 weather stations • 72 hours of

    data • 5 variables - latitude, longitude, speed & wind direction, temperature = 460.000 items Thursday, February 28, 13
  16. Rendering WebGL / PhiloGL //Create application PhiloGL('canvasId', { program: {

    from: 'uris', vs: 'shader.vs.glsl', fs: 'shader.fs.glsl' }, camera: { position: { x: 0, y: 0, z: -50 } }, textures: { src: ['arroway.jpg', 'earth.jpg'] }, events: { onDragMove: function(e) { //do things... }, onMouseWheel: function(e) { //do things... } }, onError: function() { alert("There was an error creating the app."); }, onLoad: function(app) { /* Do things here */ } }); Thursday, February 28, 13
  17. When choosing a Standard for your Viz you could start

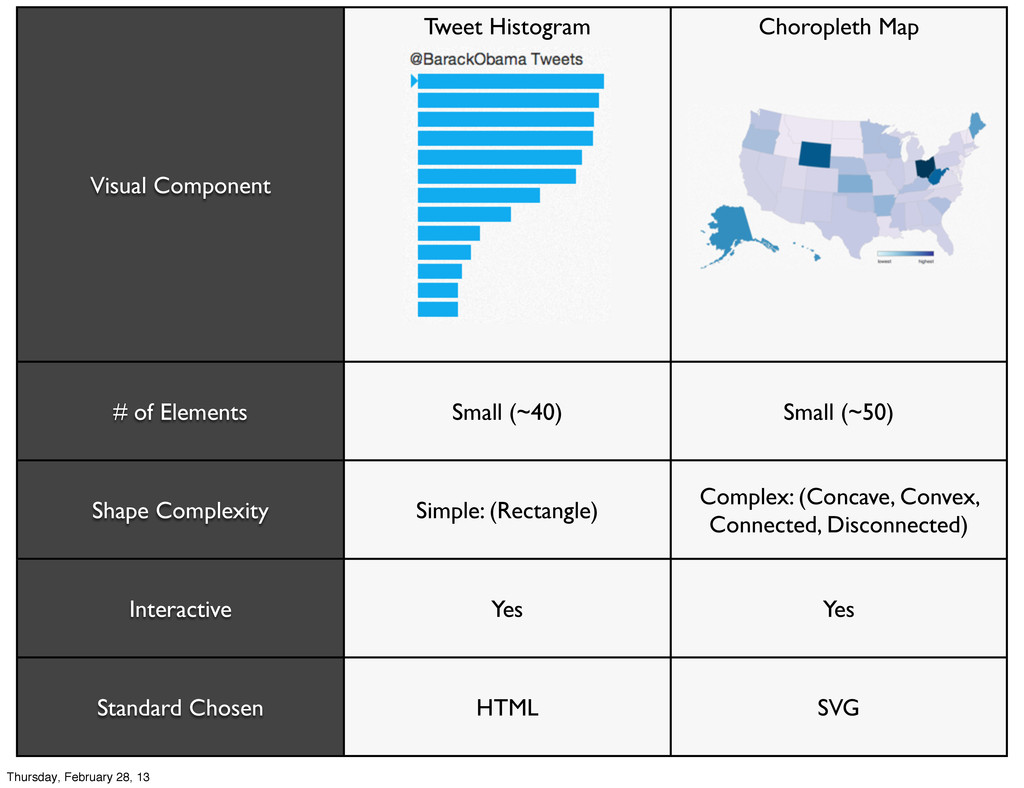
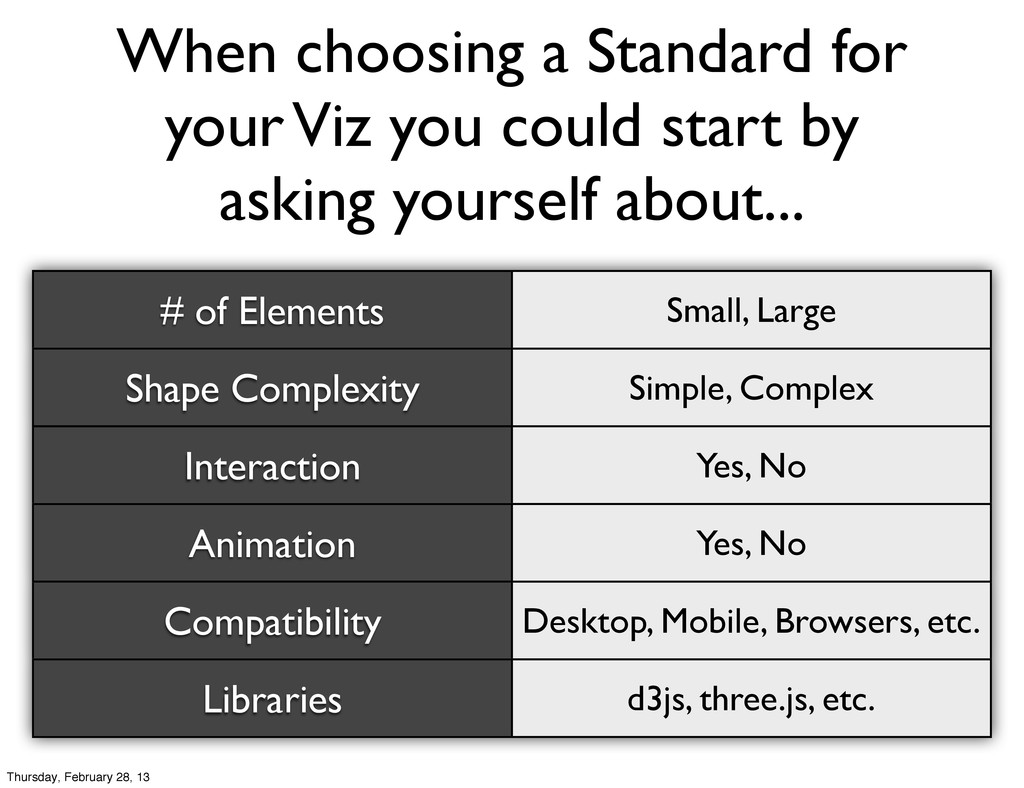
    by asking yourself about... # of Elements Shape Complexity Interaction Animation Compatibility Libraries Small, Large Simple, Complex Yes, No Yes, No Desktop, Mobile, Browsers, etc. d3js, three.js, etc. Thursday, February 28, 13