Upgrade to Pro
— share decks privately, control downloads, hide ads and more …
Speaker Deck
Features
Speaker Deck
PRO
Sign in
Sign up for free
Search
Search
Interaktywna wizualizacja danych w d3.js
Search
Sponsored
·
SiteGround - Reliable hosting with speed, security, and support you can count on.
→
Piotr Migdał
January 25, 2016
Programming
760
2
Share
Embed
Copy iframe code
Copy JS code
Copy link
Start on current slide
Interaktywna wizualizacja danych w d3.js
warsztaty KFnrD w ICM UW
Piotr Migdał
January 25, 2016
More Decks by Piotr Migdał
See All by Piotr Migdał
Detecting trypophobia triggers (with deep learning)
pmigdal
1
390
Teaching Machine Learning
pmigdal
7
1.7k
A game needs to framework
pmigdal
1
260
Visualizing word coincidences
pmigdal
1
110
Dreams, Drugs and ConvNets
pmigdal
1
990
{Machine, Deep} Learning for software engineers
pmigdal
1
2.2k
Lightning talk - Teaching machine learning
pmigdal
0
1.8k
Gry naukowe, moja gra kwantowa
pmigdal
0
260
Side-projects and off-topics
pmigdal
0
180
Other Decks in Programming
See All in Programming
【やさしく解説 設計編・中級 #6】良いアーキテクチャとは ~ 一本の登り道の、行き先 ~
panda728
PRO
0
180
PHP初心者セッション2026 〜生成AIでは見えない裏側を知る:今だからLAMPを通して仕組みを学ぶ〜
kashioka
0
650
Prismを使った型安全な暗号化_関数型まつり2026
_fhhmm
0
150
Terraform標準の組織で AWS CDKをどう使うか
mu7889yoon
1
350
【SRE NEXT 2026 Lunch Session】一人目専任SREの立ち上げを加速する ― AIと進めたオンボーディングで2分を0.04秒にした話
pkshadeck
PRO
0
3k
音楽のための関数型プログラミング言語mimiumにおける多段階計算の活用
tomoyanonymous
1
360
霧の中の代数的エフェクト
funnyycat
1
420
初めてのKubernetes 本番運用でハマった話
oku053
0
130
Generative UI & AI-Assistants for Your Angular Solutions
manfredsteyer
PRO
1
220
ソフトウェア設計に溶けるインフラ ― AWS CDK のインフラ認識論
konokenj
2
630
分散システム、なんですぐ死んでしまうん?耐障害性を高めたいあなたのためのレジリエンスパターン入門
mshibuya
7
6.8k
Embedded SREと共に達成した会員管理システムのAWS移行 - SRE NEXT 2026 ランチスポンサーセッション
niftycorp
PRO
1
3k
Featured
See All Featured
Fashionably flexible responsive web design (full day workshop)
malarkey
408
67k
Building Applications with DynamoDB
mza
96
7.1k
Leading Effective Engineering Teams in the AI Era
addyosmani
9
2.2k
Music & Morning Musume
bryan
47
7.3k
Fireside Chat
paigeccino
42
4k
No one is an island. Learnings from fostering a developers community.
thoeni
21
3.8k
Leadership Guide Workshop - DevTernity 2021
reverentgeek
1
330
brightonSEO & MeasureFest 2025 - Christian Goodrich - Winning strategies for Black Friday CRO & PPC
cargoodrich
3
760
Winning Ecommerce Organic Search in an AI Era - #searchnstuff2025
aleyda
1
2.1k
What’s in a name? Adding method to the madness
productmarketing
PRO
24
4.1k
Typedesign – Prime Four
hannesfritz
42
3.1k
Odyssey Design
rkendrick25
PRO
2
730
Transcript
Interaktywna wizualizacja danych w d3.js Piotr Migdał warsztaty KFnrD ICM,
25-29 sty 2016
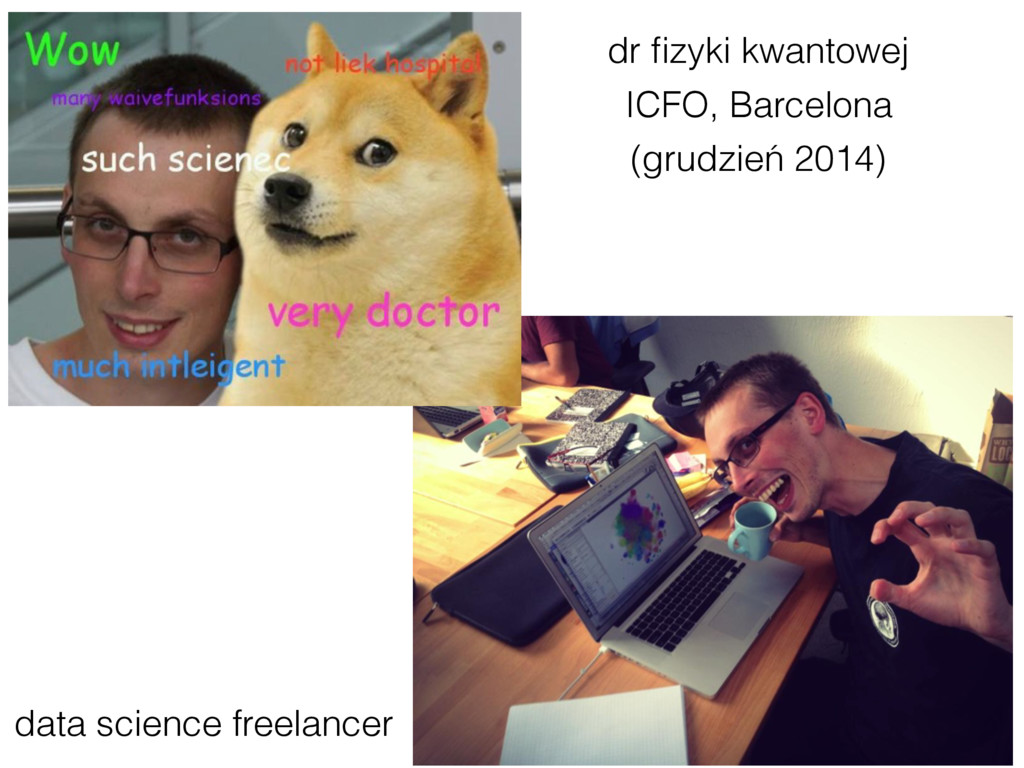
dr fizyki kwantowej data science freelancer ICFO, Barcelona (grudzień 2014)
None
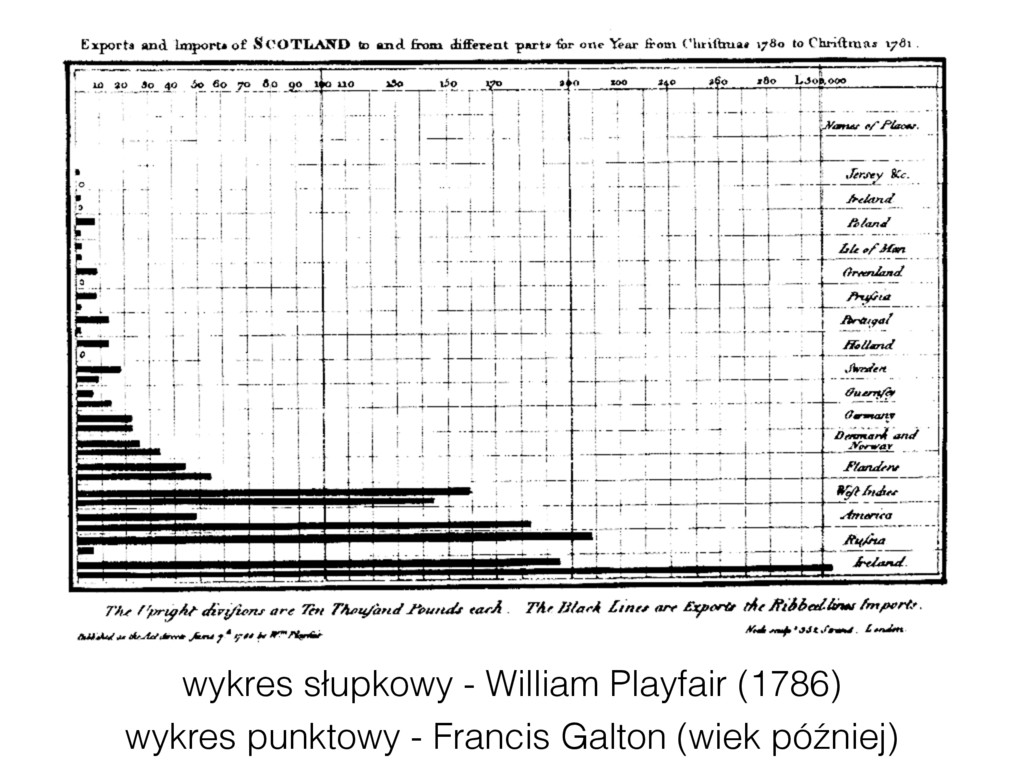
wykres słupkowy - William Playfair (1786) wykres punktowy - Francis
Galton (wiek później)
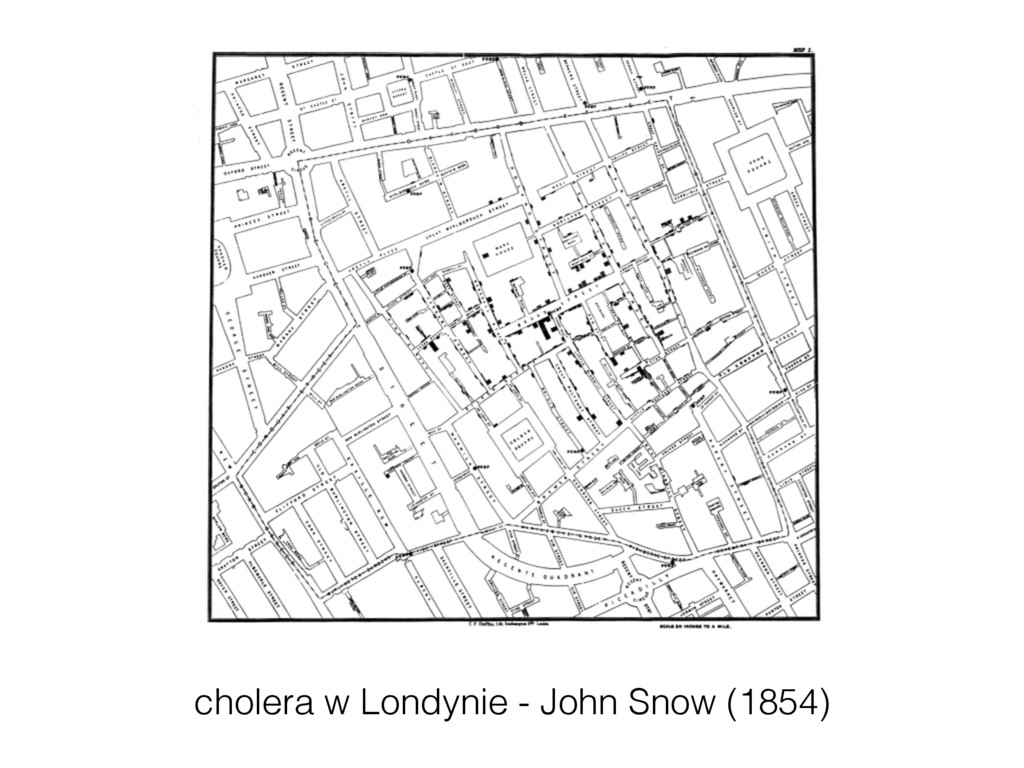
cholera w Londynie - John Snow (1854)
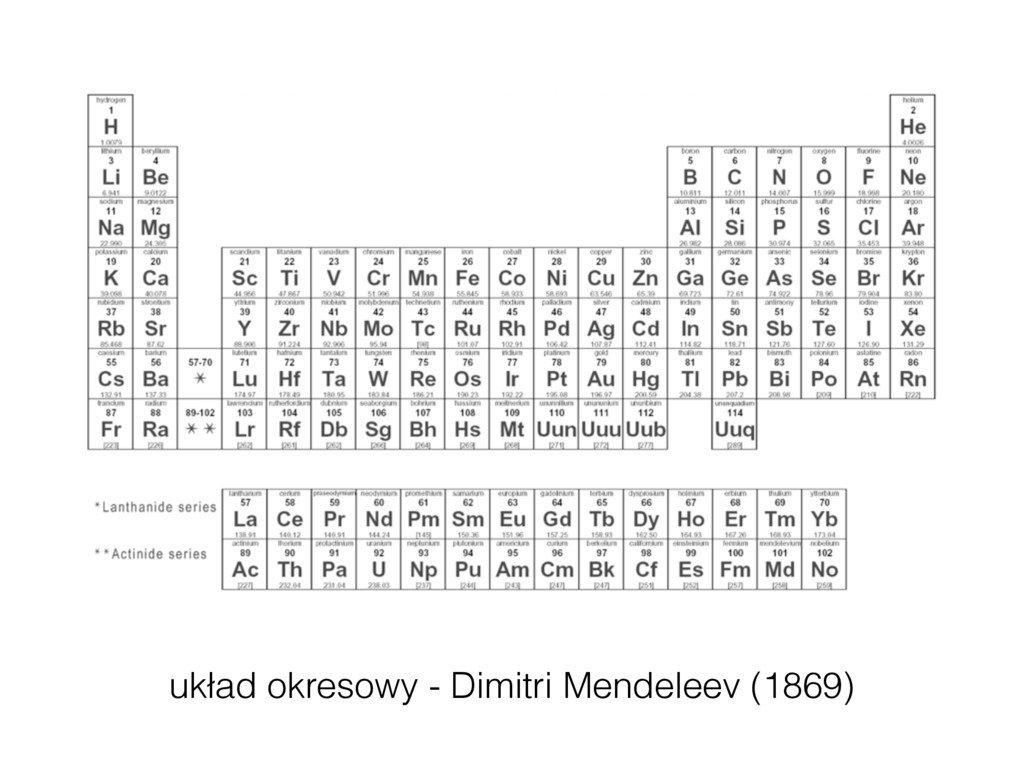
Dmitri Mendeleev | Periodic Table of Elements (1869) układ okresowy
- Dimitri Mendeleev (1869)
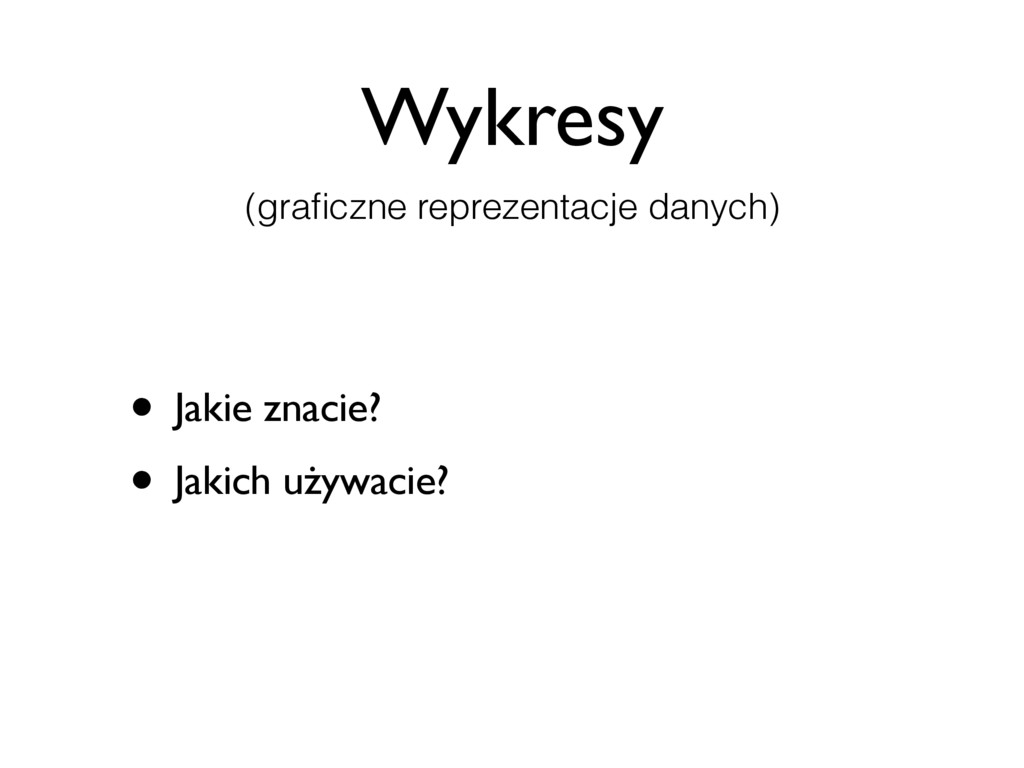
Wykresy • Jakie znacie? • Jakich używacie? (graficzne reprezentacje danych)
3.14159
Dobry wykres czy zły?
http://darkhorseanalytics.com/blog/data-looks-better-naked
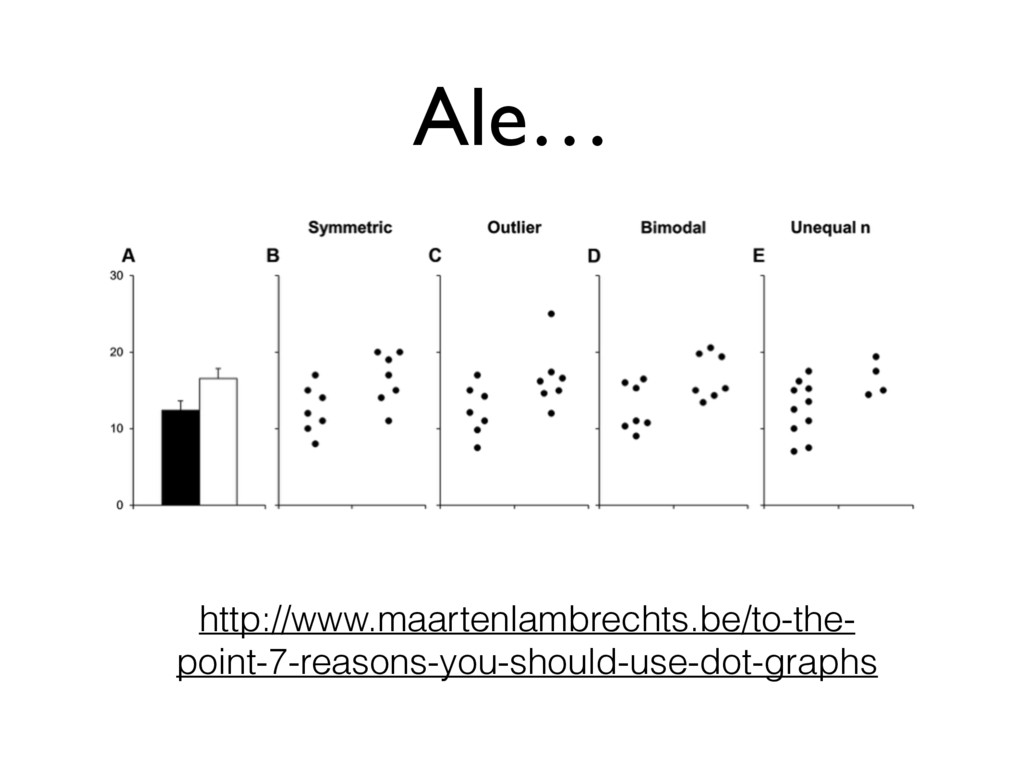
Ale… http://www.maartenlambrechts.be/to-the- point-7-reasons-you-should-use-dot-graphs
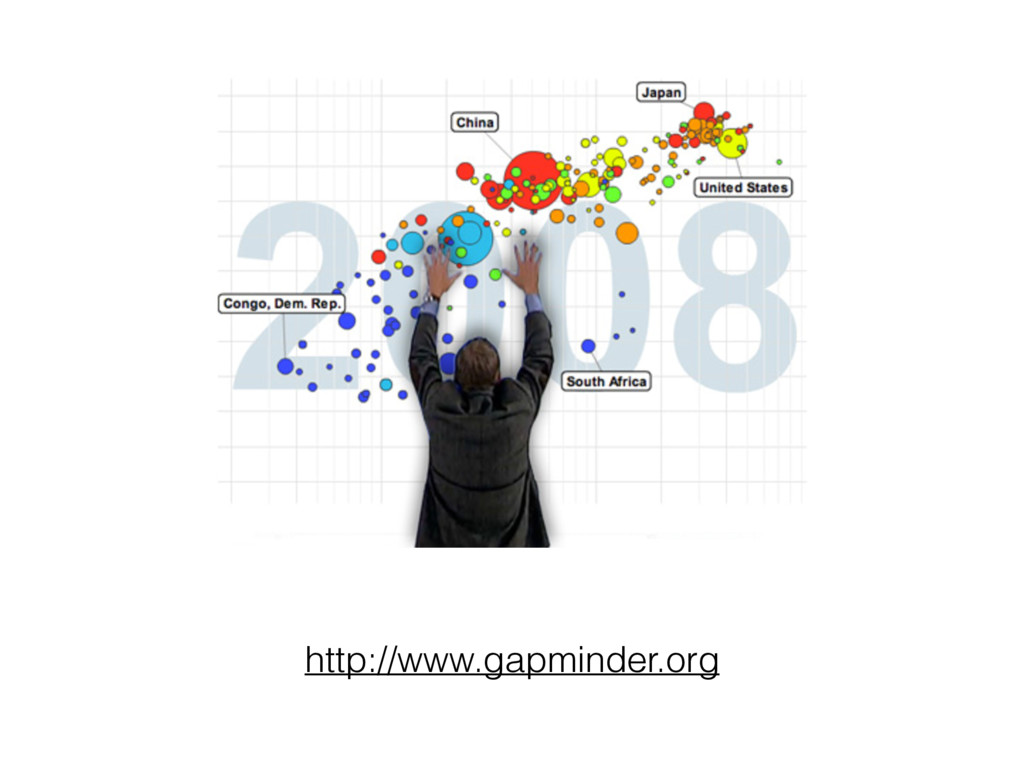
http://www.gapminder.org
None
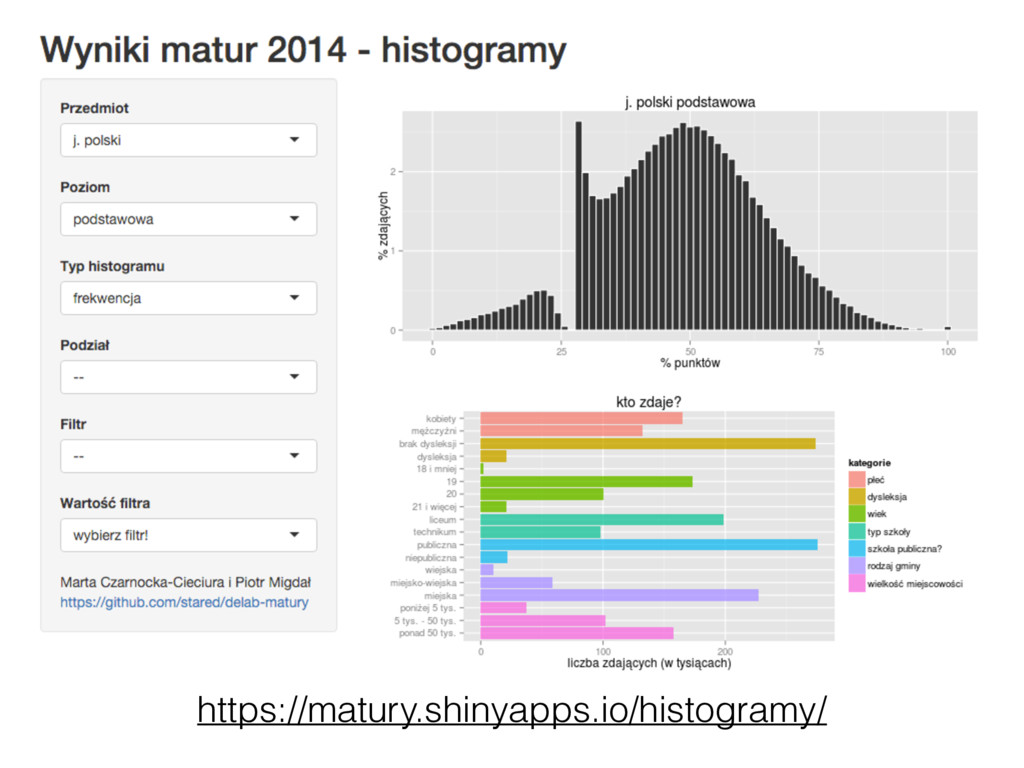
pakiet R: ggplot2 http://blog.echen.me/2012/01/17/ quick-introduction-to-ggplot2 http://r4stats.com/examples/graphics-ggplot2
https://matury.shinyapps.io/histogramy/
None
None
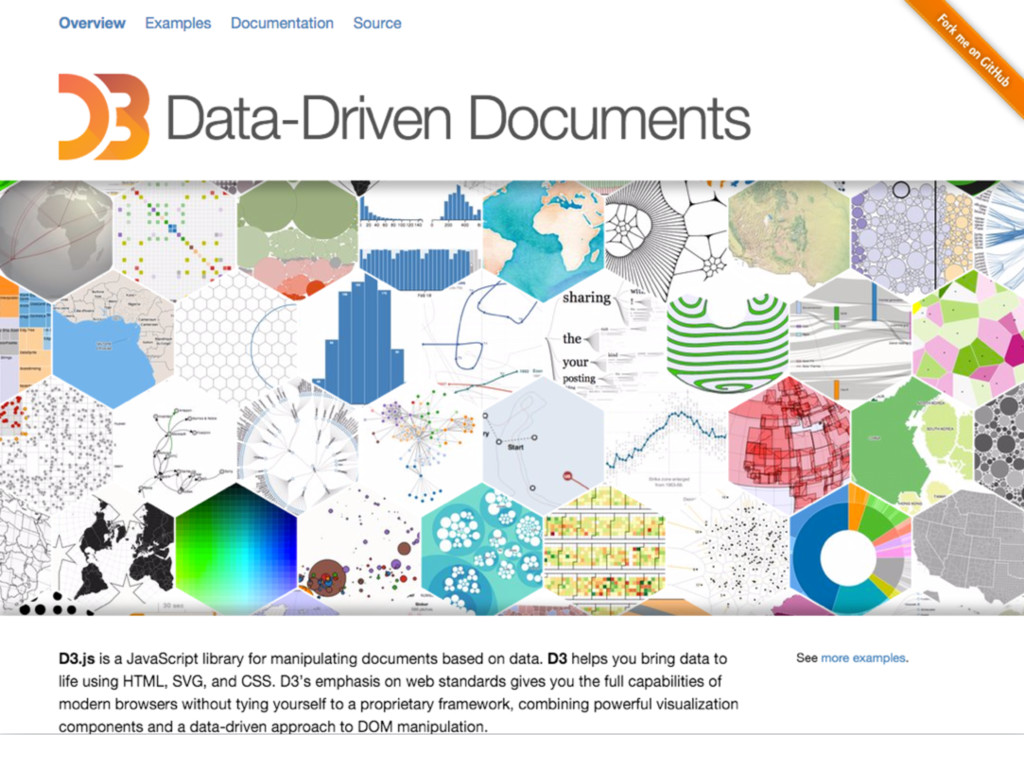
D3.js • algorytmiczne • minimalistyczne • de facto (świetny) standard
wizualizacji „perfection is finally attained not when there is no longer anything to add, but when there is no longer anything to take away” Antoine de Saint-Exupéry
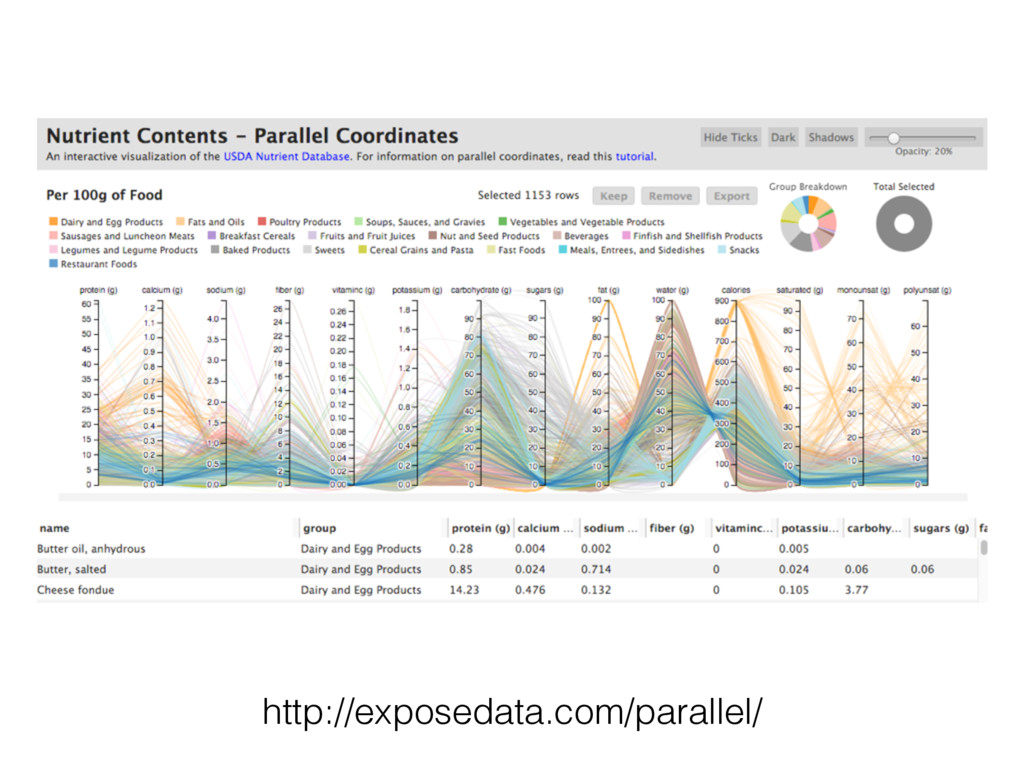
http://exposedata.com/parallel/
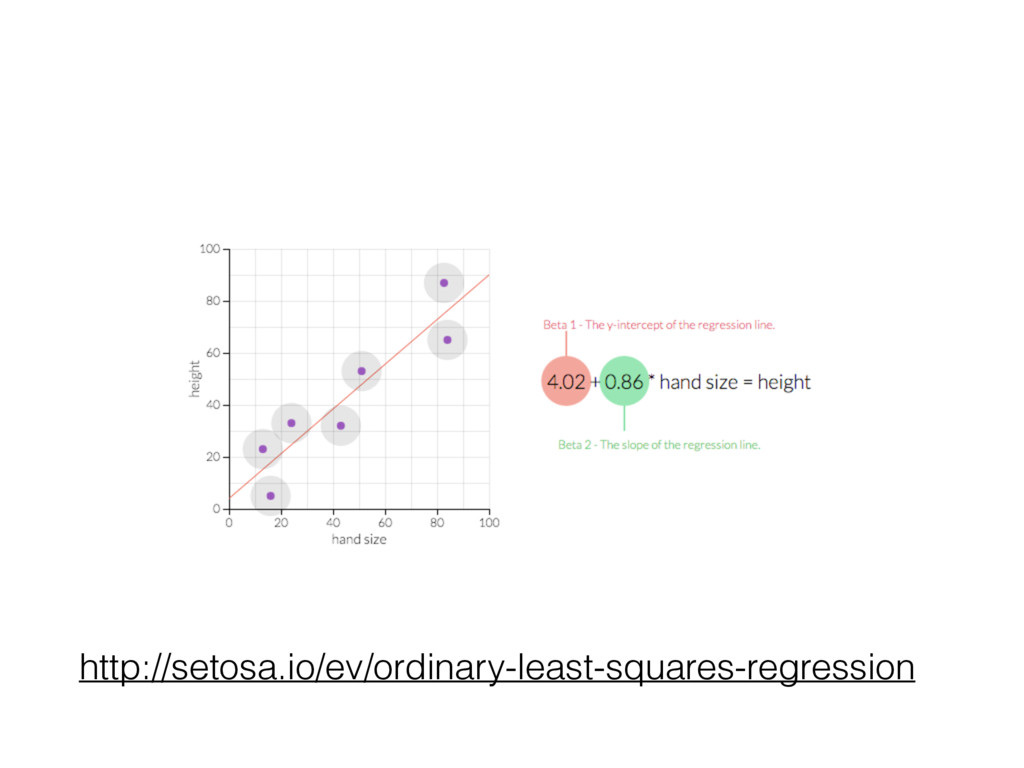
http://setosa.io/ev/ordinary-least-squares-regression
http://bl.ocks.org/mbostock/7322386
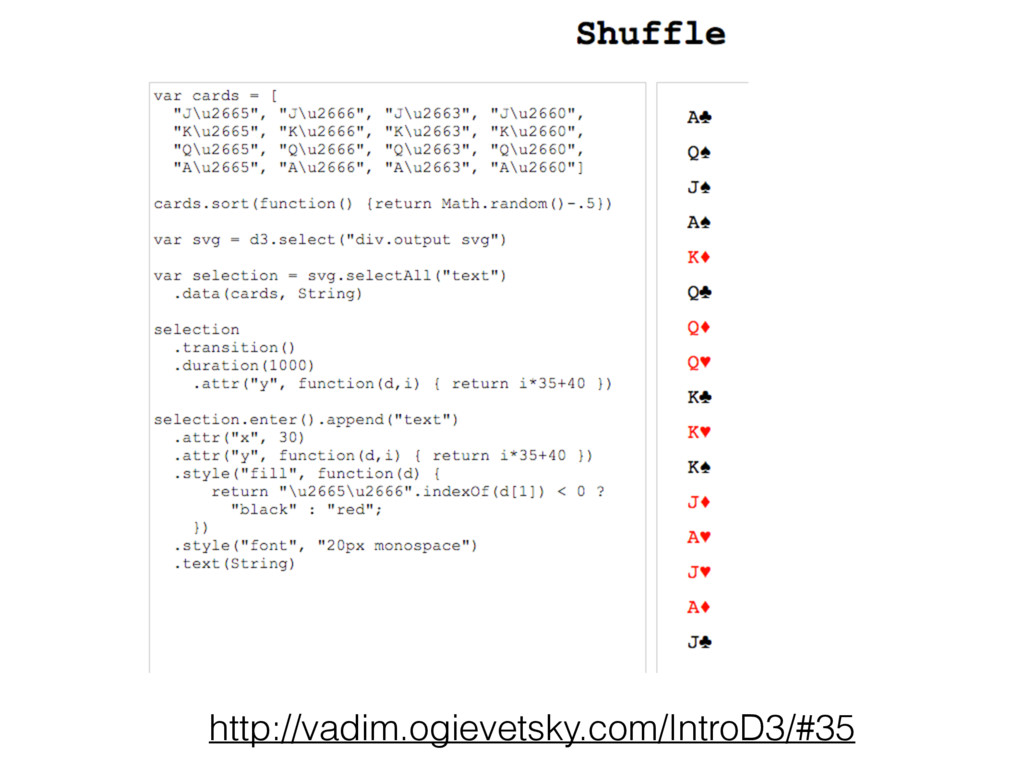
http://vadim.ogievetsky.com/IntroD3/#35
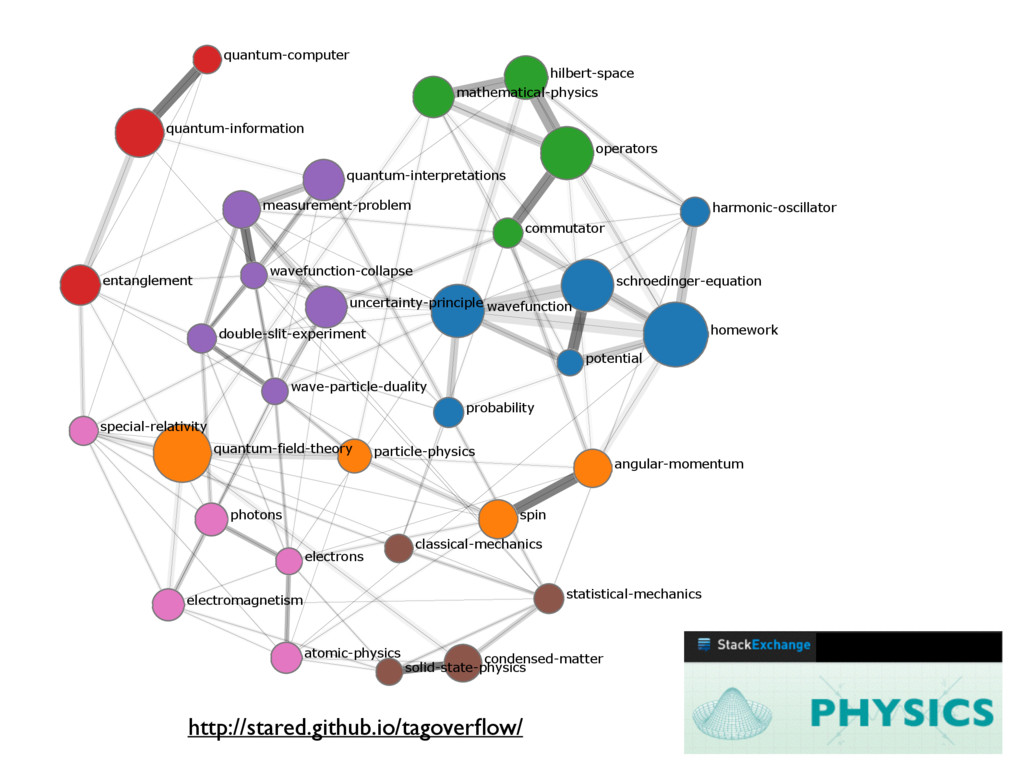
homework quantum-field-theory wavefunction operators schroedinger-equation quantum-information hilbert-space uncertainty-principle mathematical-physics quantum-interpretations
entanglement spin angular-momentum measurement-problem condensed-matter particle-physics photons electromagnetism atomic-physics probability commutator statistical-mechanics harmonic-oscillator double-slit-experiment special-relativity classical-mechanics quantum-computer solid-state-physics electrons wavefunction-collapse wave-particle-duality potential http://stared.github.io/tagoverflow/
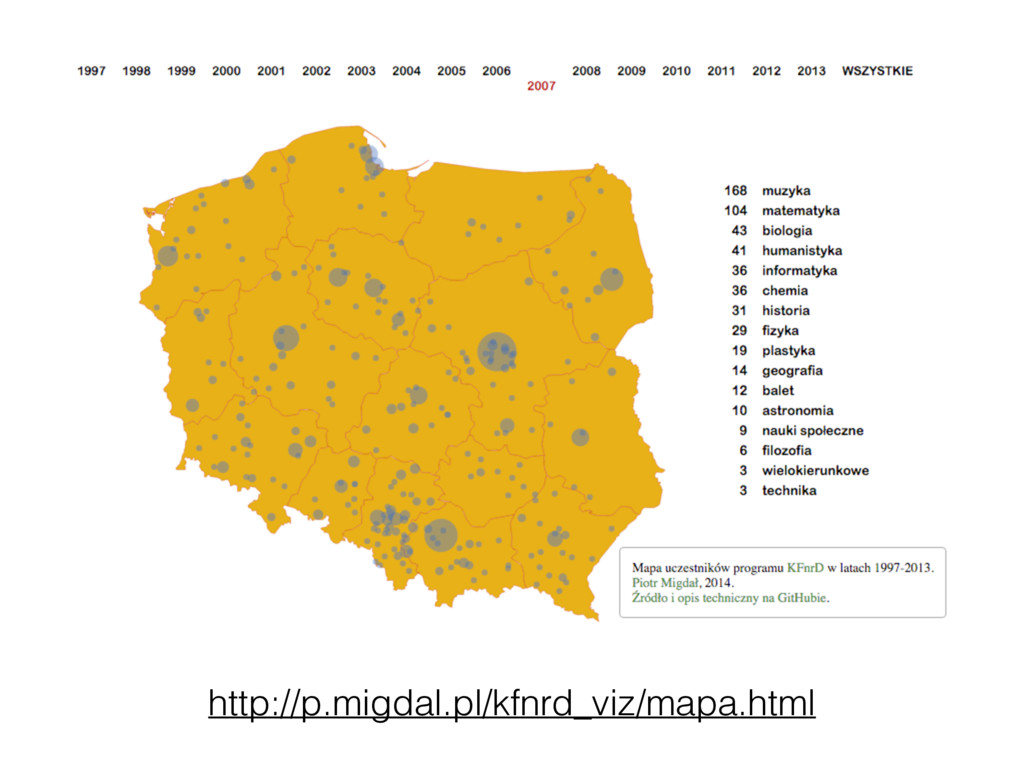
http://p.migdal.pl/kfnrd_viz/mapa.html
Co będzie? • co wizualizować, jak i dlaczego? • JavaScript
(nie trzeba znać przed) • rozgrzewka: układ okresowy po Twojemu • praca nad Waszym projektem
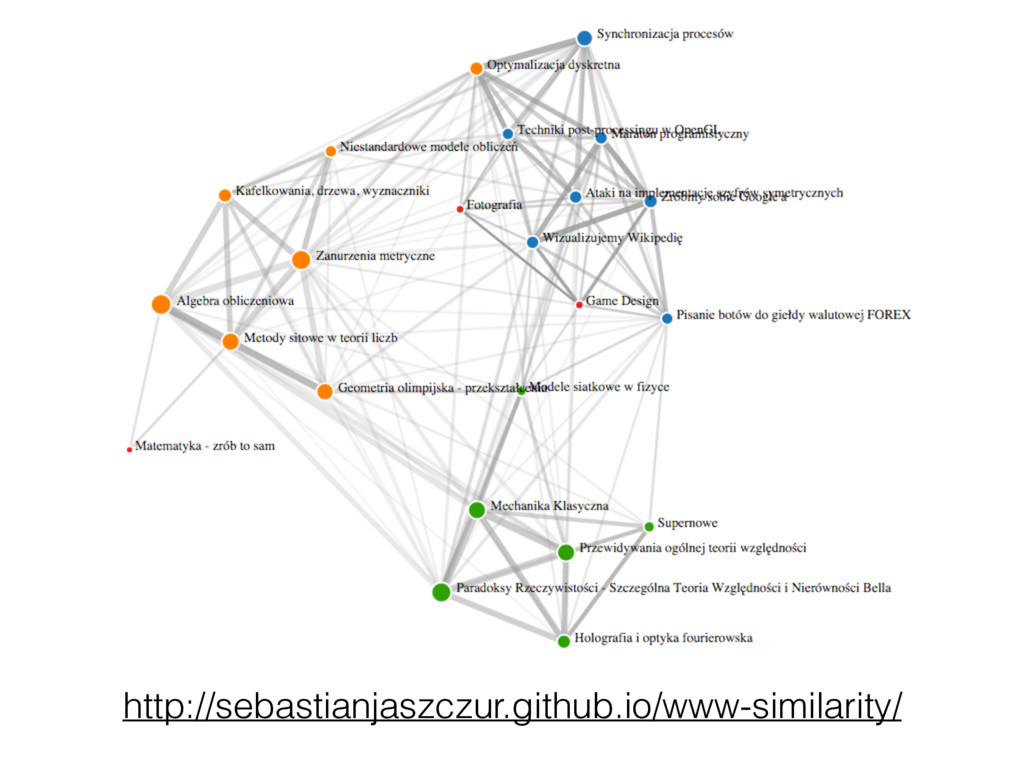
http://sebastianjaszczur.github.io/www-similarity/
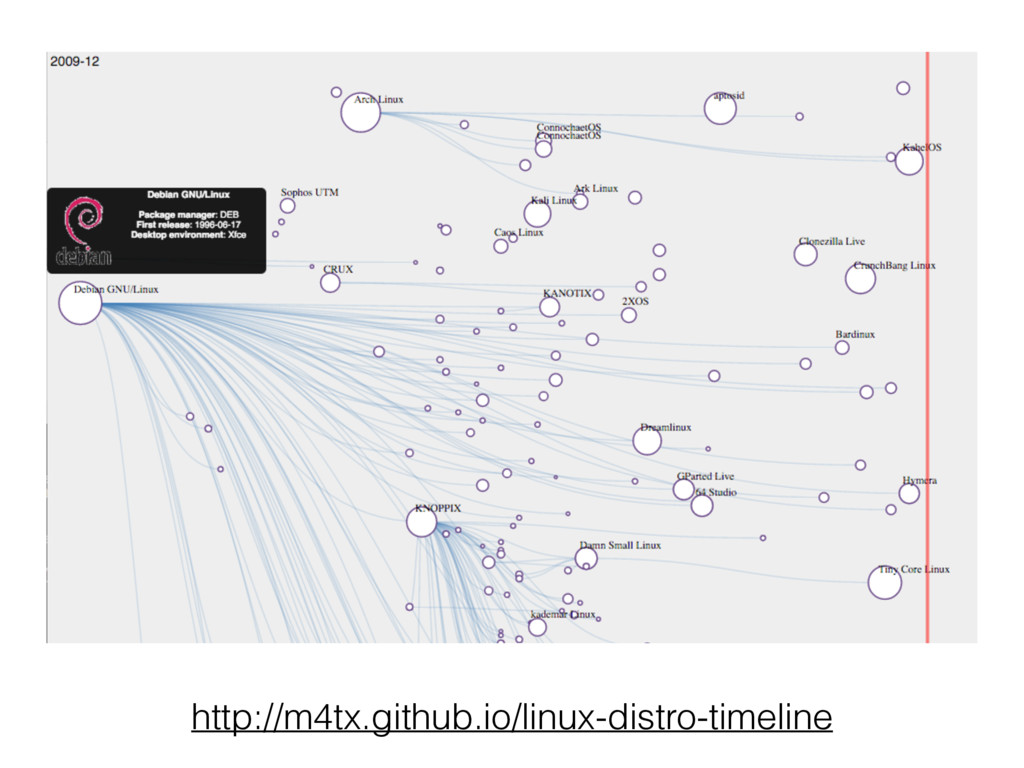
http://m4tx.github.io/linux-distro-timeline
Lektury • Edward Tufte, The Visual Display of Quantitative Information
• Willard C. Brinton, Graphic Presentation (1939) https://archive.org/stream/ graphicpresentat00brinrich#page/n0/mode/thumb
Moje ściągawki • http://warsztatywww.wikidot.com/ www10:wizualizujemy-wikipedie • http://smarterpoland.pl/index.php/2014/06/ metawstep-do-wizualizacji-danych-w-d3-js/ • https://github.com/DELabUW/szkola-letnia-2015/
blob/master/zajecia/ deser_sztuka_robienia_wykresow.ipynb
Dla wszystkich • http://www.fallen.io/ww2/ (~20 min) • mogę pomóc z:
• R ggplot2 • Python: Pandas/Seaborn