Upgrade to Pro — share decks privately, control downloads, hide ads and more …

Elastic Stack 2.x News

Avatar for Pablo Musa Pablo Musa
April 06, 2016

Elastic Stack 2.x News

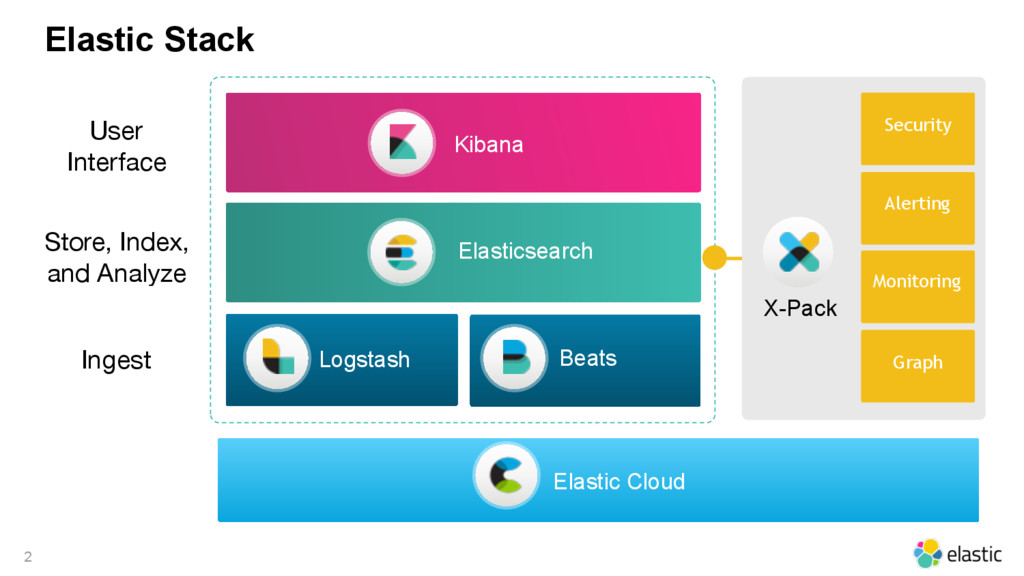
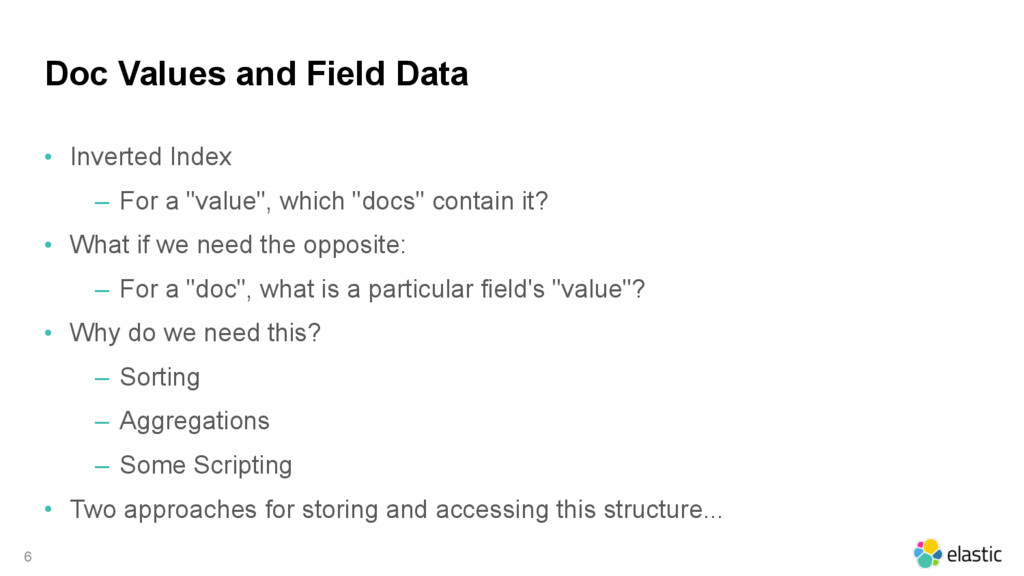
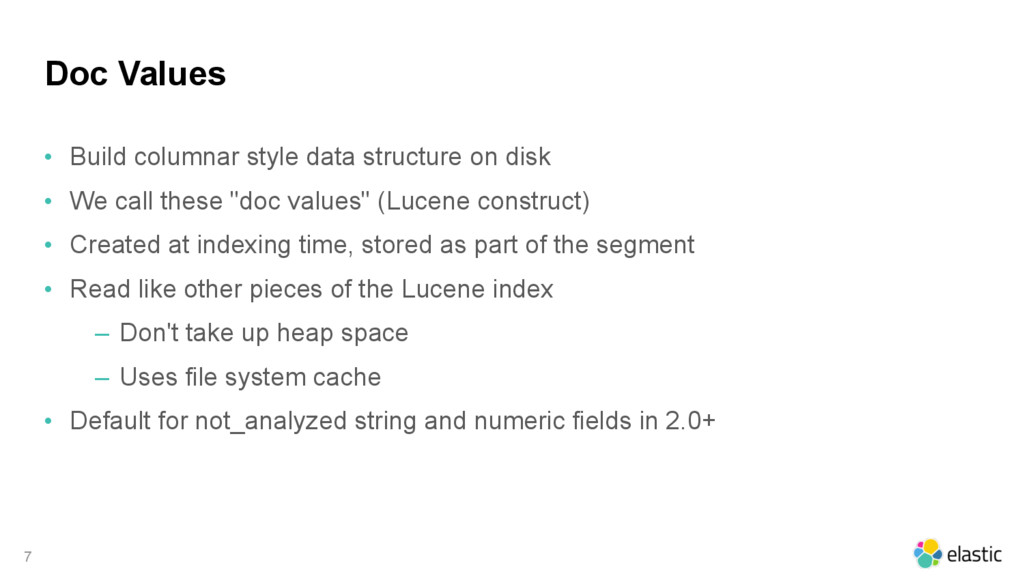
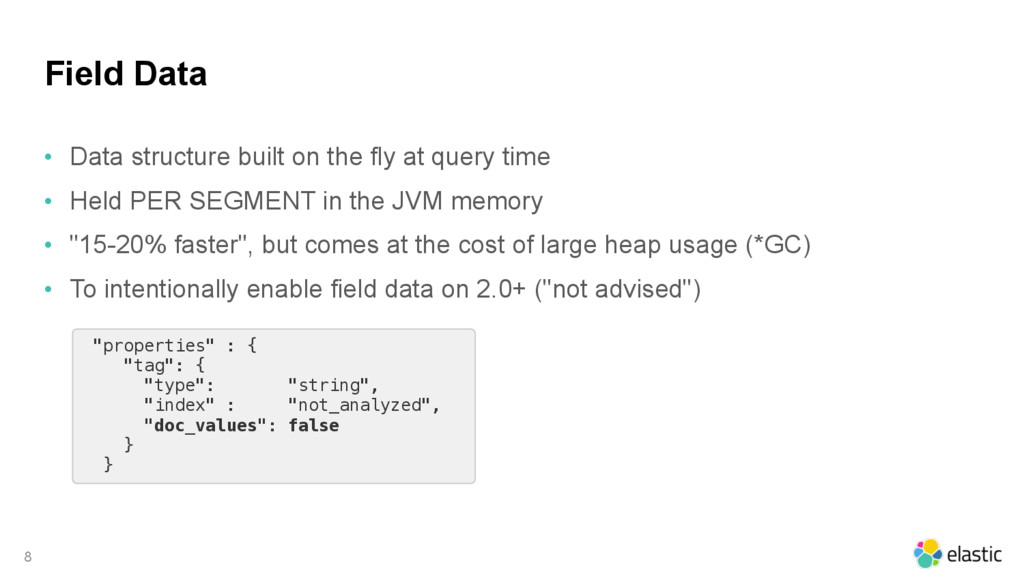
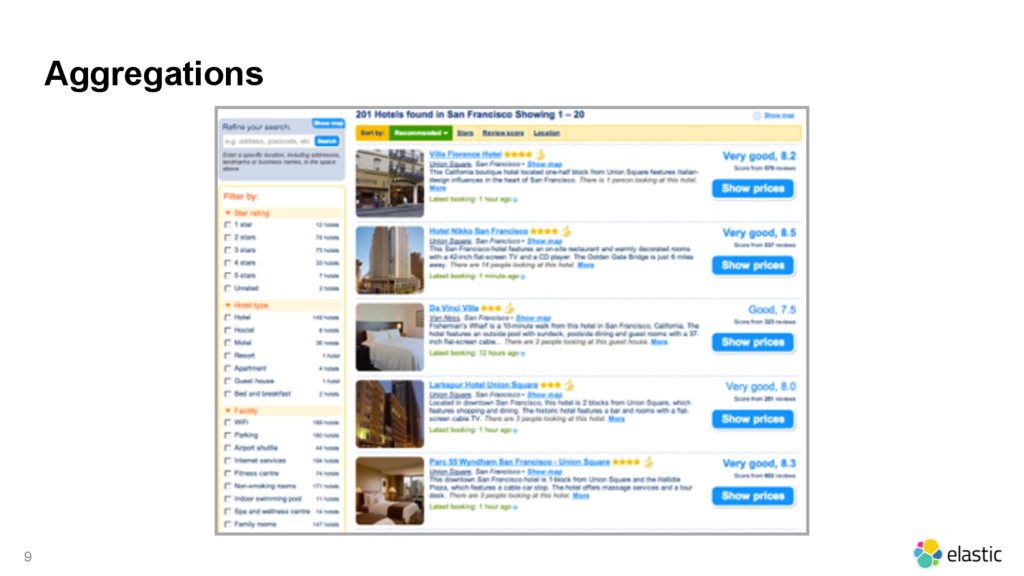
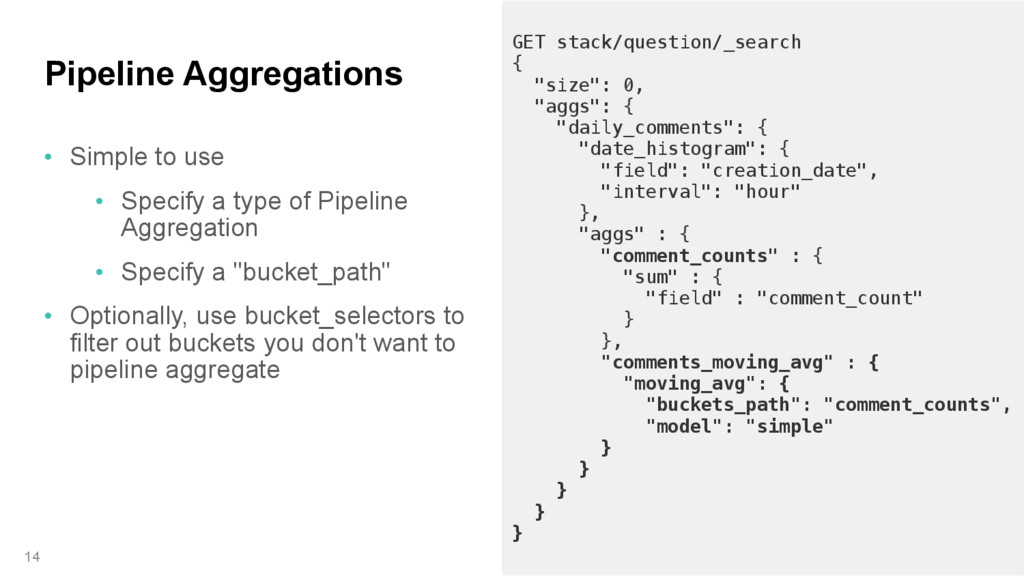
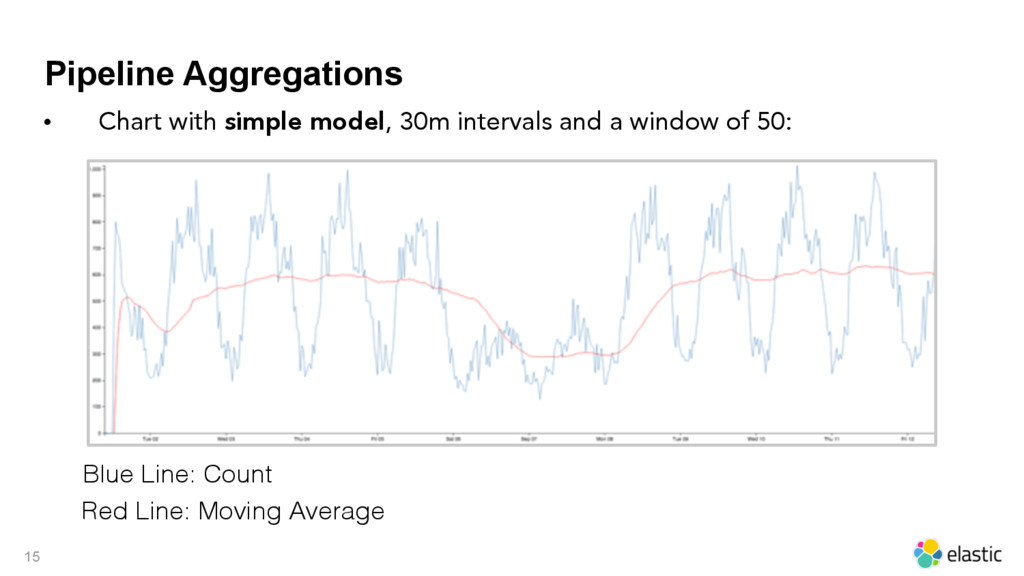
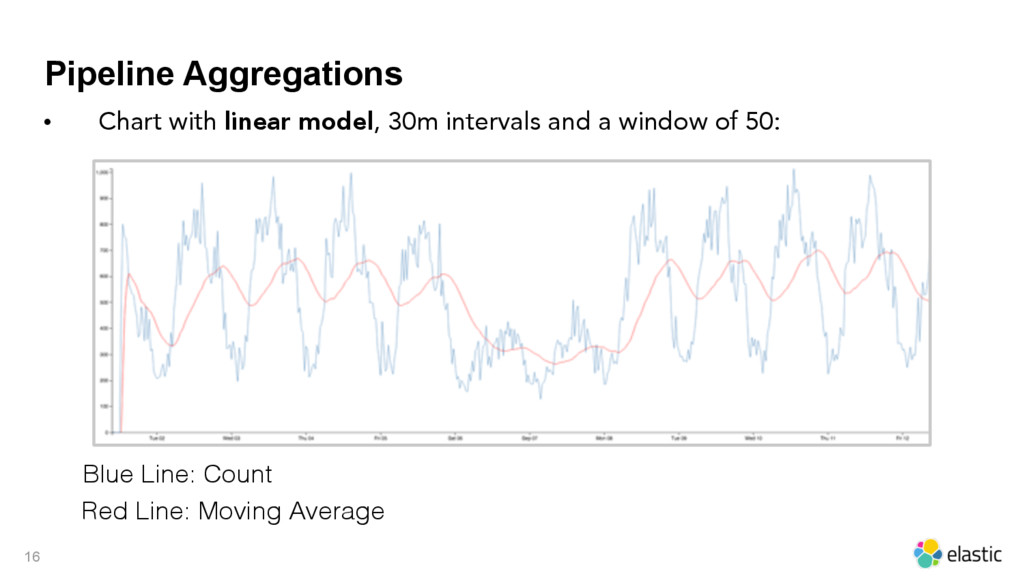
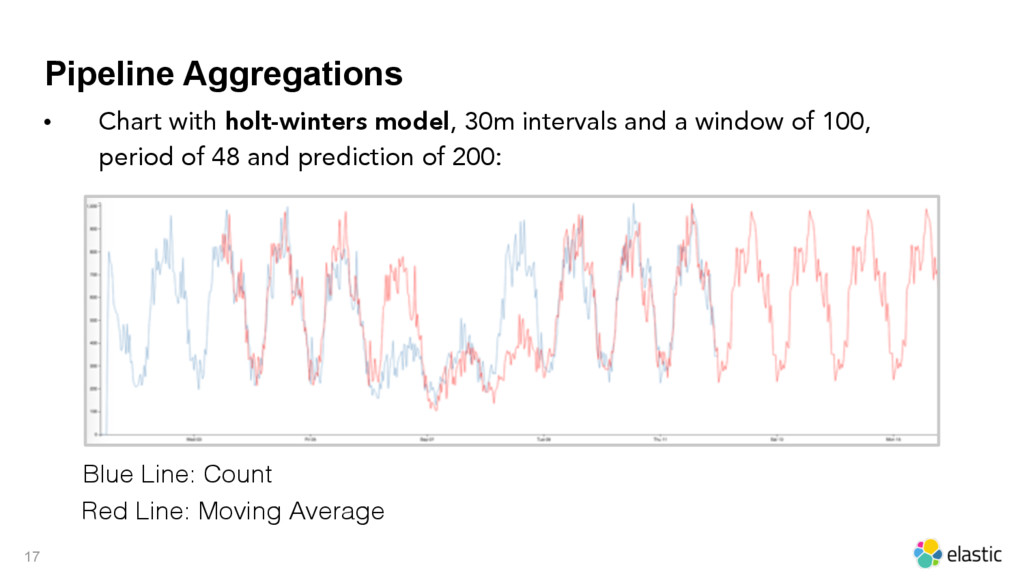
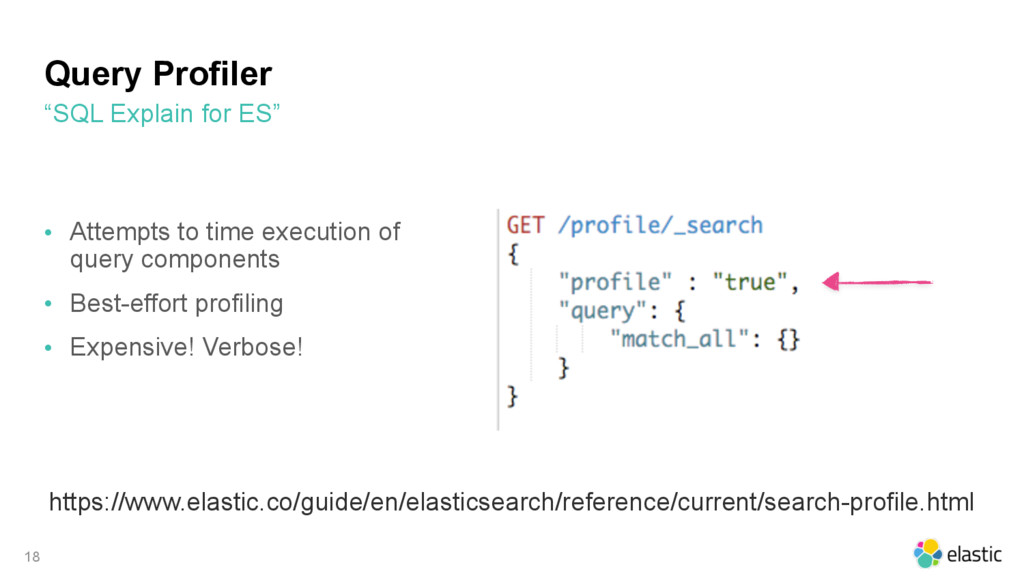
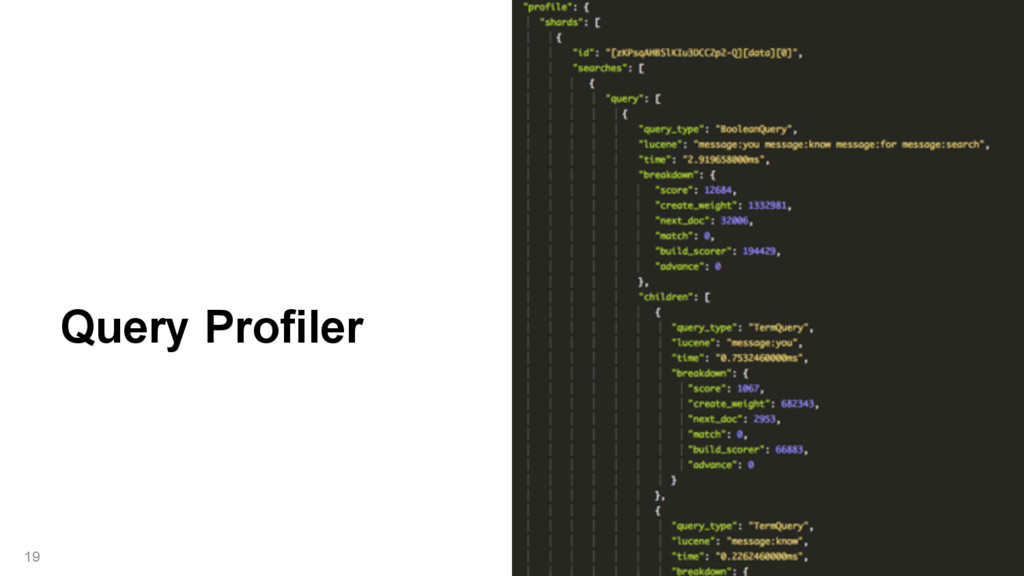
• Elasticsearch: pipeline aggregation, sampler aggregation, query profiler, query DSL update and optimization, doc_values x field_data, ingest node

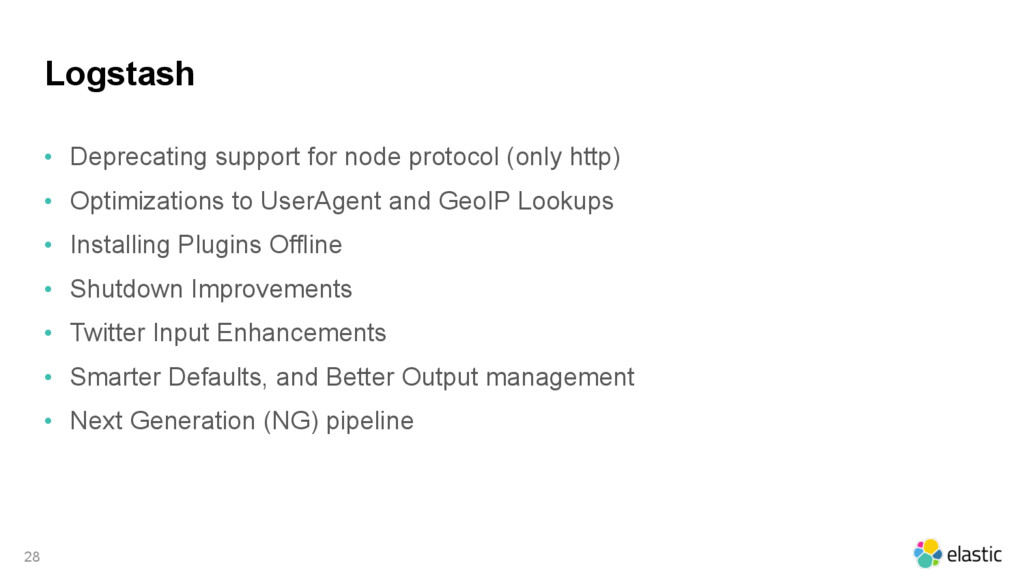
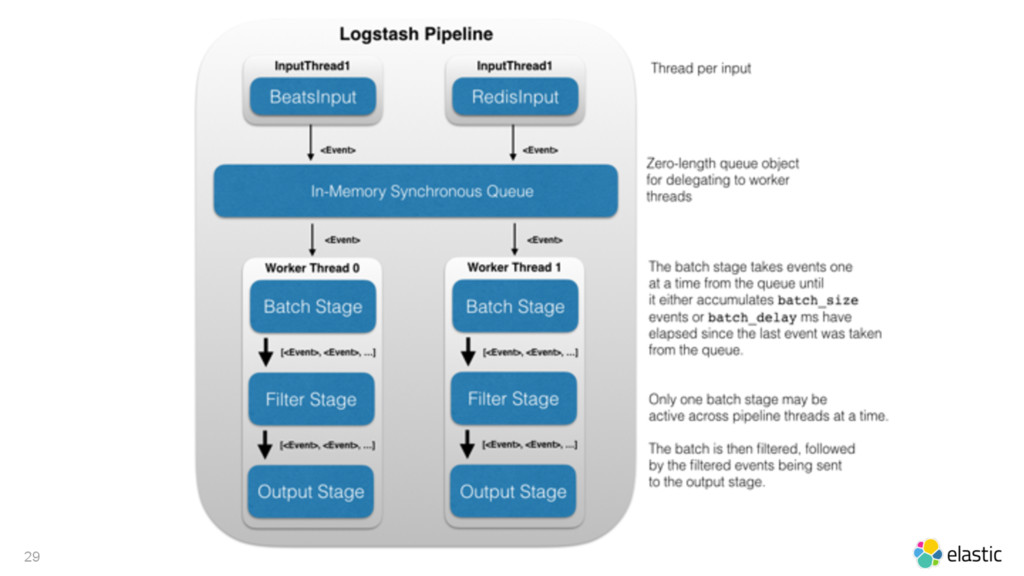
• Logstash: next generation pipeline

• Kibana: dark theme, plugins --- marvel (agent/ui), sense, timelion

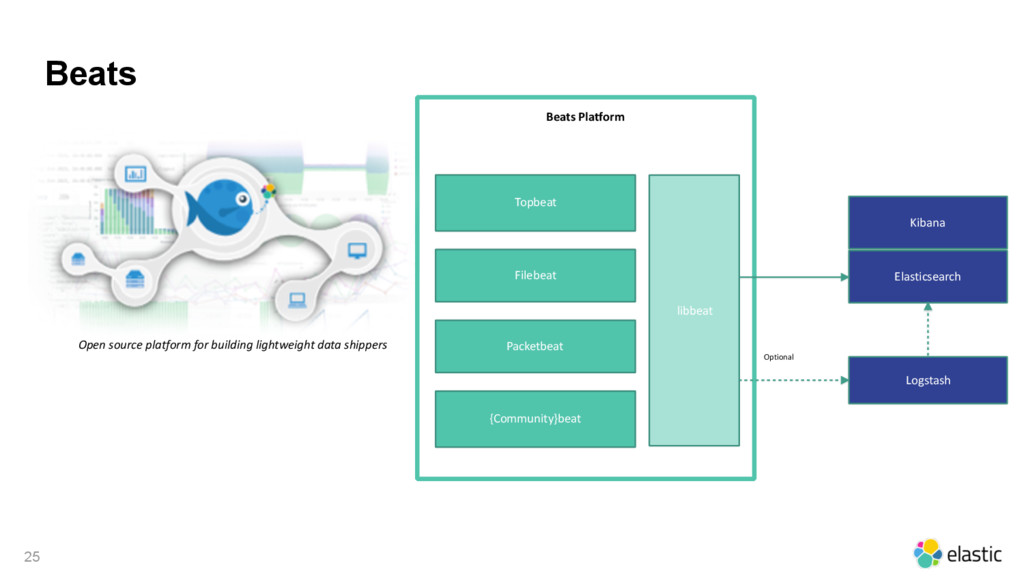
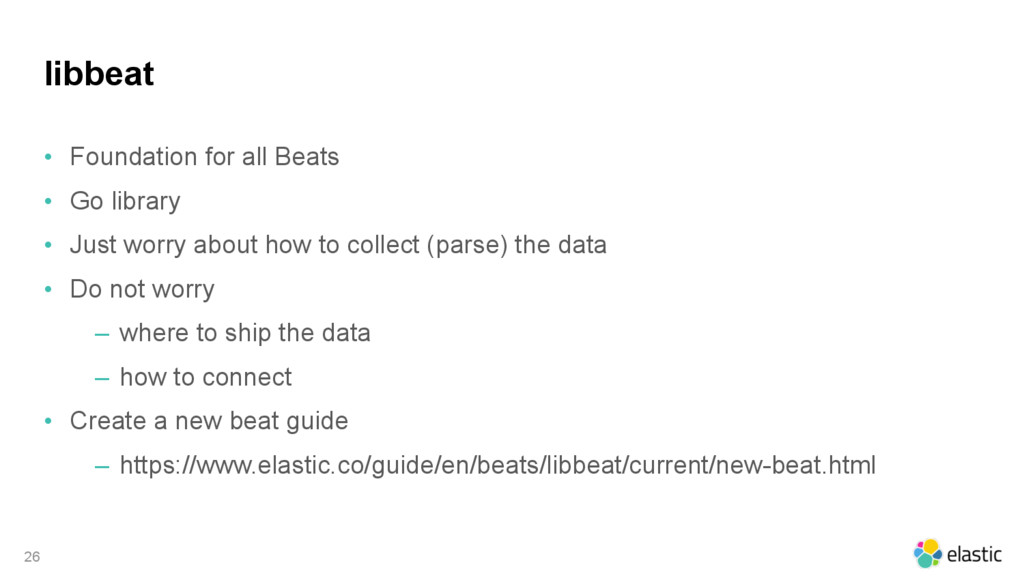
• Beats: lightweight shipper, {Top/File/Packet/Community}beat

• Elastic Cloud: easy updates, back up every 30 minutes, AWS integration

Avatar for Pablo Musa

Pablo Musa

April 06, 2016
Tweet

More Decks by Pablo Musa

Other Decks in Technology

Transcript

  1. Elastic Stack 2 Elastic Cloud Security Monitoring Alerting Graph X-Pack

    Kibana User Interface Elasticsearch Logstash Beats Store, Index, and Analyze Ingest
  2. 3

  3. Query DSL Update and Optimization • Elasticsearch 2.x intelligently executes

    queries • no need to write queries "the best way" • Examples: • For "conjunction" queries (2 or more"match" queries in a must section) • Sub-queries are sorted by term frequency • Executed lowest to highest by term frequency • For complex queries ("match_phrase" for instance) a 2-Phase execution strategy is used • Approximation Phase • Verification Phase 4
  4. Query DSL Update and Optimization • The "Query Cache" will

    cache filter parts if they appear enough times ‒ Complex queries - 2 executions in the last 256 queries ‒ Typical queries - 5 executions in the last 256 queries ‒ Simple queries - 20 executions in the last 256 queries • No need to manage this with _cache or _cache_key any longer - deprecated features from 1.x • Only big segments get caches • Segments that contain 3% of index documents or 10,000 documents 5
  5. Doc Values and Field Data • Inverted Index ‒ For

    a "value", which "docs" contain it? • What if we need the opposite: ‒ For a "doc", what is a particular field's "value"? • Why do we need this? ‒ Sorting ‒ Aggregations ‒ Some Scripting • Two approaches for storing and accessing this structure... 6
  6. Doc Values • Build columnar style data structure on disk

    • We call these "doc values" (Lucene construct) • Created at indexing time, stored as part of the segment • Read like other pieces of the Lucene index ‒ Don't take up heap space ‒ Uses file system cache • Default for not_analyzed string and numeric fields in 2.0+ 7
  7. Field Data • Data structure built on the fly at

    query time • Held PER SEGMENT in the JVM memory • "15-20% faster", but comes at the cost of large heap usage (*GC) • To intentionally enable field data on 2.0+ ("not advised") 8 "properties" : { "tag": { "type": "string", "index" : "not_analyzed", "doc_values": false } }
  8. Significant Terms (find the “uncommonly common”) • Terms Aggregation is

    about popularity. • Significant Terms Aggregation is about significance. • Create a foreground dataset • See which terms are “significant” to it VS the background dataset 11
  9. Sampler Aggregation • Limit the amount of documents a sub

    aggregation will operate on • Reduce noise • Get better and faster results 12
  10. Pipeline Aggregations • After you've aggregated data, how can you

    aggregate the results? • Elasticsearch 2.0 introduced "Pipeline Aggregations" • Many type of aggregations such as moving averages, derivatives, bucket selectors and more! 13
  11. Pipeline Aggregations • Simple to use • Specify a type

    of Pipeline Aggregation • Specify a "bucket_path" • Optionally, use bucket_selectors to filter out buckets you don't want to pipeline aggregate 14 GET stack/question/_search { "size": 0, "aggs": { "daily_comments": { "date_histogram": { "field": "creation_date", "interval": "hour" }, "aggs" : { "comment_counts" : { "sum" : { "field" : "comment_count" } }, "comments_moving_avg" : { "moving_avg": { "buckets_path": "comment_counts", "model": "simple" } } } } }
  12. Pipeline Aggregations 15 • Chart with simple model, 30m intervals

    and a window of 50: Blue Line: Count Red Line: Moving Average
  13. Pipeline Aggregations 16 • Chart with linear model, 30m intervals

    and a window of 50: Blue Line: Count Red Line: Moving Average
  14. Pipeline Aggregations 17 • Chart with holt-winters model, 30m intervals

    and a window of 100, period of 48 and prediction of 200: Blue Line: Count Red Line: Moving Average
  15. Query Profiler • Attempts to time execution of query components

    • Best-effort profiling • Expensive! Verbose! 18 “SQL Explain for ES” https://www.elastic.co/guide/en/elasticsearch/reference/current/search-profile.html
  16. 20

  17. Kibana • Dark Theme • Legend Colors • Shield Integration

    • Plugins • marvel (agent/ui) • sense • timelion • ... 21
  18. 22

  19. Found -> Cloud • Easy updates • Back up every

    30 minutes • AWS integration 23
  20. 24

  21. Beats 25 Topbeat Filebeat Packetbeat {Community}beat libbeat Beats Platform Elasticsearch

    Kibana Logstash Optional Open source platform for building lightweight data shippers
  22. libbeat • Foundation for all Beats • Go library •

    Just worry about how to collect (parse) the data • Do not worry ‒ where to ship the data ‒ how to connect • Create a new beat guide ‒ https://www.elastic.co/guide/en/beats/libbeat/current/new-beat.html 26
  23. 27

  24. Logstash • Deprecating support for node protocol (only http) •

    Optimizations to UserAgent and GeoIP Lookups • Installing Plugins Offline • Shutdown Improvements • Twitter Input Enhancements • Smarter Defaults, and Better Output management • Next Generation (NG) pipeline 28
  25. 29

  26. 30

  27. X-Pack • A new product that extends the Elastic Stack

    with features: • Security (Shield) - Protect your data across the Elastic Stack. • Alerting (Watcher) - Get notifications about changes in your data. • Monitoring (Marvel) - Keep a pulse on the health of your stack. • Graph - Query and visualize meaningful relationships in your data. • Reporting - Generate, schedule, and email PDF reports. 31