Upgrade to Pro — share decks privately, control downloads, hide ads and more …

Profiling Memory in Lua

Pablo Musa
October 16, 2015

Profiling Memory in Lua

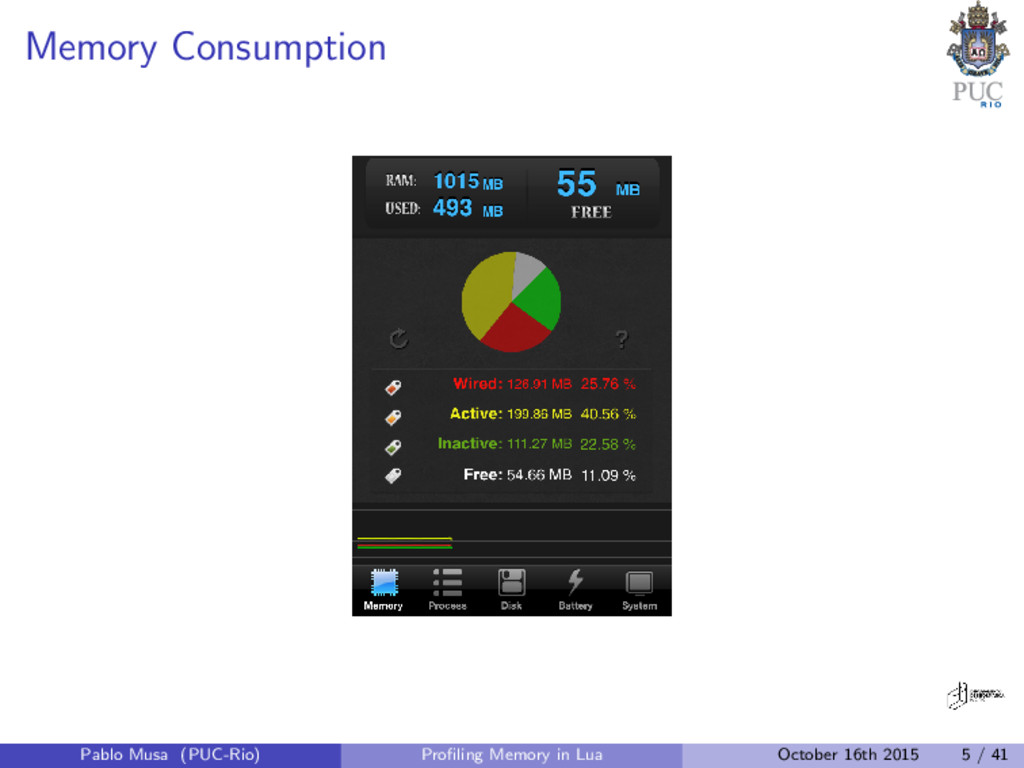
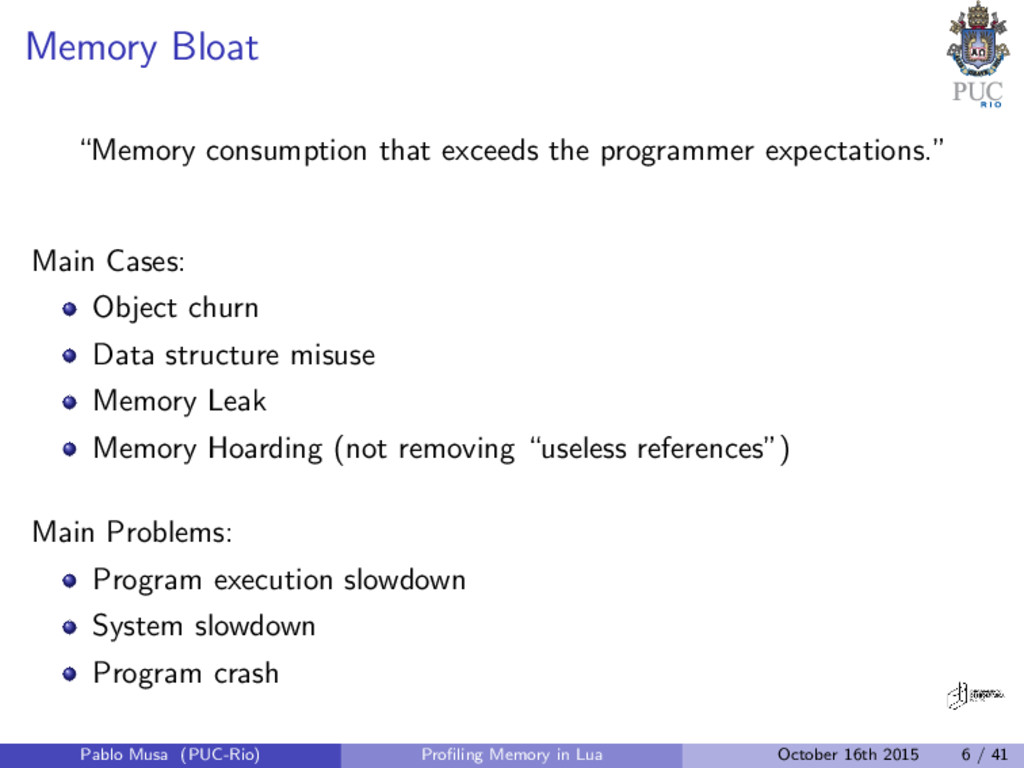
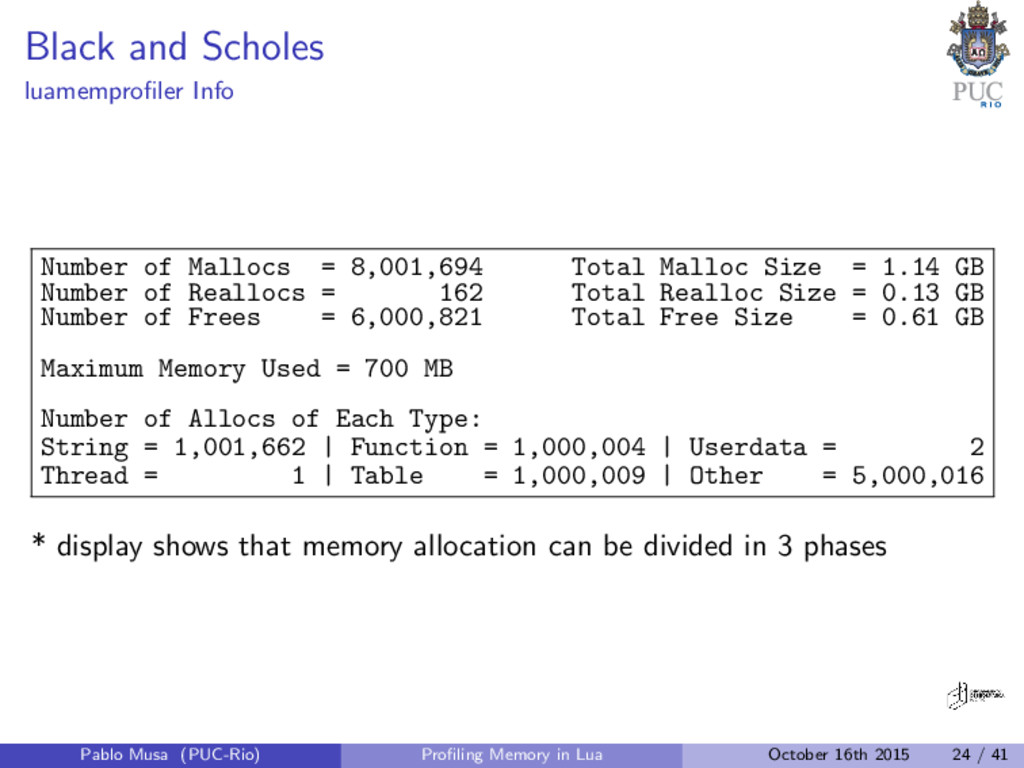
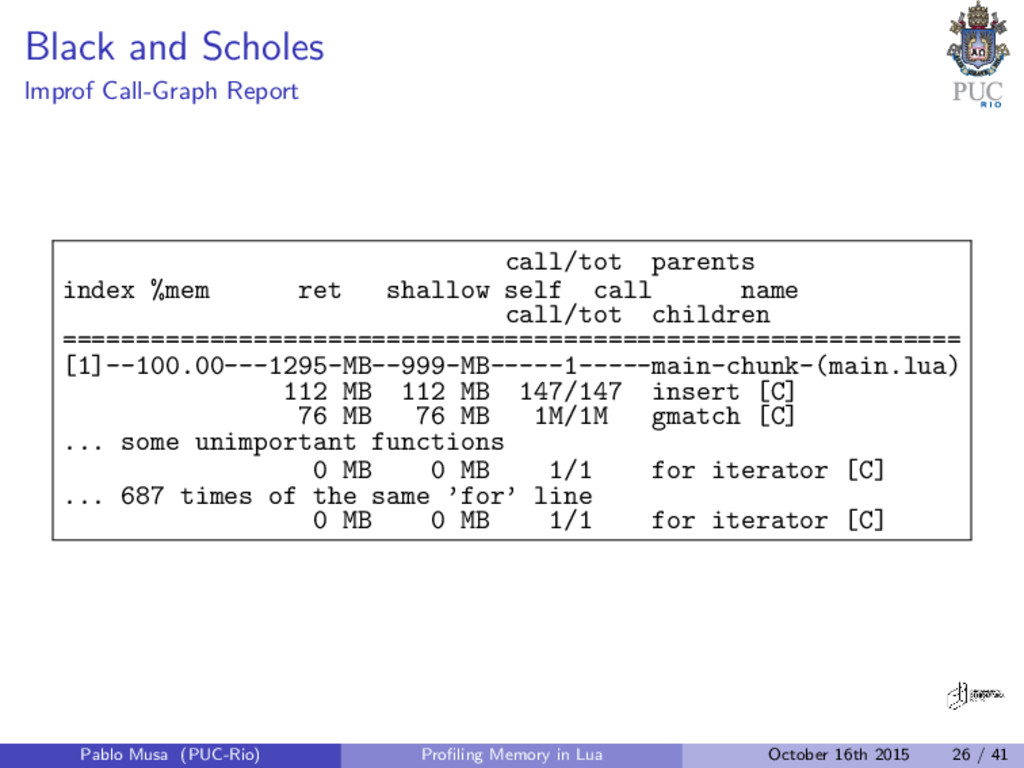
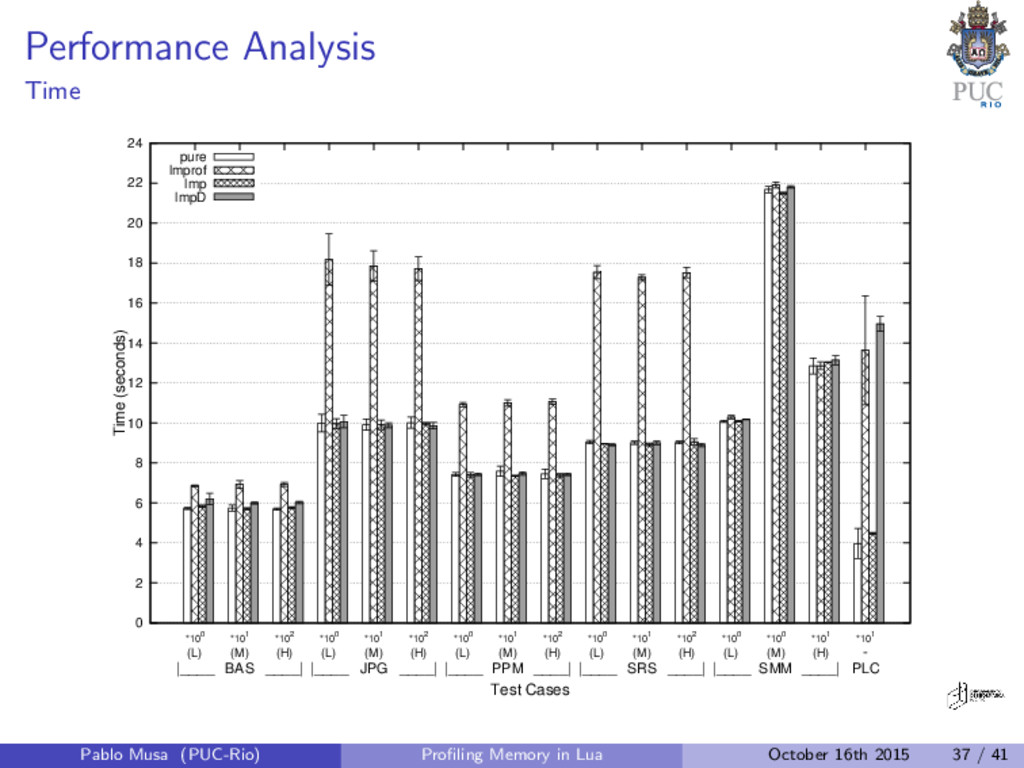
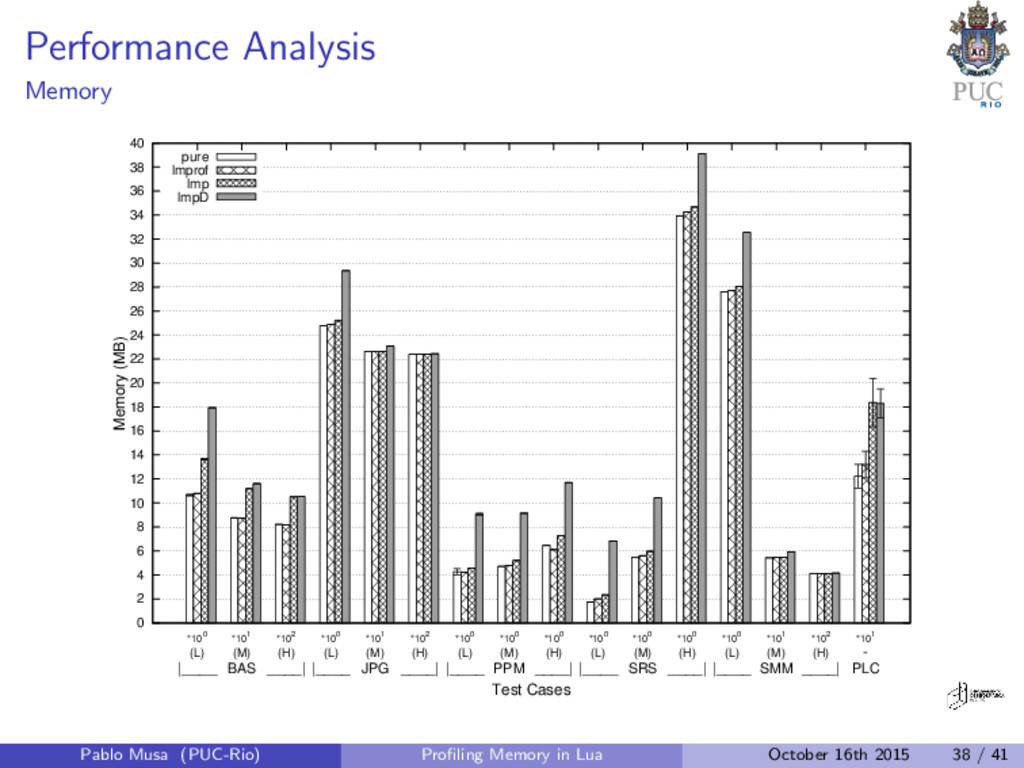
Memory bloat is a software problem that happens when the memory consumption of a program exceeds the programmer's expectations. In many cases, memory bloat hurts performance or even crashes applications. In this talk we present two tools created to help Lua programmers identify memory consumption problems. The first memory profiler we present is luamemprofiler, which was developed to explore three techniques: real-time visualization, type/class data categorization, and ongoing interaction. The second memory profiler we present is lmprof, which was created to explore gprof’s largely used model which summarizes, after the main program execution, events based on function calls.

Pablo Musa

October 16, 2015
Tweet

More Decks by Pablo Musa

Other Decks in Programming

Transcript

  1. Profiling Memory in Lua
    Lua Workshop 2015
    Pablo Musa
    PUC-Rio
    October 16th 2015
    Pablo Musa (PUC-Rio) Profiling Memory in Lua October 16th 2015 1 / 41

    View Slide

  2. About Me
    ?
    Pablo Musa (PUC-Rio) Profiling Memory in Lua October 16th 2015 2 / 41

    View Slide

  3. About This Talk
    MSc
    [email protected]!$#[email protected]#@ [email protected]#[email protected]
    Garbage Collection - Memory Leak - Java
    How can we help users identify and debug memory issues?
    Pablo Musa (PUC-Rio) Profiling Memory in Lua October 16th 2015 3 / 41

    View Slide

  4. Agenda
    Problem
    Existing Tools
    Proposed Tools
    Evaluation
    Pablo Musa (PUC-Rio) Profiling Memory in Lua October 16th 2015 4 / 41

    View Slide

  5. Memory Consumption
    Pablo Musa (PUC-Rio) Profiling Memory in Lua October 16th 2015 5 / 41

    View Slide

  6. Memory Bloat
    “Memory consumption that exceeds the programmer expectations.”
    Main Cases:
    Object churn
    Data structure misuse
    Memory Leak
    Memory Hoarding (not removing “useless references”)
    Main Problems:
    Program execution slowdown
    System slowdown
    Program crash
    Pablo Musa (PUC-Rio) Profiling Memory in Lua October 16th 2015 6 / 41

    View Slide

  7. Existing Tools
    Lua Memory Profiler
    Lua 5.0
    Basic features (implemented in 5.1)
    Recompile the interpreter
    ProFi
    2012
    Execution time focus
    One memory function (manually called)
    Pablo Musa (PUC-Rio) Profiling Memory in Lua October 16th 2015 7 / 41

    View Slide

  8. Existing Tools
    Luatraverse
    2006 and last ‘update’ 2010
    Traverses references to live objects applying a given function
    countreferences and findallpaths
    microscope
    2013 and last update 8 months ago
    Dump Lua values into a file using GraphViz format
    Generate a graphical visualization of the graph
    Pablo Musa (PUC-Rio) Profiling Memory in Lua October 16th 2015 8 / 41

    View Slide

  9. Proposed Tools
    luamemprofiler (https://github.com/pmusa/luamemprofiler)
    lmprof (https://github.com/pmusa/lmprof)
    Guidelines:
    Easy to integrate into existing programs
    Not impose too much overhead
    Provide readable reports for a regular programmer
    Pablo Musa (PUC-Rio) Profiling Memory in Lua October 16th 2015 9 / 41

    View Slide

  10. luamemprofiler
    Motivation
    “Real time” vizualization
    Type/class data categorization
    Ongoing interaction
    Pablo Musa (PUC-Rio) Profiling Memory in Lua October 16th 2015 10 / 41

    View Slide

  11. luamemprofiler
    Interface
    Pablo Musa (PUC-Rio) Profiling Memory in Lua October 16th 2015 11 / 41

    View Slide

  12. luamemprofiler
    Final Report
    Number of Mallocs = 192 Total Malloc Size = 17.8 Kb
    Number of Reallocs = 302 Total Realloc Size = 400.0 Mb
    Number of Frees = 25 Total Free Size = 10.5 Kb
    Number of Mallocs of Each Type:
    String = 60 | Function = 11 | Userdata = 0
    Thread = 0 | Table = 20 | Other = 101
    Maximum Memory Used = 400.0 Mb
    Pablo Musa (PUC-Rio) Profiling Memory in Lua October 16th 2015 12 / 41

    View Slide

  13. luamemprofiler
    Implementation
    lua setallocf
    Counters
    Hash table + Auxiliary Lists
    Pablo Musa (PUC-Rio) Profiling Memory in Lua October 16th 2015 13 / 41

    View Slide

  14. luamemprofiler
    Problems
    Finalizer
    Categorization
    Display
    Pablo Musa (PUC-Rio) Profiling Memory in Lua October 16th 2015 14 / 41

    View Slide

  15. lmprof
    Motivation
    gprof
    “Function profiler”
    After execution report (two phase)
    Pablo Musa (PUC-Rio) Profiling Memory in Lua October 16th 2015 15 / 41

    View Slide

  16. lmprof
    Flat Report
    ===== Showing 3 of 10 functions that allocated memory ====
    % shallow retained shallow retained
    mem mem mem calls mem/call mem/call name
    97.99 392.0 MB 392.0 MB 12 32.67 MB 32.7 MB nv*
    2.00 8.0 MB 8.0 MB 1 8.00 MB 8.0 MB RV*
    0.01 0.0 MB 0.0 MB 1 0.02 MB 0.0 MB df*
    newvec (SM.lua:29) | RandomVector (SM.lua:80) | dofile [C]
    Pablo Musa (PUC-Rio) Profiling Memory in Lua October 16th 2015 16 / 41

    View Slide

  17. lmprof
    Call-Graph Report
    index %mem retained shallow call(rec) name index
    call/total children
    ==============================================================
    [1]----100.00--160.0-MB----0.0-MB------1---------f1-------[1]
    130.0 MB 80.0 MB 2/2 f2 [2]
    30.0 MB 10.0 MB 1/1 f3 [4]
    ==============================================================
    130.0 MB 130.0 MB 2/2 f1 [1]
    [2]-----81.25--130.0-MB---80.0-MB------2---------f2-------[2]
    50.0 MB 50.0 MB 5/12 f4 [3]
    ==============================================================
    50.0 MB 50.0 MB 5/12 f2 [2]
    20.0 MB 20.0 MB 2/12 f3 [4]
    [3]-----43.75---70.0-MB---70.0-MB-----12(5)------f4-------[3]
    ==============================================================
    30.0 MB 10.0 MB 1/1 f1 [1]
    [4]-----18.75---30.0-MB---10.0-MB------1---------f3-------[4]
    20.0 MB 20.0 MB 2/12 f4 [3]
    ==============================================================
    Pablo Musa (PUC-Rio) Profiling Memory in Lua October 16th 2015 17 / 41

    View Slide

  18. lmprof
    Implementation
    lua setallocf
    lua sethook
    Smart Stack
    Hash table with caller/callee pair
    Pablo Musa (PUC-Rio) Profiling Memory in Lua October 16th 2015 18 / 41

    View Slide

  19. lmprof
    Problems
    Finalizer
    All vs. Memory-Alloc functions
    Tail calls
    Cicles
    Pablo Musa (PUC-Rio) Profiling Memory in Lua October 16th 2015 19 / 41

    View Slide

  20. Evaluation
    Ease of Use
    Report Usefulness
    Performance Analysis
    Pablo Musa (PUC-Rio) Profiling Memory in Lua October 16th 2015 20 / 41

    View Slide

  21. Evaluation
    Ease of Use
    Both tools use the same technique
    Simple
    local lmp = require"luamemprofiler"
    lmp.start()
    -- original script code ...
    lmp.stop()
    luamemprofiler: optional parameter to enable the display
    Pablo Musa (PUC-Rio) Profiling Memory in Lua October 16th 2015 21 / 41

    View Slide

  22. Evaluation
    Report Usefulness
    Extract information with superficial application knowledge
    Used 2 programs:
    Black and Scholes — financial application that precify portfolio options
    CAPTCHA JPEG — an application to filter CAPTCHA images in the
    JPEG format to make it easier to perform automatic optical character
    recognition (OCR)
    Pablo Musa (PUC-Rio) Profiling Memory in Lua October 16th 2015 22 / 41

    View Slide

  23. Black and Scholes
    Previous Knowledge
    Input: 1 million line file with 9 numeric columns
    Activity: calculate different values
    Pablo Musa (PUC-Rio) Profiling Memory in Lua October 16th 2015 23 / 41

    View Slide

  24. Black and Scholes
    luamemprofiler Info
    Number of Mallocs = 8,001,694 Total Malloc Size = 1.14 GB
    Number of Reallocs = 162 Total Realloc Size = 0.13 GB
    Number of Frees = 6,000,821 Total Free Size = 0.61 GB
    Maximum Memory Used = 700 MB
    Number of Allocs of Each Type:
    String = 1,001,662 | Function = 1,000,004 | Userdata = 2
    Thread = 1 | Table = 1,000,009 | Other = 5,000,016
    * display shows that memory allocation can be divided in 3 phases
    Pablo Musa (PUC-Rio) Profiling Memory in Lua October 16th 2015 24 / 41

    View Slide

  25. Black and Scholes
    lmprof Flat Report
    ===== Showing 5 of 699 functions that allocated memory =====
    % shallow retained
    mem mem mem calls name
    77.20 999 MB 1295 MB 1 main chunk (main.lua)
    8.65 112 MB 112 MB 147 insert [C]
    7.01 91 MB 91 MB 1,000,001 for iterator [C]
    5.89 76 MB 76 MB 1,000,000 gmatch [C]
    1.24 16 MB 16 MB 1 ? (main.lua:194)
    Pablo Musa (PUC-Rio) Profiling Memory in Lua October 16th 2015 25 / 41

    View Slide

  26. Black and Scholes
    lmprof Call-Graph Report
    call/tot parents
    index %mem ret shallow self call name
    call/tot children
    =============================================================
    [1]--100.00---1295-MB--999-MB-----1-----main-chunk-(main.lua)
    112 MB 112 MB 147/147 insert [C]
    76 MB 76 MB 1M/1M gmatch [C]
    ... some unimportant functions
    0 MB 0 MB 1/1 for iterator [C]
    ... 687 times of the same ’for’ line
    0 MB 0 MB 1/1 for iterator [C]
    Pablo Musa (PUC-Rio) Profiling Memory in Lua October 16th 2015 26 / 41

    View Slide

  27. Black and Scholes
    Original Code
    -- read options data from input file, starting at line 2
    datatb = {}
    fnametb = { "s", "strike", "r", "divq", "v", "t",
    "optiontype", "divs", "dgrefval" }
    for line in infh:lines() do
    optiontb = {}
    fnum = 1
    for field in string.gmatch( line, "[^%s]+" ) do
    optiontb[fnametb[fnum]] = field
    fnum = fnum + 1
    end
    table.insert( datatb, optiontb )
    end
    ...
    -- divide option fields into records
    otype = {}; sptprice = {}; strike = {}; rate = {}; volatility = {}; otime = {}
    for i = 1, numoptions, 1 do
    if ( datatb[i].optiontype == ’P’ ) then table.insert( otype, 1 )
    else table.insert( otype, 0 ) end
    table.insert( sptprice, datatb[i].s );table.insert( strike, datatb[i].strike );
    table.insert( rate, datatb[i].r );table.insert( volatility, datatb[i].v );
    table.insert( otime, datatb[i].t )
    end
    Pablo Musa (PUC-Rio) Profiling Memory in Lua October 16th 2015 27 / 41

    View Slide

  28. Black and Scholes
    Modified Code
    -- read options data from input file, starting at line 2
    fnametb = { "s", "strike", "r", "divq", "v", "t",
    "optiontype", "divs", "dgrefval" }
    -- divide option fields into records
    otype = {}; sptprice = {}; strike = {}; rate = {}; volatility = {}; otime = {}
    optiontb = {}
    for line in infh:lines() do
    fnum = 1
    for field in string.gmatch( line, "[^%s]+" ) do
    optiontb[fnametb[fnum]] = field
    fnum = fnum + 1
    end
    if ( optiontb.optiontype == ’P’ ) then table.insert( otype, 1 )
    else table.insert( otype, 0 ) end
    table.insert( sptprice, optiontb.s );table.insert( strike, optiontb.strike );
    table.insert( rate, optiontb.r );table.insert( volatility, optiontb.v );
    table.insert( otime, optiontb.t )
    end
    Pablo Musa (PUC-Rio) Profiling Memory in Lua October 16th 2015 28 / 41

    View Slide

  29. Black and Scholes
    luamemprofiler Report After Changes
    Number of Mallocs = 8,001,694 Total Malloc Size = 1,166 MB
    Number of Mallocs = 2,006,924 Total Malloc Size = 167 MB
    Number of Reallocs = 162 Total Realloc Size = 128 MB
    Number of Reallocs = 142 Total Realloc Size = 112 MB
    Number of Frees = 6,000,821 Total Free Size = 625 MB
    Number of Frees = 2,006,866 Total Free Size = 167 MB
    Maximum Memory Used = 700 MB
    Maximum Memory Used = 192 MB
    String = 1,001,662 | Function = 1,000,004 | Userdata = 2
    String = 1,006,888 | Function = 1,000,004 | Userdata = 2
    Table = 1,000,009 | Other = 5,000,016 | Thread = 1
    Table = 9 | Other = 20 | Thread = 1
    7x memory reduction (luamemprofiler) and 4x (/usr/bin/time)
    Pablo Musa (PUC-Rio) Profiling Memory in Lua October 16th 2015 29 / 41

    View Slide

  30. CAPTCHA JPG
    Previous Knowledge
    Input: 5000 images with 13kb each and 65 megabytes total
    Activity:
    Original image Grayscale Threshold 1
    Invert Threshold 2 Blur
    Pablo Musa (PUC-Rio) Profiling Memory in Lua October 16th 2015 30 / 41

    View Slide

  31. CAPTCHA JPG
    luamemprofiler Info
    Number of Mallocs = 76790 Total Malloc Size = 679.07 MB
    Number of Reallocs = 294 Total Realloc Size = 0.13 MB
    Number of Frees = 71534 Total Free Size = 678.86 MB
    Maximum Memory Used = 1.36 MB
    Number of Allocs of Each Type:
    String = 40970 | Function = 7 | Userdata = 35001
    Thread = 0 | Table = 10 | Other = 802
    * display shows that blocks are frequently created and garbage-collected.
    Pablo Musa (PUC-Rio) Profiling Memory in Lua October 16th 2015 31 / 41

    View Slide

  32. CAPTCHA JPG
    lmprof Flat Report
    ===== Showing 2 of 24 functions that allocated memory =====
    % shallow retained
    mem mem mem calls name
    78.93 536.6 MB 536.6 MB 25000 jpegStr [C]
    20.64 140.4 MB 140.4 MB 5000 read [C]
    0.17 1.1 MB 1.1 MB 25000 createFromJpegStr [C]
    Pablo Musa (PUC-Rio) Profiling Memory in Lua October 16th 2015 32 / 41

    View Slide

  33. CAPTCHA JPG
    lmprof Call-Graph Report
    call/tot parents
    index %mem ret self call name
    call/tot children
    =================================================================
    220.6 MB 220.6 MB 10K/25K threshold (...)
    152.9 MB 152.9 MB 5K/25K grayscale (...)
    117.9 MB 117.9 MB 5K/25K blur (...)
    45.2 MB 45.2 MB 5K/25K invert (...)
    [2]---78.93--536.6-MB--536.6-MB--25K-------jpegStr-[C]
    =================================================================
    140.6 MB 0.0 MB 5K/5K main chunk (...)
    [5]---20.68--140.6-MB----0.0-MB---5K-------load-(...)
    140.4 MB 140.4 MB 5K/5K read [C]
    0.3 MB 0.3 MB 5K/5K open [C]
    =================================================================
    0.5 MB 0.5 MB 10K/25K threshold (...)
    0.2 MB 0.2 MB 5K/25K grayscale (...)
    0.2 MB 0.2 MB 5K/25K blur (...)
    0.2 MB 0.2 MB 5K/25K invert (...)
    [9]----0.17----1.1-MB----1.1-MB--25K------createFromJpegStr-[C]
    Pablo Musa (PUC-Rio) Profiling Memory in Lua October 16th 2015 33 / 41

    View Slide

  34. CAPTCHA JPG
    Original Code
    local img, err = image.load( indir .. "/" .. f)
    ...
    img = image.grayscale( img )
    img = image.threshold( img, 220 )
    img = image.blur( img, 1 )
    img = image.threshold( img, 70 )
    img = image.invert( img )
    image.save( img, outdir .. "/" ..f)
    image.grayscale = function( img )
    local gdimg = gd.createFromJpegStr( img )
    ...
    return gdimg:jpegStr(100)
    end
    Pablo Musa (PUC-Rio) Profiling Memory in Lua October 16th 2015 34 / 41

    View Slide

  35. CAPTCHA JPG
    Modified Code
    local img, err = image.load( indir .. "/" .. f)
    ...
    image.grayscale( img )
    image.threshold( img, 220 )
    image.blur( img, 1 )
    image.threshold( img, 70 )
    image.invert( img )
    image.save( img, outdir .. "/" ..f)
    image.grayscale = function( img )
    ...
    end
    Pablo Musa (PUC-Rio) Profiling Memory in Lua October 16th 2015 35 / 41

    View Slide

  36. CAPTCHA JPG
    luamemprofiler Report After Changes
    Number of Mallocs = 76,790 Total Malloc Size = 679.07 MB
    Number of Mallocs = 30,673 Total Malloc Size = 141.47 MB
    Number of Reallocs = 294 Total Realloc Size = 0.13 MB
    Number of Reallocs = 170 Total Realloc Size = 0.13 MB
    Number of Frees = 71,534 Total Free Size = 678.86 MB
    Number of Frees = 25,417 Total Free Size = 141.25 MB
    Maximum Memory Used = 1.36 MB
    Maximum Memory Used = 1.29 MB
    String = 40,970 | Function = 7 | Userdata = 35,001
    String = 15,412 | Function = 7 | Userdata = 15,001
    Thread = 0 | Table = 10 | Other = 802
    Thread = 0 | Table = 10 | Other = 243
    5x memory reduction (luamemprofiler and /usr/bin/time)
    Pablo Musa (PUC-Rio) Profiling Memory in Lua October 16th 2015 36 / 41

    View Slide

  37. Performance Analysis
    Time
    0
    2
    4
    6
    8
    10
    12
    14
    16
    18
    20
    22
    24
    *100
    (L)
    |____
    *101
    (M)
    BAS
    *102
    (H)
    ____|
    *100
    (L)
    |____
    *101
    (M)
    JPG
    *102
    (H)
    ____|
    *100
    (L)
    |____
    *101
    (M)
    PPM
    *102
    (H)
    ____|
    *100
    (L)
    |____
    *101
    (M)
    SRS
    *102
    (H)
    ____|
    *100
    (L)
    |____
    *100
    (M)
    SMM
    *101
    (H)
    ____|
    *101
    -
    PLC
    Time (seconds)
    Test Cases
    pure
    lmprof
    lmp
    lmpD
    Pablo Musa (PUC-Rio) Profiling Memory in Lua October 16th 2015 37 / 41

    View Slide

  38. Performance Analysis
    Memory
    0
    2
    4
    6
    8
    10
    12
    14
    16
    18
    20
    22
    24
    26
    28
    30
    32
    34
    36
    38
    40
    *100
    (L)
    |____
    *101
    (M)
    BAS
    *102
    (H)
    ____|
    *100
    (L)
    |____
    *101
    (M)
    JPG
    *102
    (H)
    ____|
    *100
    (L)
    |____
    *100
    (M)
    PPM
    *100
    (H)
    ____|
    *100
    (L)
    |____
    *100
    (M)
    SRS
    *100
    (H)
    ____|
    *100
    (L)
    |____
    *101
    (M)
    SMM
    *102
    (H)
    ____|
    *101
    -
    PLC
    Memory (MB)
    Test Cases
    pure
    lmprof
    lmp
    lmpD
    Pablo Musa (PUC-Rio) Profiling Memory in Lua October 16th 2015 38 / 41

    View Slide

  39. Closing Remarks
    Lessons Learned
    Real-time was useful to understand allocation behavior
    Ongoing interaction and data categorization not useful
    Fixed display was a bad choice
    Function profiler is very useful for new programs
    Performance is ok for profilers
    Pablo Musa (PUC-Rio) Profiling Memory in Lua October 16th 2015 39 / 41

    View Slide

  40. Closing Remarks
    Future Work
    Wrapper to use tools from command line
    luamemprofiler: several interface improvements
    luamemprofiler: debugger integration
    lmprof: add information of ALL function calls
    lmprof: visual call-graph
    Pablo Musa (PUC-Rio) Profiling Memory in Lua October 16th 2015 40 / 41

    View Slide

  41. Thank you!
    Questions?
    Pablo Musa (PUC-Rio) Profiling Memory in Lua October 16th 2015 41 / 41

    View Slide