Upgrade to Pro — share decks privately, control downloads, hide ads and more …

Making man-made medicine price data more useful by JD Bothma

Pycon ZA
October 05, 2017

Making man-made medicine price data more useful by JD Bothma

A walk-through of how we practically clean and use a public dataset that is changing people's lives.

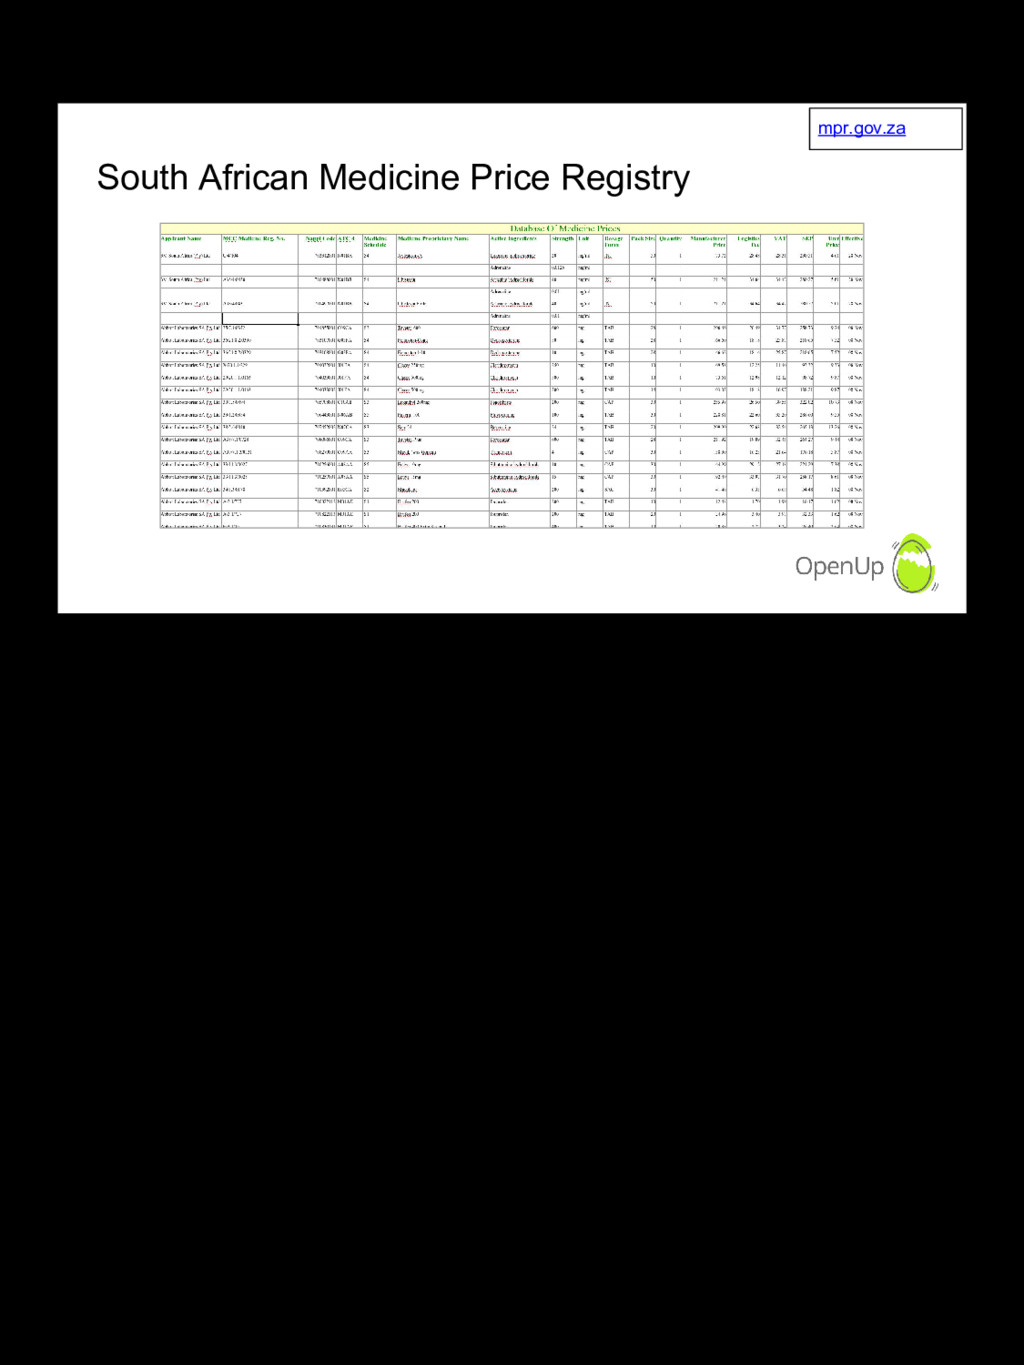
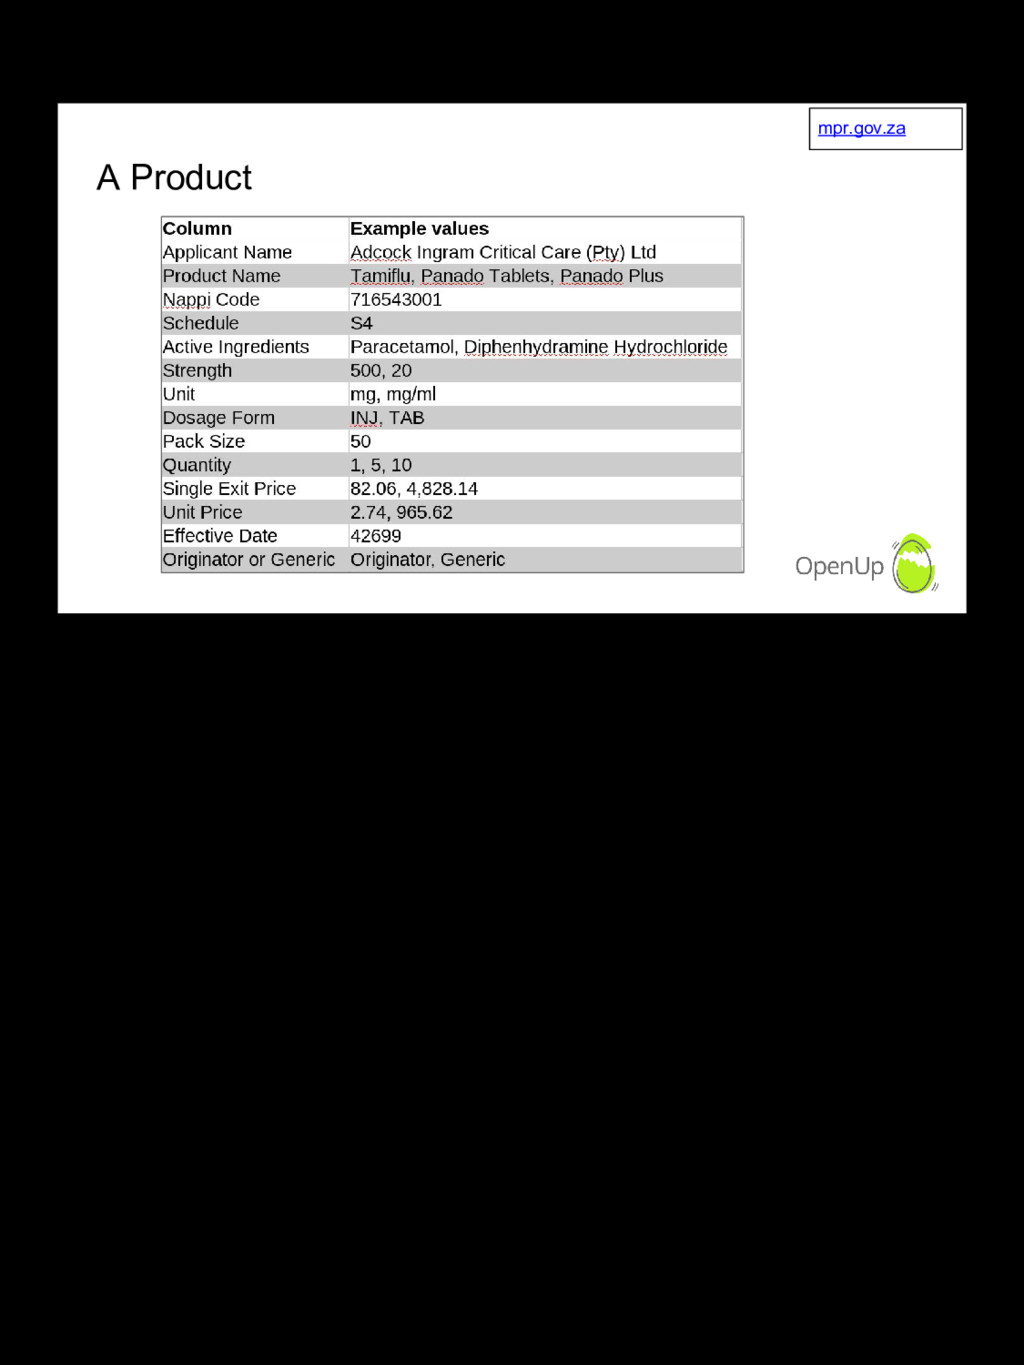
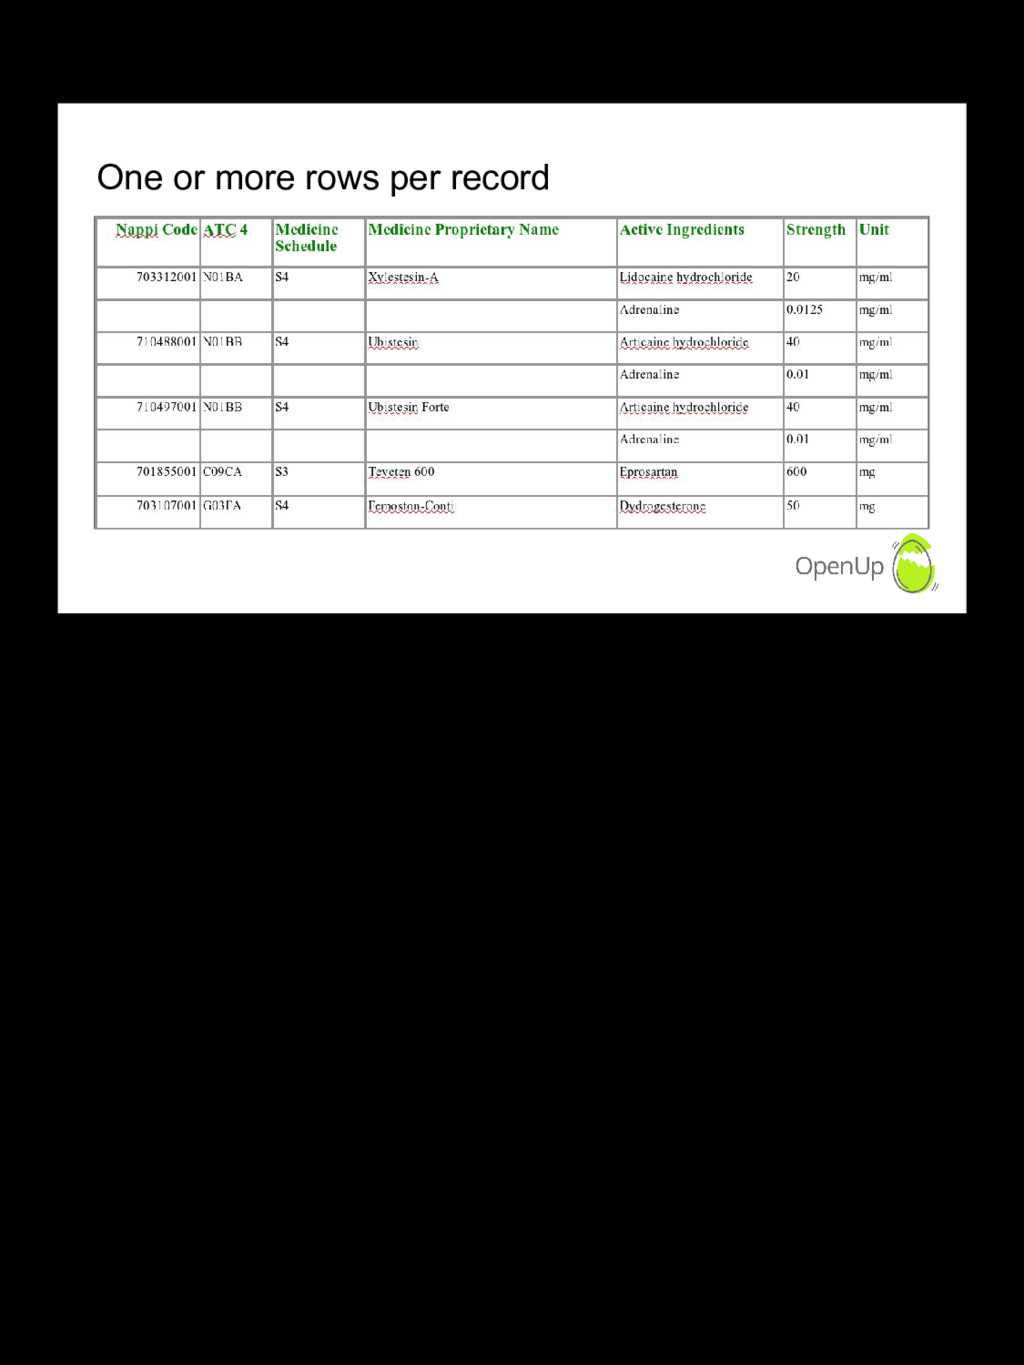
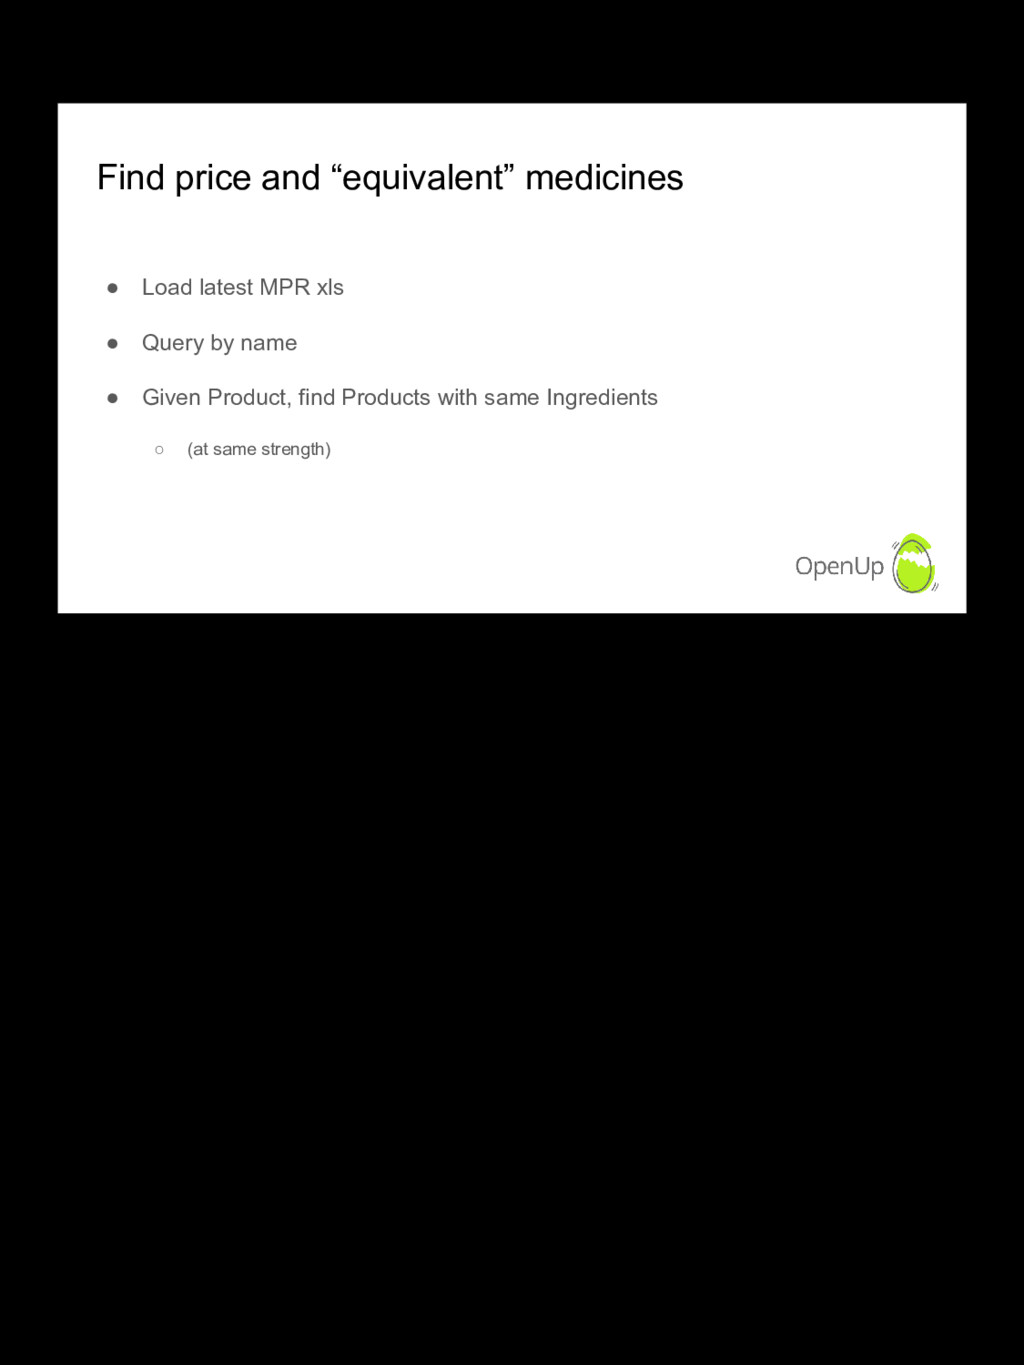
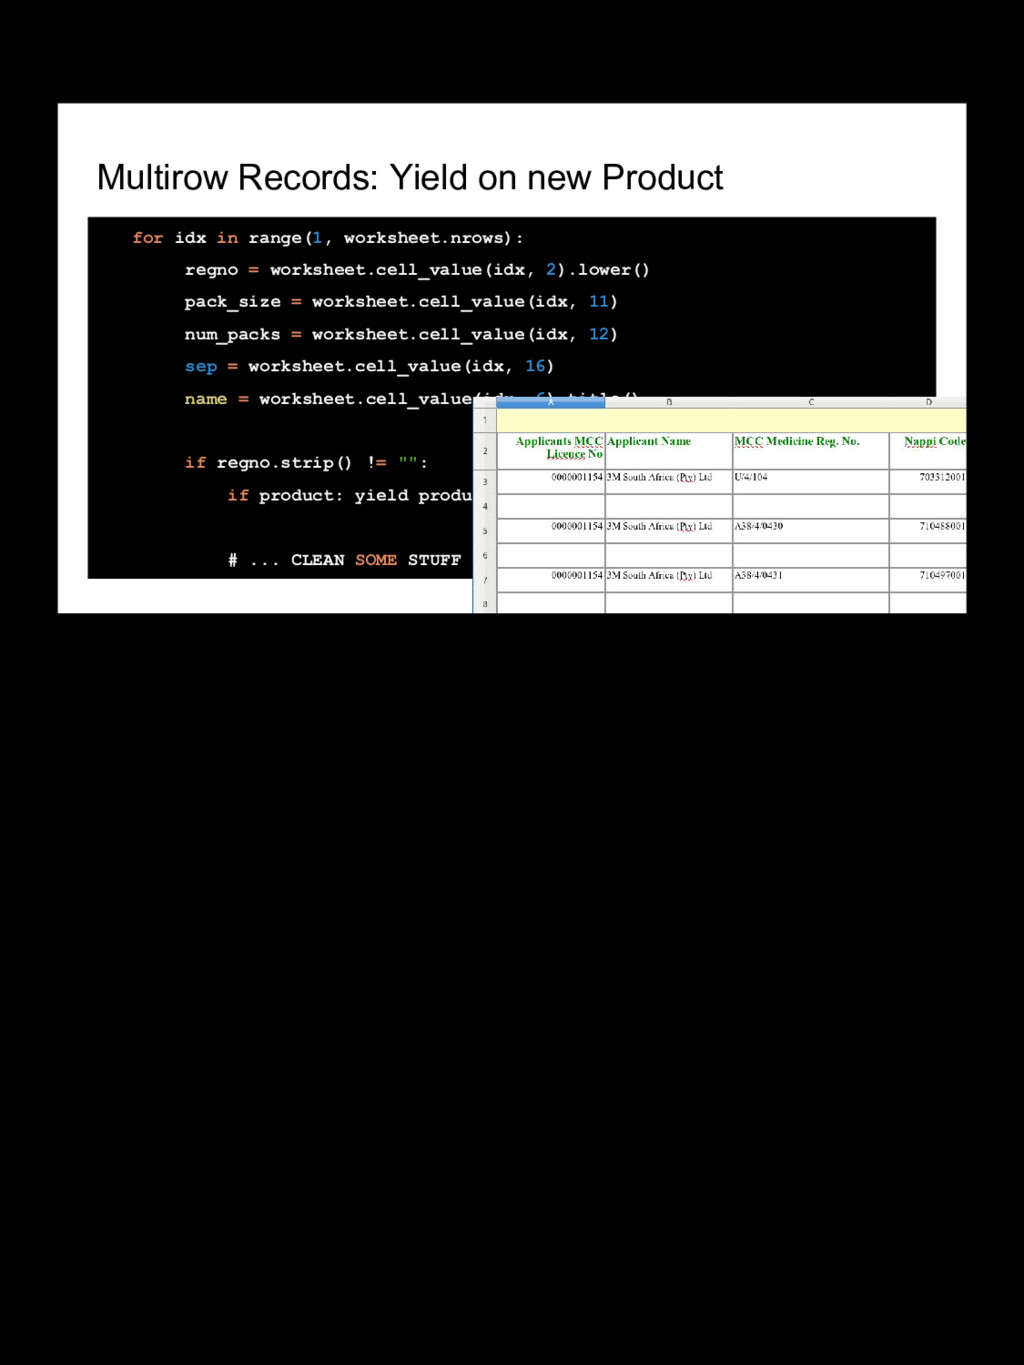
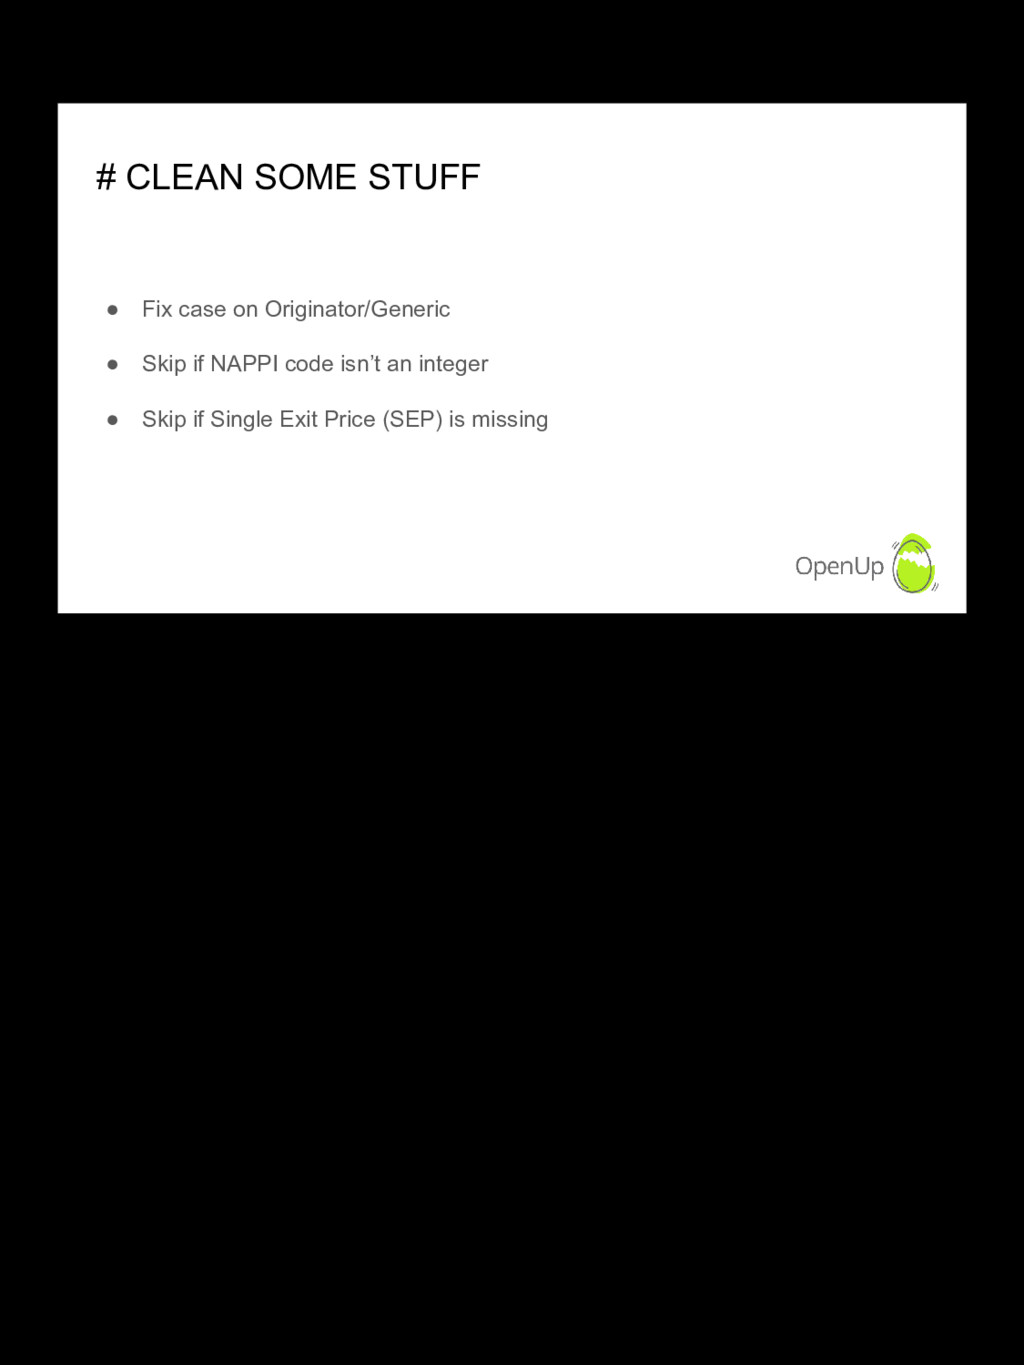
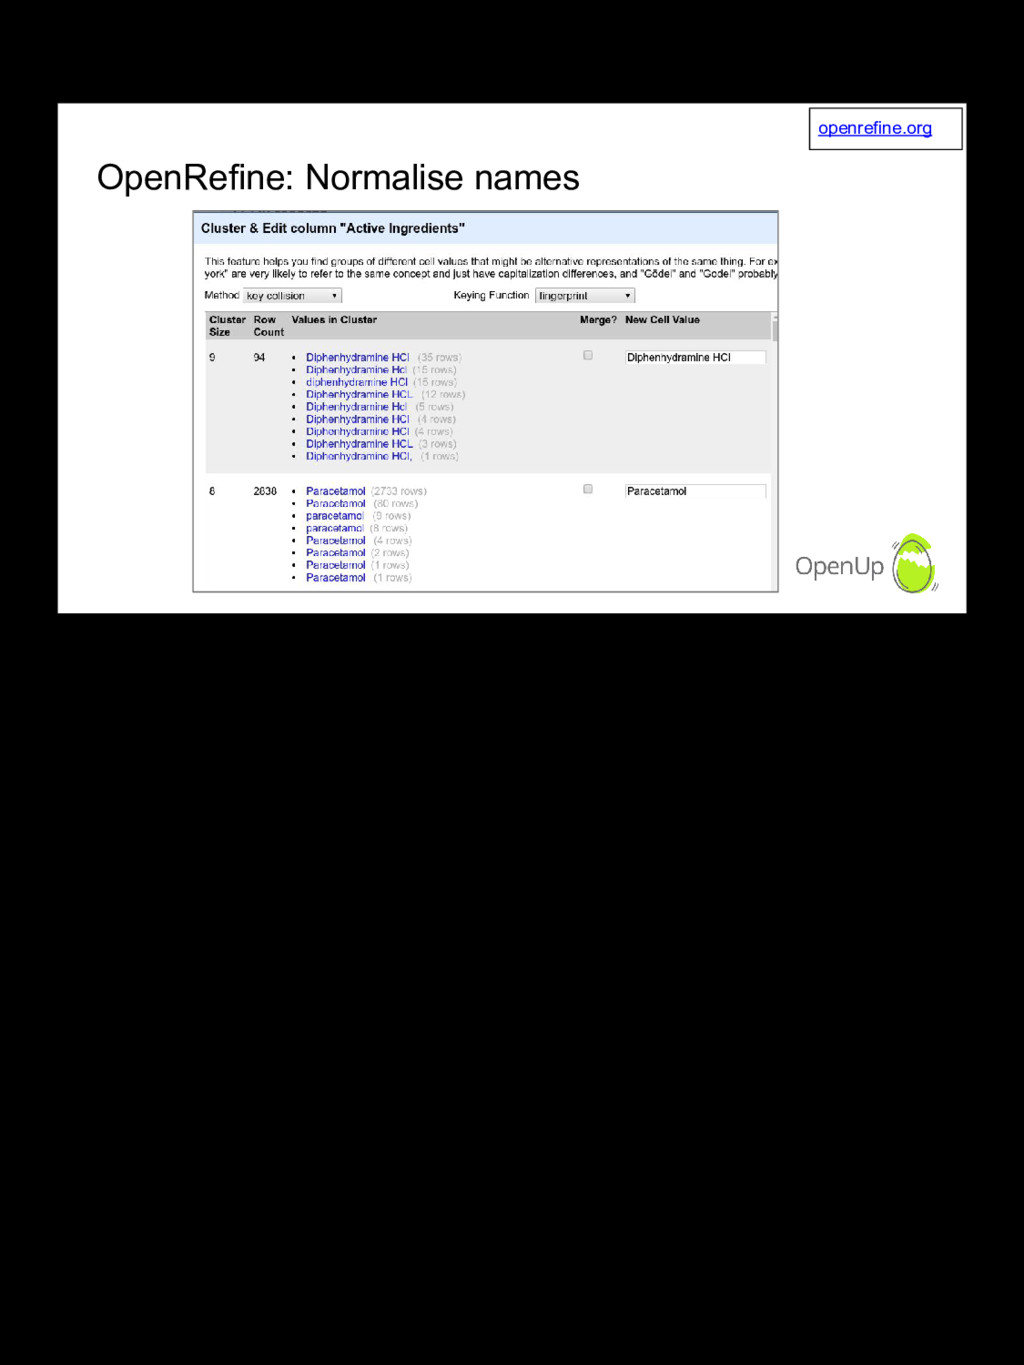
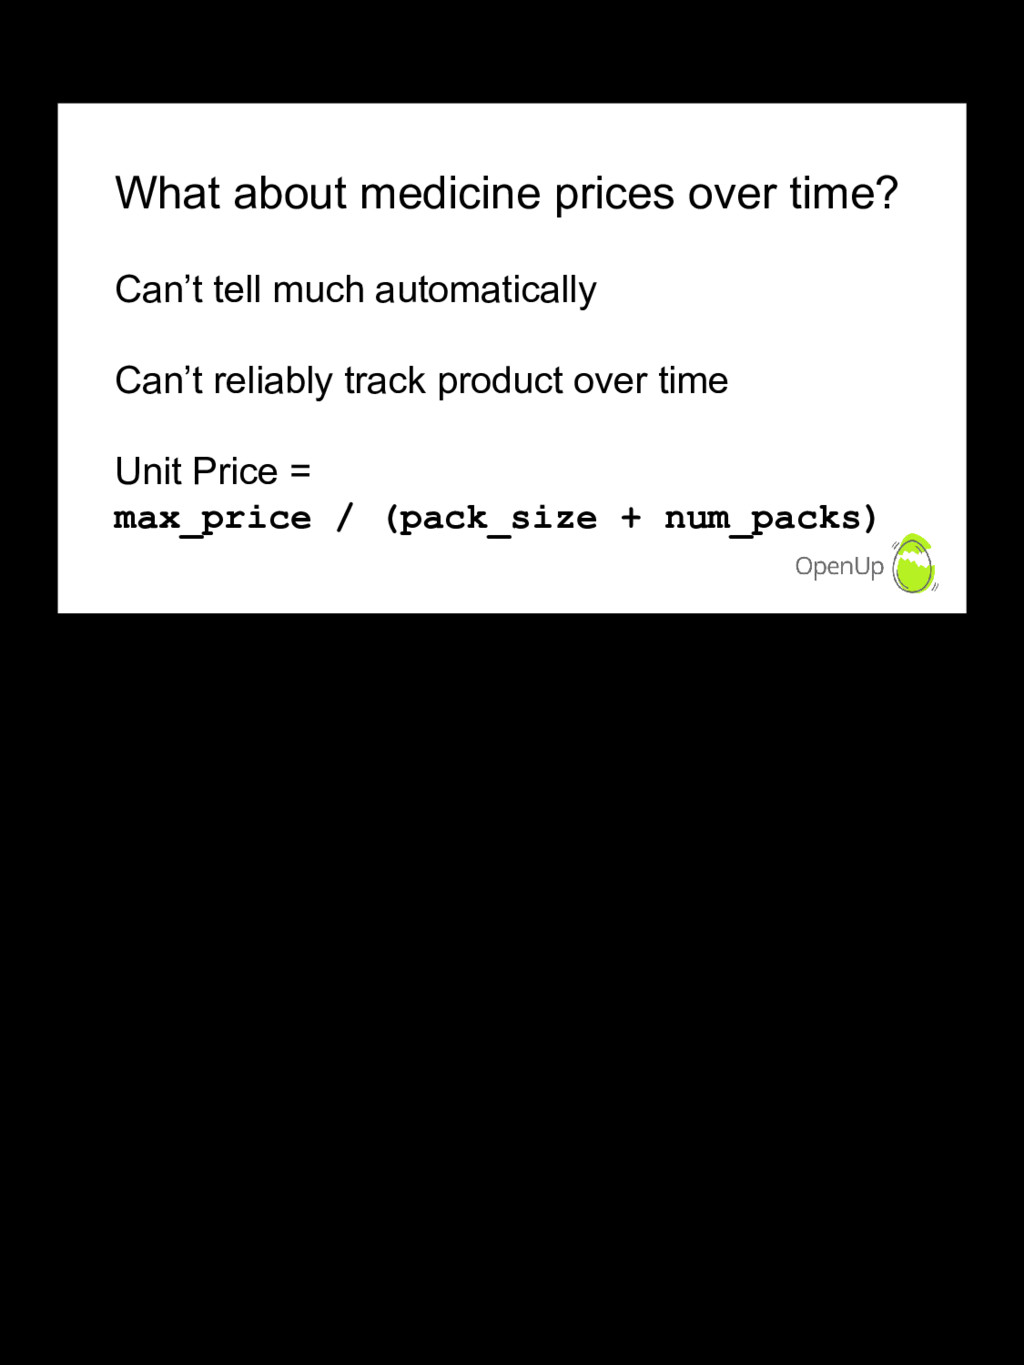
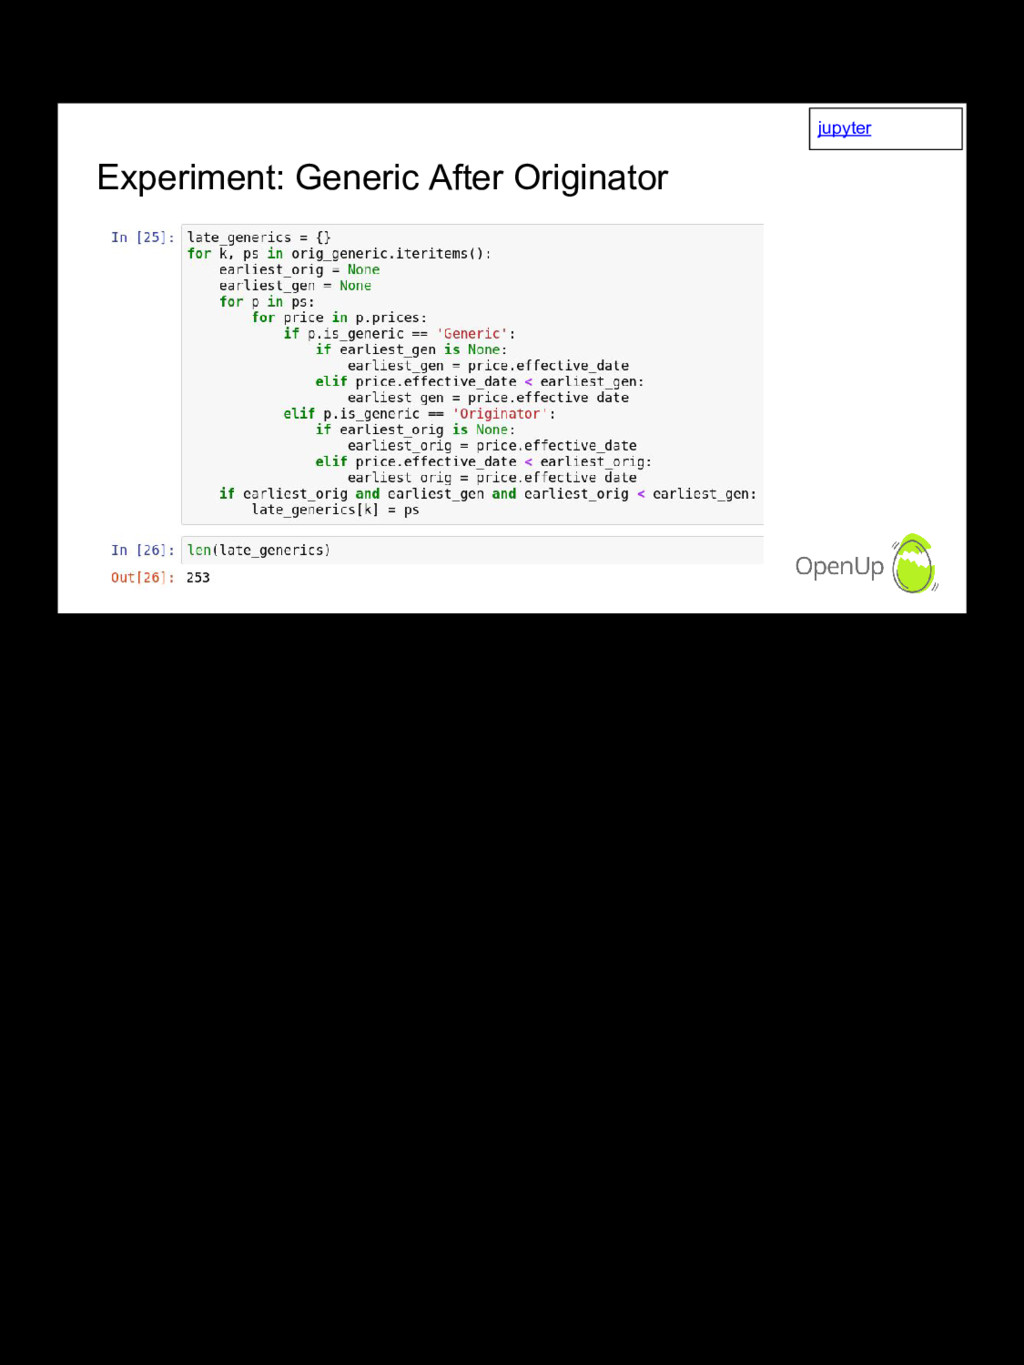
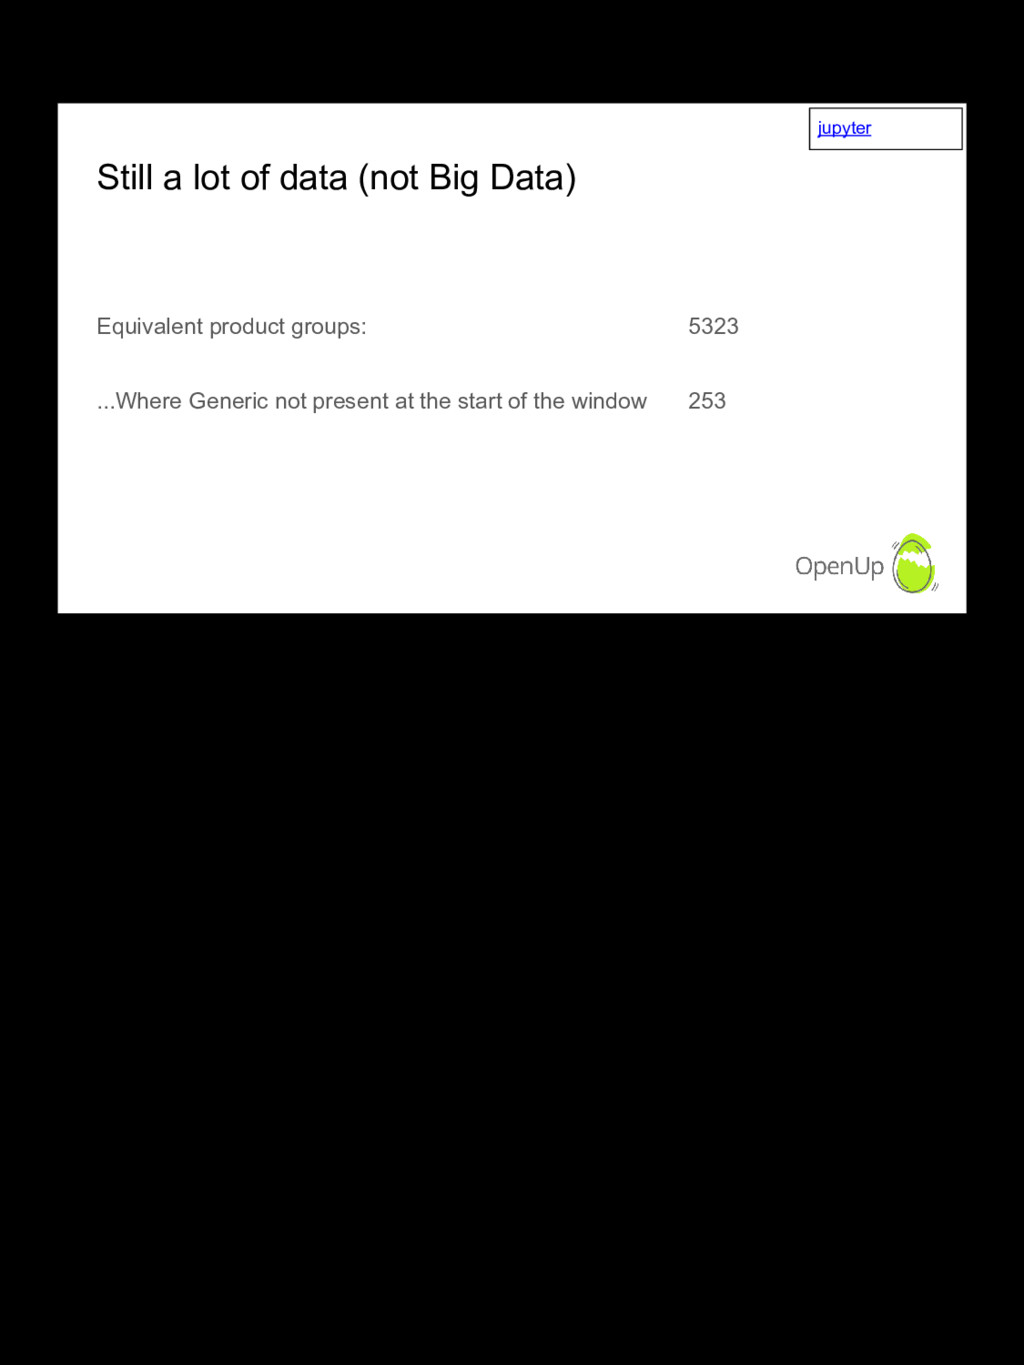
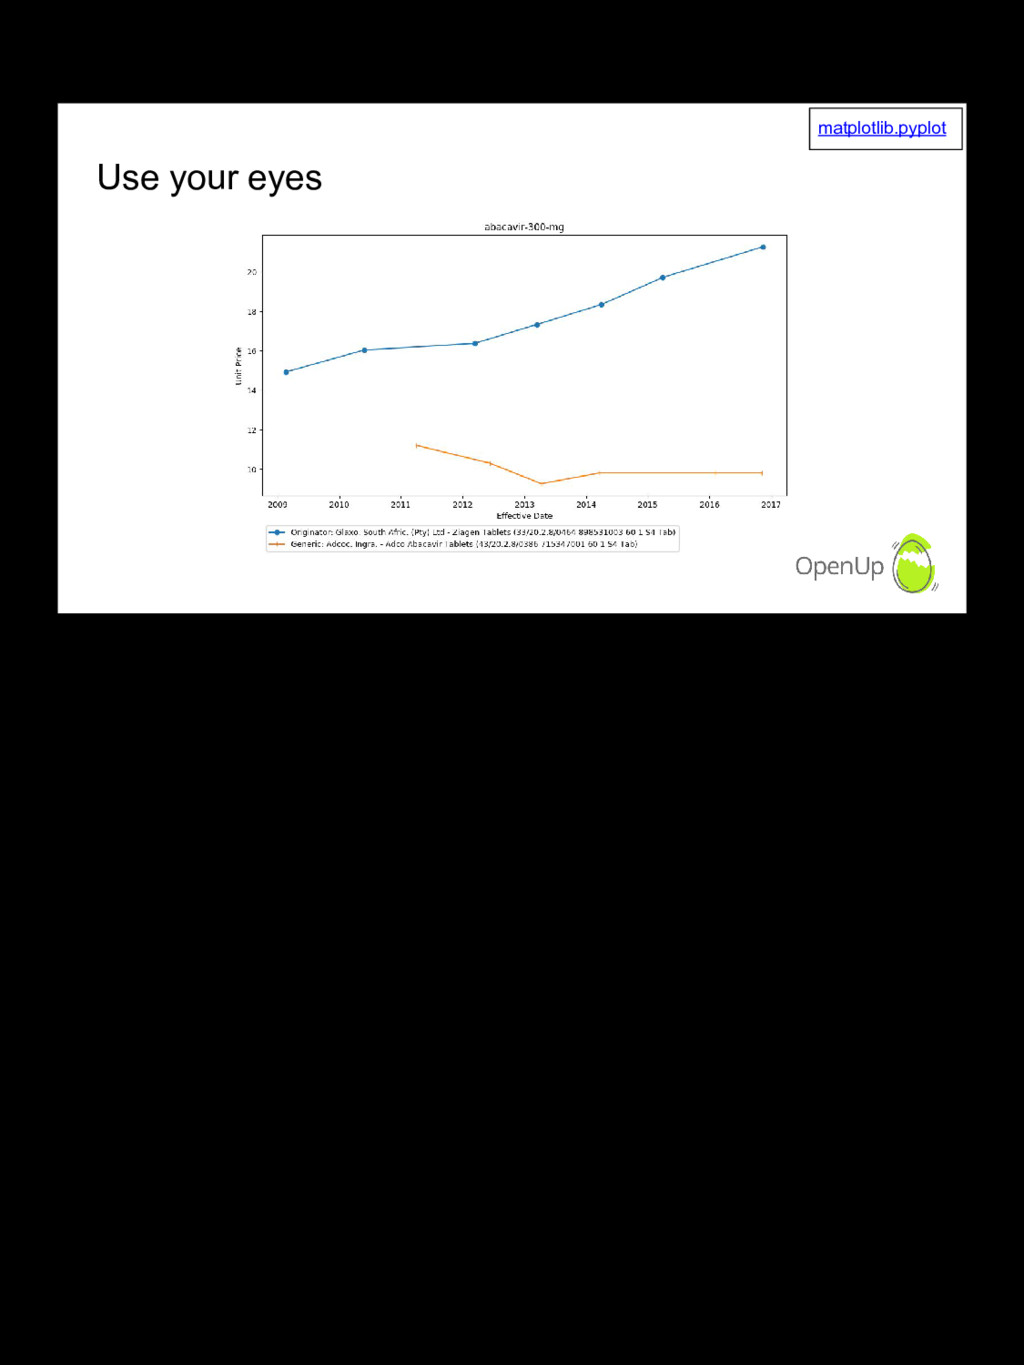
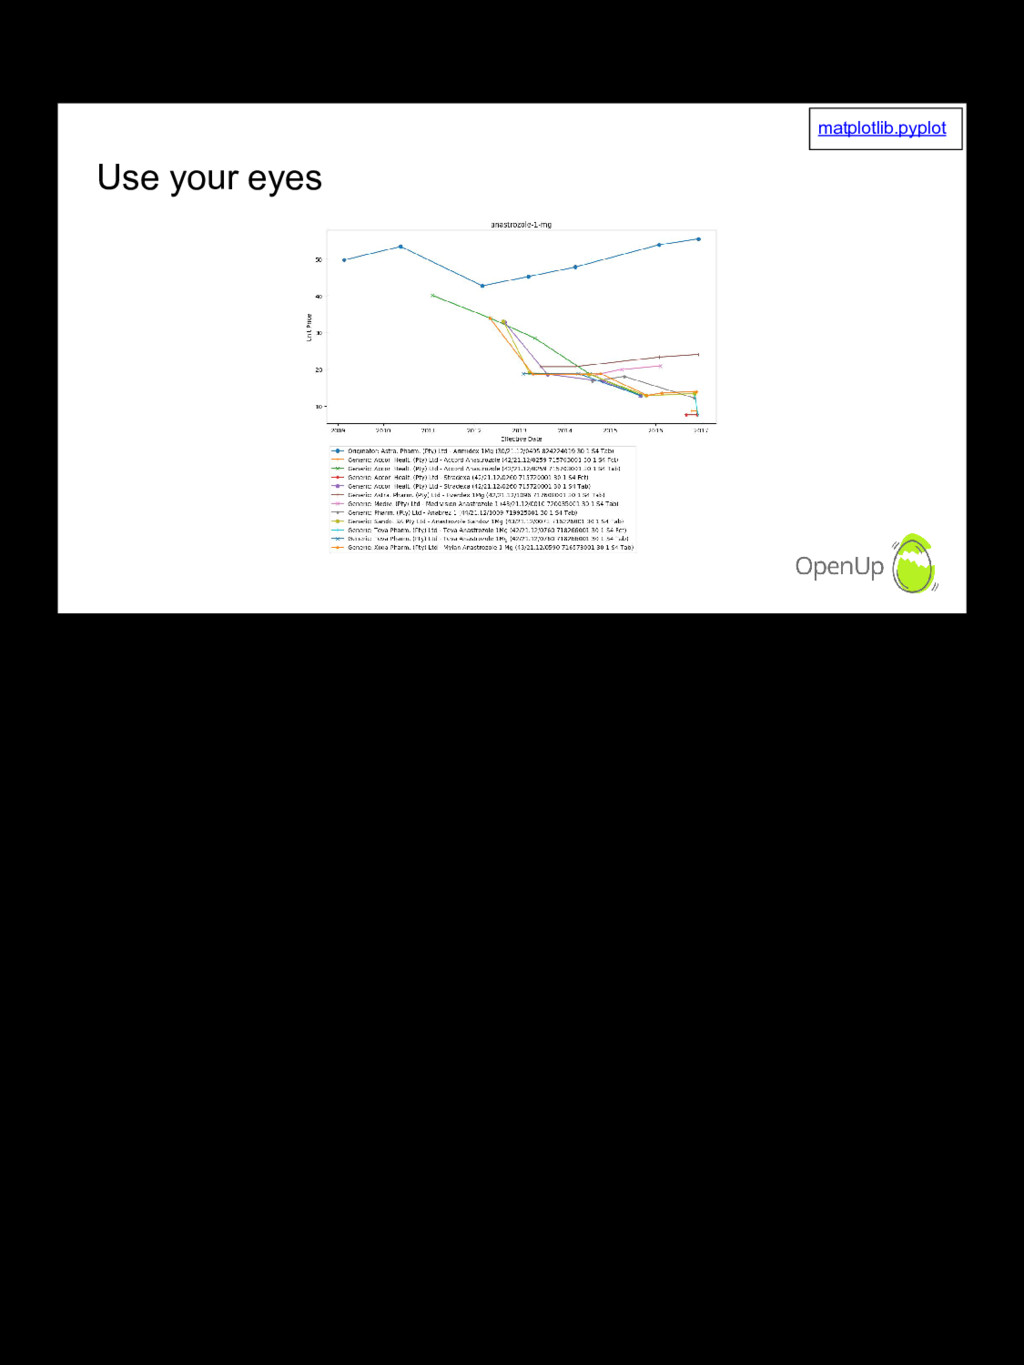
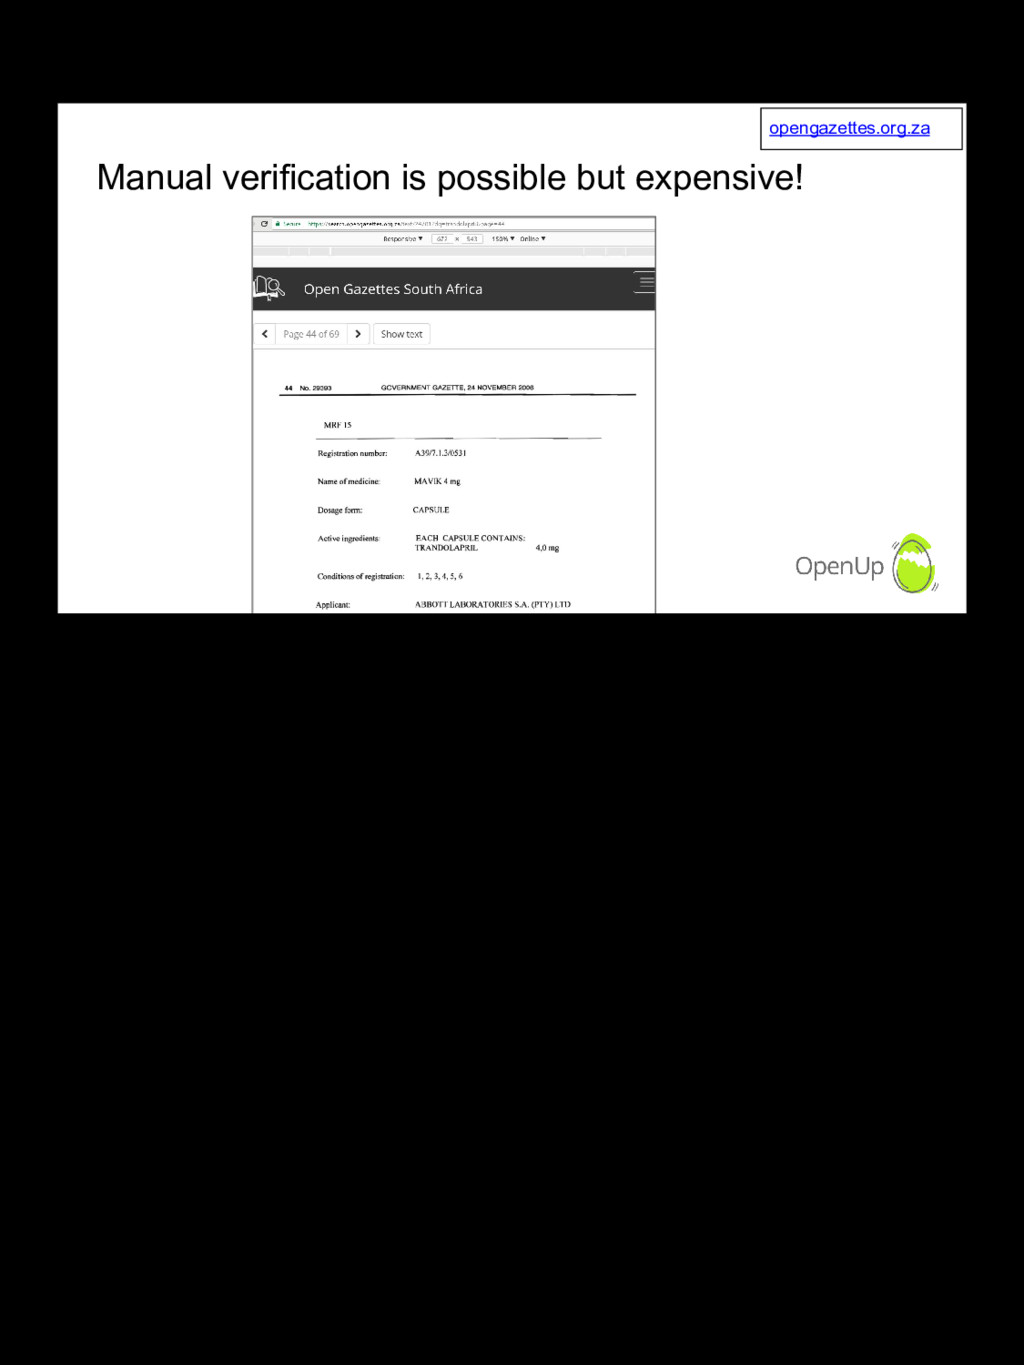
The Medicine Price Registry is a spreadsheet published one or more times per year, with the latest prices and active ingredients for medicines registered for sale in South Africa. Like most data, it's dirty and has limited usability in its original form. We take you through some of the practical steps we take to clean the data and make it easier to analyse and use. This allows us, for example, to analyse how price competition from generics lower medicine prices, or not!

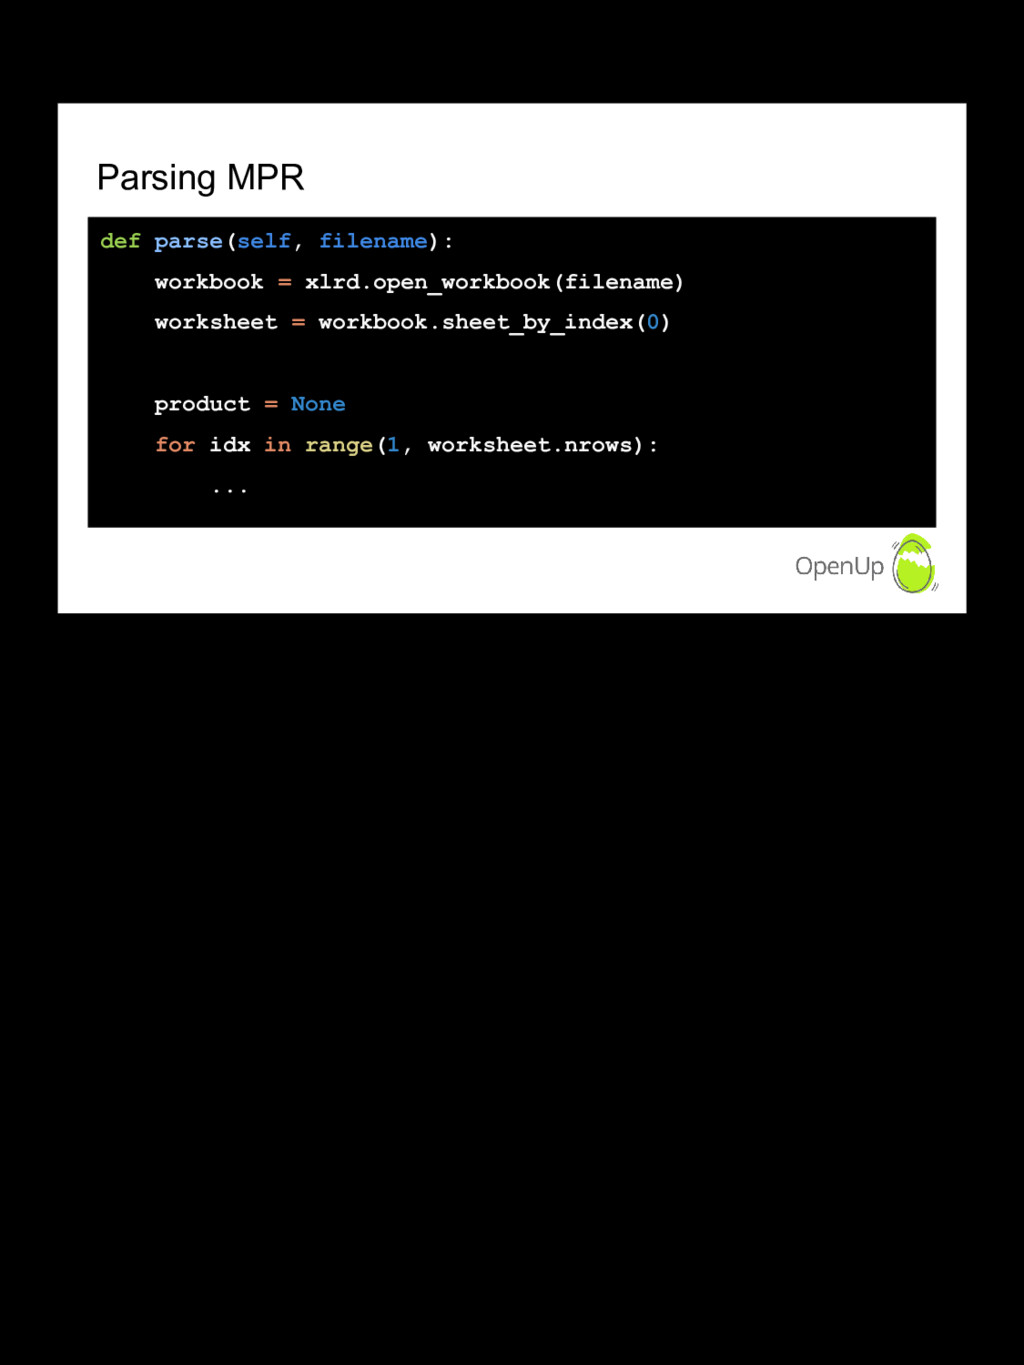
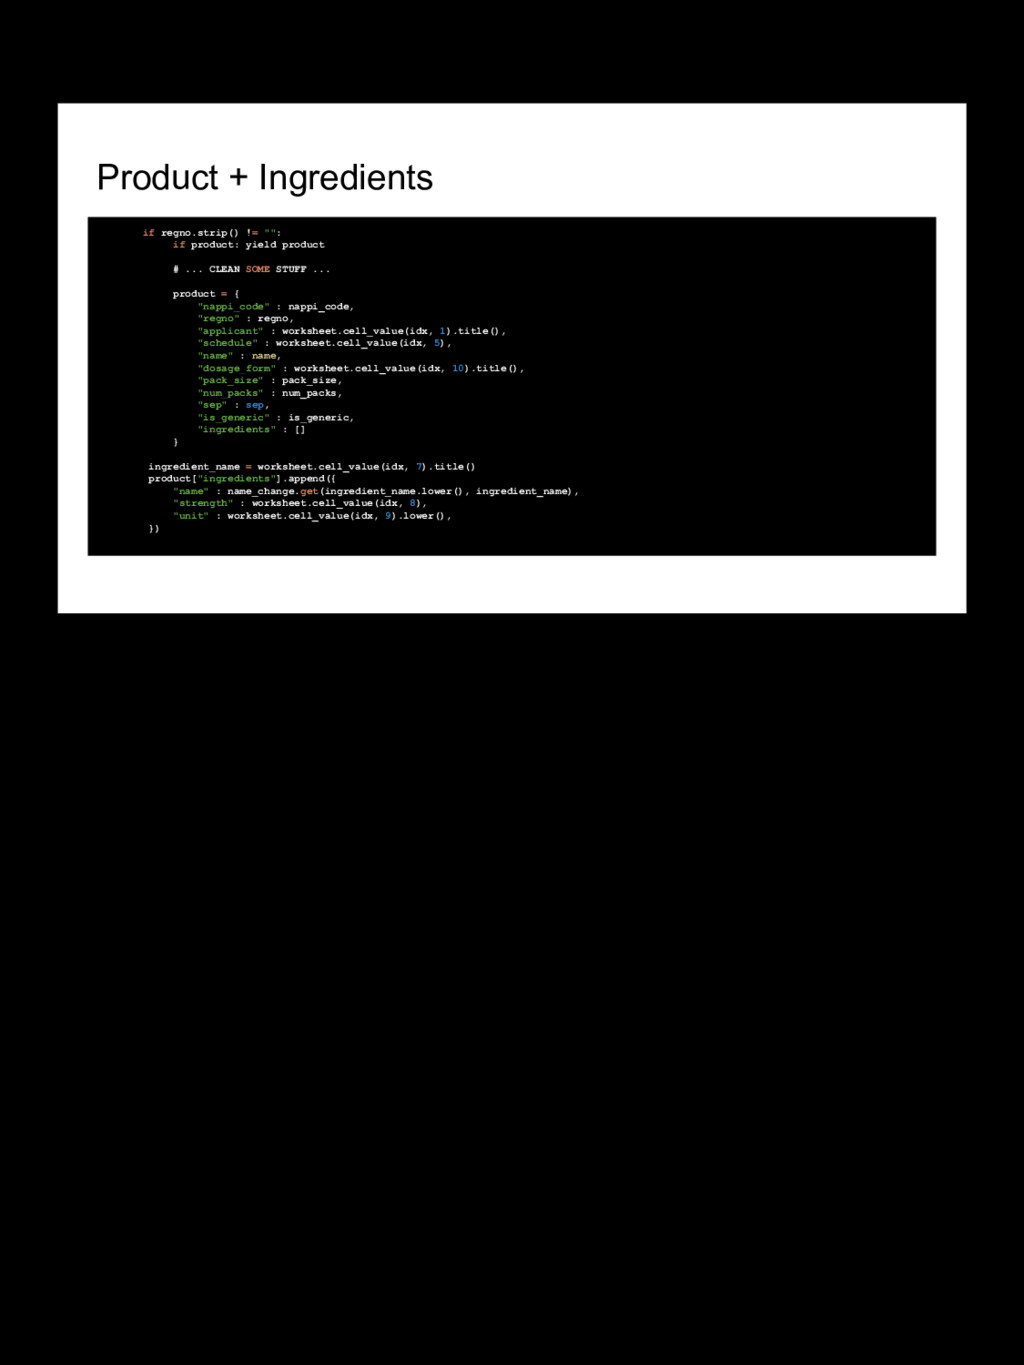
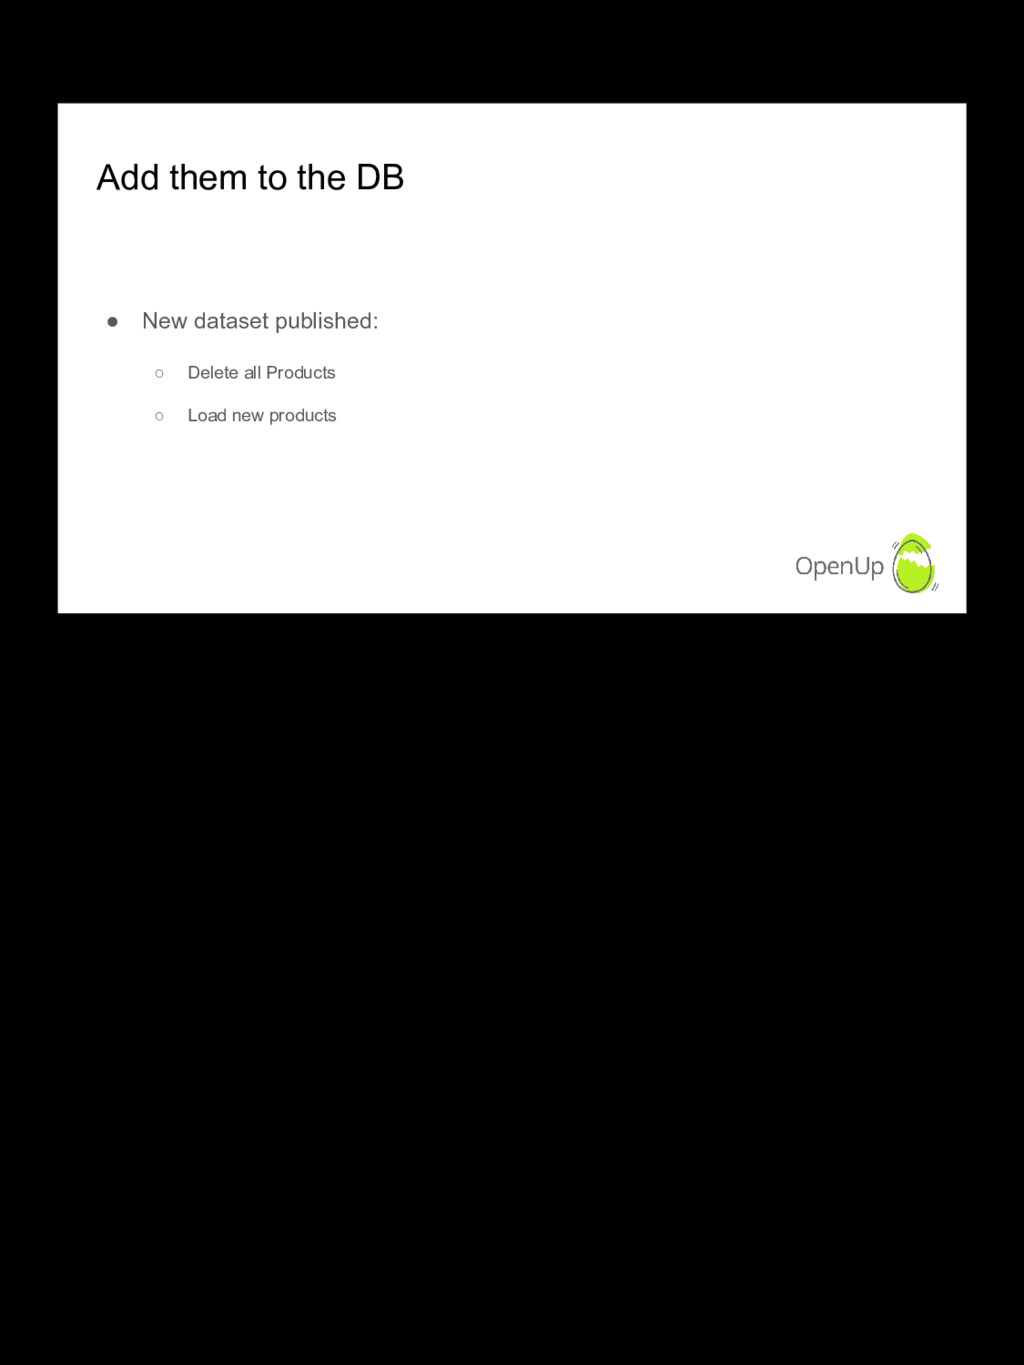
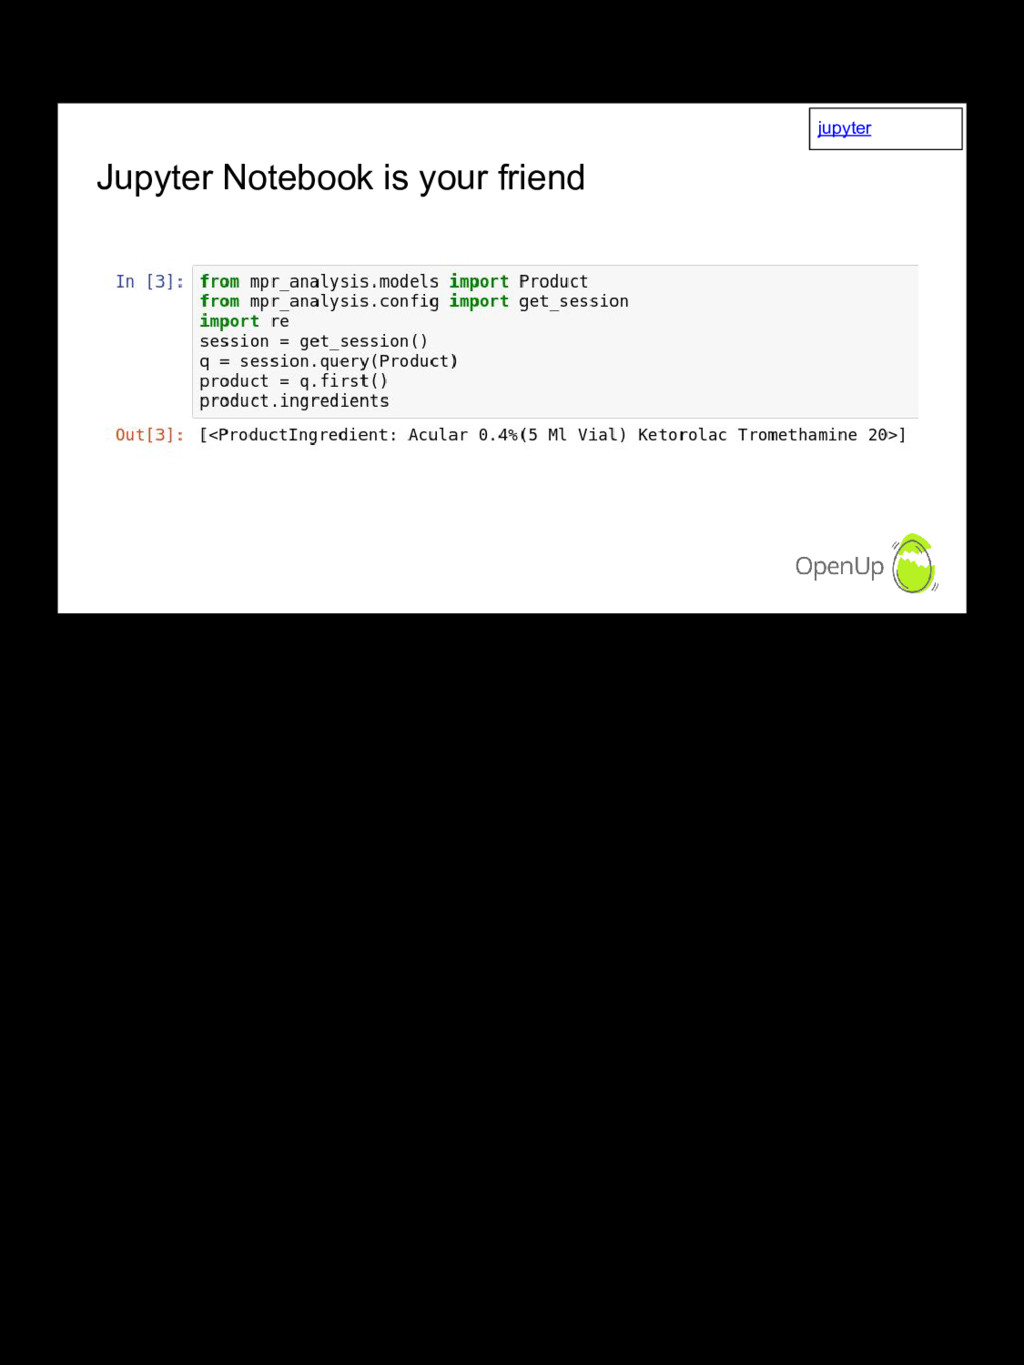
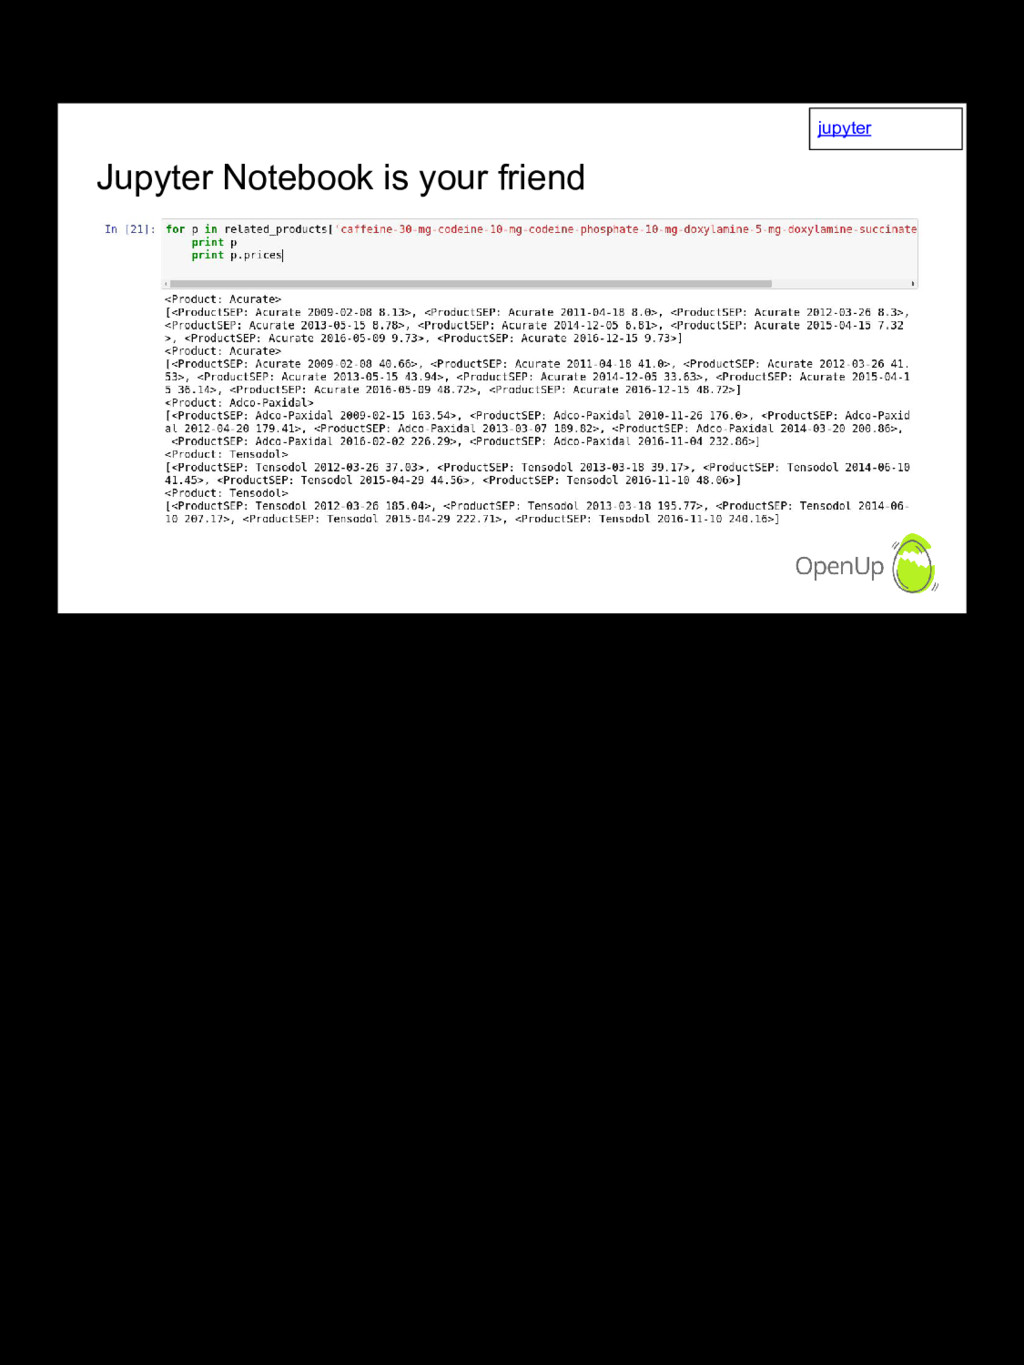
This is intended as a simple real-world example of how we work around the issues with a dataset using a few common tools. This could be done with any platform, but jupyter notebooks, sqlalchemy, alembic migrations and the brevity of python is a nice combination for the iteration needed to work with this data and adapt as we get to know it. We start with a GUI tool called OpenRefine but it pretty quickly becomes necessary to write just a bit of code to move quickly.

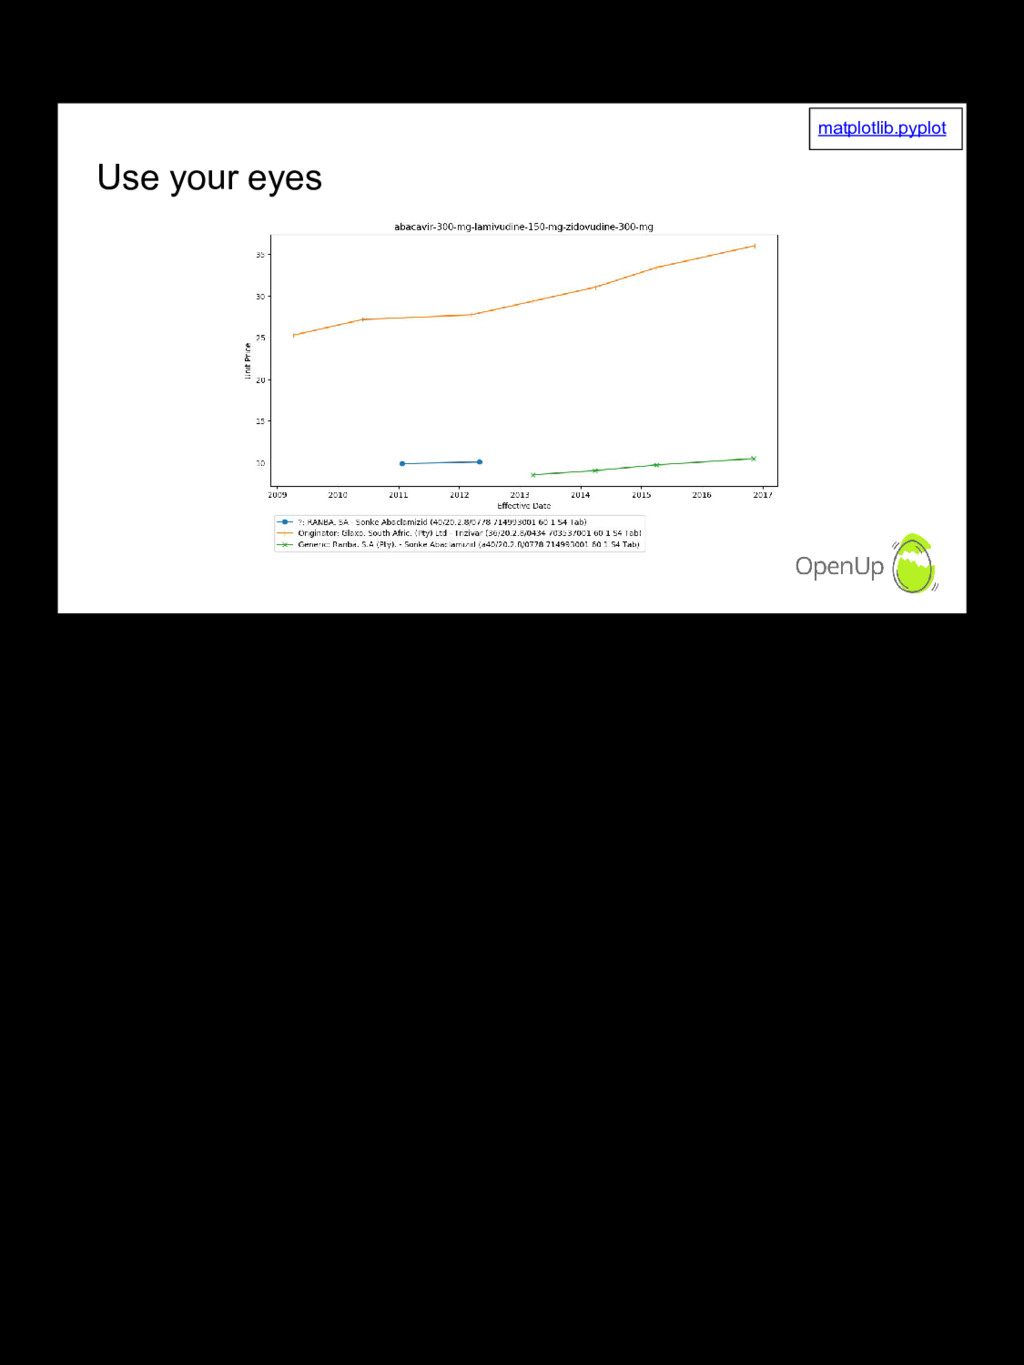
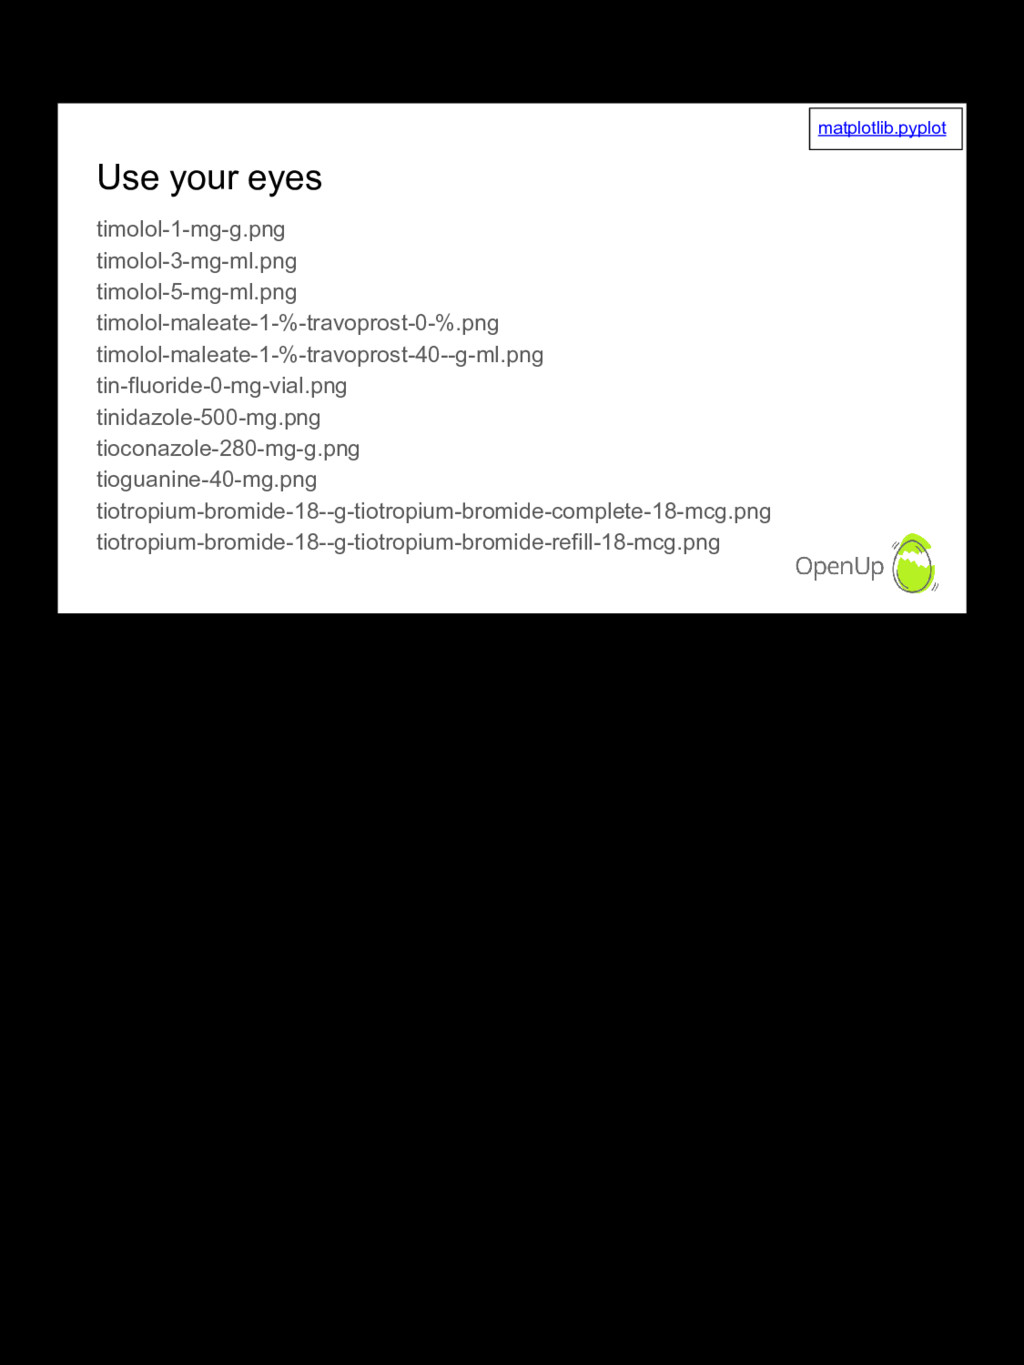
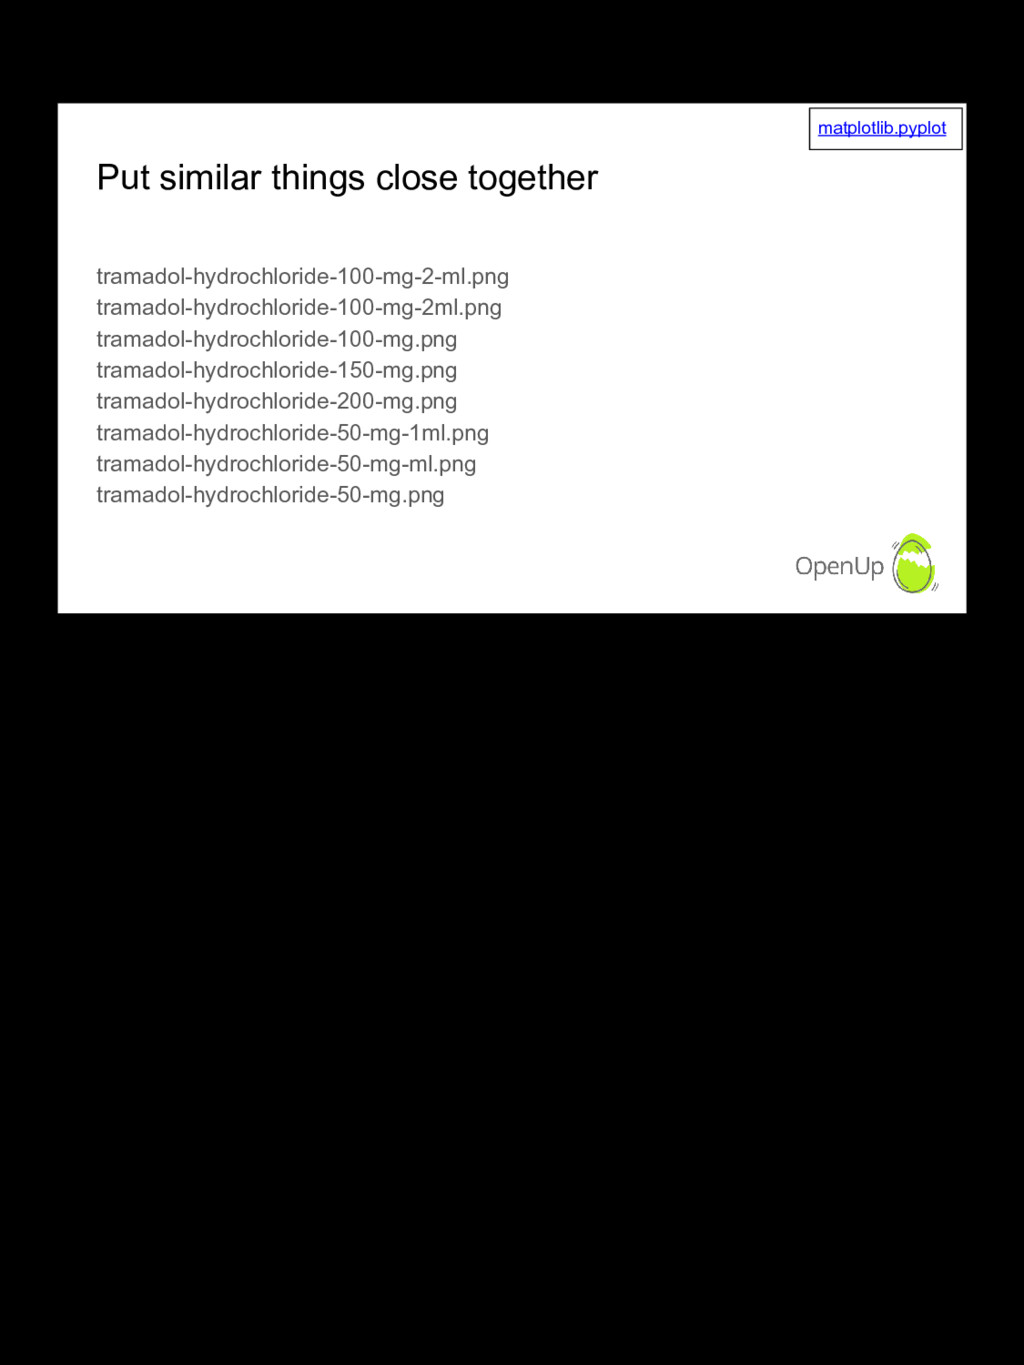
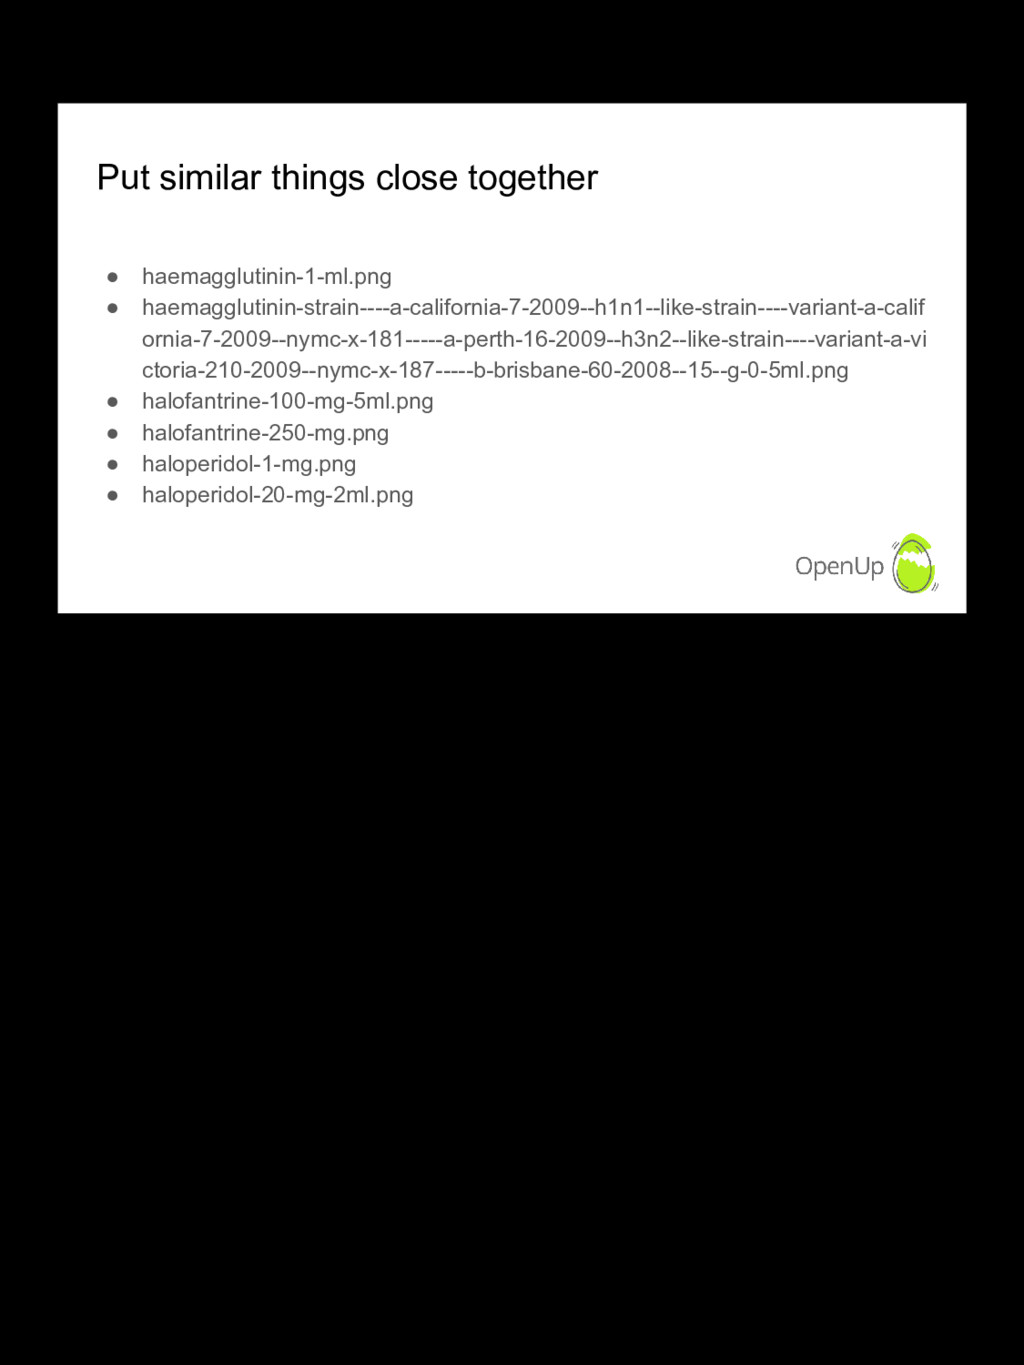
There's a lot of material out there on specific tools. I'd like to show the reality of dirty datasets, and the workarounds and approaches we use to get value from it nonetheless. One such example is using charts and ordering to group related data and visually identify interesting events. I encourage people to ask questions and offer suggestions. The effort put into this project has been limited by time constraints but any improvements can have real world impact.

Pycon ZA

October 05, 2017
Tweet

More Decks by Pycon ZA

Other Decks in Programming

Transcript

  1. Making man-made medicine price data more useful JD Bothma [email protected]

    @jdbothma Man made medicine price data More useful Used to be Code For South Africa People put too much emphasis on the word code. We do write code, but the objective is always to empower people in south africa. To make them informed and more empowered to take part in solving problems they face. Sometimes coding helps. So now we’re called OpenUp
  2. • Data is fun • Data is dirty • You

    can do it! There are really three main points to this talk.
  3. South African Medicine Price Registry mpr.gov.za We became aware of

    something called the Medicine Price Registry The MPR is a registry of medicines and regulated prices There’s a base price, percentage margin for the pharmacy’s dispensing fee, Tax, and it comes to the SINGLE EXIT PRICE which is basically the max price that product can be sold for as packaged. Like most government websites, this one doesn’t exactly get you super excited. But on the right over there is a link to “Databases”
  4. South African Medicine Price Registry mpr.gov.za And on the databases

    page there’s one link to an Excel Spreadsheet. Note that it’s 22MB I’m not sure about excel, but LibreOffice doesn’t exactly love a 20MB spreadsheet, even today.
  5. South African Medicine Price Registry mpr.gov.za Here you have your

    typical horrendous spreadsheet A variety of formatting styles and locked columns and all sorts of things that make you want to play with it.
  6. A Product mpr.gov.za You’ll have distinct products for a pack

    with 20 pills and a pack with 40 pills Prices vary dramatically. One might be R80, another might be R3000 Cancer drugs are expensive! It also indicates whether the drug is an originator produced under patent, or a generic
  7. What should your medicines cost? So what should your drugs

    cost? So, my colleague found this dataset and had a few hours so he obviously made a site to help you find cheap drugs
  8. Find Cheap Generics mpr.code4sa.org This one Simple little django app.

    The database is SQLite file on disk. It works a charm. Thanks to bootstrap we don’t need to think much about making it look sharp enough Simple little json API With something like 10000 products, search works fine. People can find what’s written on their prescription, find the maximum any pharmacy is allowed to charge for it They can also find generic alternatives. It’s a bit more complicated than just the active ingredients. That’s why there’s a pharmacist dispensing these things and not just giving you the drug you ask for. We know people use it. One time the server went down, and a doctor got in touch and asked when it will be back up, because they use it daily to find cheaper alternatives for their low income patients.
  9. Find Cheap Generics mpr.code4sa.org It’s not really just about saving

    a few rand though Did you even know our medicine prices were regulated? So you might get here because you want to find out more about one medicine, but then you can just learn a bit more about the systems that are in place And I think that’s important. Because if we don’t use the systems that are in place, and we don’t know about them, we won’t take part in the debate if people want to change them, or abuse them. So we need to be at least a bit aware of what’s out there.
  10. One or more rows per record Now this makes me

    a bit sick but we can deal with it. I mean it worked for the users thus far, right? One product might have multiple ingredients. So in excel that means one product must have its ingredients on one or more rows.
  11. Find price and “equivalent” medicines • Load latest MPR xls

    • Query by name • Given Product, find Products with same Ingredients ◦ (at same strength) So every few months when there’s a new dataset, we want to load the latest spreadsheet Users want to query for products by product name or ingredient name If you’re looking at a product, you want to find the products with equivalent ingredients
  12. Parsing MPR def parse(self, filename): workbook = xlrd.open_workbook(filename) worksheet =

    workbook.sheet_by_index(0) product = None for idx in range(1, worksheet.nrows): ... We start of with a nice little loop over the spreadsheet rows
  13. Multirow Records: Yield on new Product for idx in range(1,

    worksheet.nrows): regno = worksheet.cell_value(idx, 2).lower() pack_size = worksheet.cell_value(idx, 11) num_packs = worksheet.cell_value(idx, 12) sep = worksheet.cell_value(idx, 16) name = worksheet.cell_value(idx, 6).title() if regno.strip() != "": if product: yield product # ... CLEAN SOME STUFF ... Then we pull out the values we want from the row. If it’s a new product row, we yield the previous row. A row with a product code is a new product. A row without a product row is an ingredient from the previous product
  14. # CLEAN SOME STUFF • Fix case on Originator/Generic •

    Skip if NAPPI code isn’t an integer • Skip if Single Exit Price (SEP) is missing There’s some quick basic cleaning you can do inline, like making casing consistent, ensuring important values are present, and so on.
  15. Product + Ingredients if regno.strip() != "": if product: yield

    product # ... CLEAN SOME STUFF ... product = { "nappi_code" : nappi_code, "regno" : regno, "applicant" : worksheet.cell_value(idx, 1).title(), "schedule" : worksheet.cell_value(idx, 5), "name" : name, "dosage_form" : worksheet.cell_value(idx, 10).title(), "pack_size" : pack_size, "num_packs" : num_packs, "sep" : sep, "is_generic" : is_generic, "ingredients" : [] } ingredient_name = worksheet.cell_value(idx, 7).title() product["ingredients"].append({ "name" : name_change.get(ingredient_name.lower(), ingredient_name), "strength" : worksheet.cell_value(idx, 8), "unit" : worksheet.cell_value(idx, 9).lower(), }) Once we’ve done basic cleaning, we put the data into a dictionary. You don’t need to be able to read this, I just think dictionary instantiation is pretty
  16. Add them to the DB • New dataset published: ◦

    Delete all Products ◦ Load new products
  17. What about medicine prices over time? Now this dataset is

    published periodically. Which means we have prices over time. That could be fun.
  18. Medicine prices over time • Adjust data model ◦ split

    Price from Product ◦ Price has Effective Date To load the prices over time, we need to store prices separately from the product. No big deal
  19. No migrations? No Problem! • (Small Problem) • Too lazy

    to learn SQLite and upgrade old django • SQLAlchemy + Alembic FTW!! Unfortunately my colleage is a hacker and just stuck stuff into SQLite willy nilly. I’m a clutz with no memory and want repeatability. It felt like too much of a pain to upgrade the old django to be able to add migrations easily, So I just copied everything into SQLAlchemy models
  20. Fresh start: Add Constraints class Product(Base): __tablename__ = 'product' id

    = Column(Integer, primary_key=True) applicant_licence_no = Column(String, nullable=False) applicant_name = Column(String, nullable=False) nappi_code = Column(String, nullable=False) regno = Column(String, nullable=False) name = Column(String, nullable=False) schedule = Column(String) dosage_form = Column(String) pack_size = Column(Float, nullable=False) is_generic = Column(String) num_packs = Column(Integer) ingredients = relationship("ProductIngredient", back_populates="product") prices = relationship("ProductSEP", back_populates="product") equivalence_key = Column(String) __table_args__ = ( UniqueConstraint('regno', 'nappi_code', 'pack_size', 'num_packs', 'schedule', 'dosage_form', name='product_unique'), ) So I happily start building my models with SQLAlchemy’s Object Relational Models Like a good little engineer I don’t use a domain-specific primary key but just an integer. I add a unique constraint on what could be the primary key: the NAPPI code I import the data - ERROR! Duplicate key - two products have the same NAPPI code but different pack size Ok, the data isn’t perfect, let’s see where this goes. I add pack size to the unique constraint. ERROR! Duplicate key. And so on, until I had 6 columns in the unique constraint
  21. Fresh start: Add Constraints UniqueConstraint('regno', 'nappi_code', 'pack_size', 'num_packs', 'schedule', 'dosage_form',

    name='product_unique') Theory: NAPPI code is primary key Practise: 5 fields violate this • Which version is correct? • Quorum might solve this ◦ multiple differences • Humans suck In theory, the NAPPI code is a unique identifier per product In practise, there are variations all over this dataset For two or more versions of a product, which one is correct? Perhaps we say the odd one out is the wrong one. Perhaps that one is a correction on the others.
  22. What I should have done: • For each violating column

    ◦ how many rows violate the correct unique constraint? • Maybe I can fix 10 rows by hand • Worry about quorum and other clever things later Hindsight is 20:20 I should probably have gotten a quick idea here of how many thigns are wrong If it’s only a few, I can fix them by hand
  23. OpenRefine: Normalise names openrefine.org Other fields are easier to clean

    There’s a GUI tool to cluster similar names and normalise them. This is inherently interactive so it’s probably wise to use a GUI tool. OpenRefine can do much more, but this was really what I used it for in this project. You select a column, tell it to cluster the names, you can select between algorithms and tweak parameters, and replace all the variants with your chosen one. You can also export this to JSON to apply programmatically or import back to OpenRefine for use in another session, e.g. when you get more data.
  24. What about medicine prices over time? Can’t tell much automatically

    Can’t reliably track product over time Unit Price = max_price / (pack_size + num_packs) It would be nice to write queries that can tell us how the medicine market behaves over time What’s the average number of competitors? How much does competition affect the price We know there are errors - we’re not sure of the extent of the errors It’d be interesting to track the price of a product over time, but since the unique constraint had to be so broad, we know there are interruptions to the product series, and therefore the product price series.
  25. What can we tell? All is not lost. Find interesting

    candidates So it’s impractical to answer the question you set out with Pivot Data isn’t perfect Go find candidates for interesting stories
  26. Equivalent products Same set of ingredients in same quantity •

    Name-amount-unit slug • Sorted, -appended • lowercase We want to easily look at equivalent products It’s easier
  27. Equivalent products { ..., u'mefenamic-acid-500-mg': [<Product: Ponstan Forte>, <Product: Fenamin>,

    <Product: Ponac Forte>, <Product: Ponstel Forte>, <Product: Ponac Forte>], ..., }
  28. Still a lot of data (not Big Data) Equivalent product

    groups: 5323 ...Where Generic not present at the start of the window 253 jupyter Do little experiments to focus on smaller subsets of the data Focus on areas where you have a suspicion there’s something interesting It’s difficult to learn stuff about about unmanageable amounts of data. Your data isn’t going anywhere, but time is running away
  29. Use your eyes timolol-1-mg-g.png timolol-3-mg-ml.png timolol-5-mg-ml.png timolol-maleate-1-%-travoprost-0-%.png timolol-maleate-1-%-travoprost-40--g-ml.png tin-fluoride-0-mg-vial.png tinidazole-500-mg.png

    tioconazole-280-mg-g.png tioguanine-40-mg.png tiotropium-bromide-18--g-tiotropium-bromide-complete-18-mcg.png tiotropium-bromide-18--g-tiotropium-bromide-refill-18-mcg.png matplotlib.pyplot The same drug in different strengths isn’t equivalent, but it’s similar The charts get complex quickly We don’t put them on the same chart, but your favourite photo viewer probably lets you browse the filenames alphabetically
  30. Put similar things close together tramadol-hydrochloride-100-mg-2-ml.png tramadol-hydrochloride-100-mg-2ml.png tramadol-hydrochloride-100-mg.png tramadol-hydrochloride-150-mg.png tramadol-hydrochloride-200-mg.png

    tramadol-hydrochloride-50-mg-1ml.png tramadol-hydrochloride-50-mg-ml.png tramadol-hydrochloride-50-mg.png matplotlib.pyplot There are inconsistencies in how strengths get recorded. Sometimes the strength is repeated in the ingredient name. So when something should be part of an equivalent group, it isn’t. That’s ok, the chart will be adjacent and your brains can put the charts together What’s the difference between 50mg/1ml, 50mg/ml and 50mg? It doesn’t matter at this stage. If it looks like there’s something interesting going on, we can figure it out. If we really want to do programmatic analysis, we can clean the relevant subset of data sufficiently. We will never be able to understand everything there is about an interesting dataset. We’ll never be able to clean it.
  31. Manual verification is possible but expensive! opengazettes.org.za If you google

    for some of these products where the data looks wrong, you’ll find registration documents in government gazettes on our open searcheable gazette archive This isn’t just a cheeky little plug of one of our other products It might be possible to scrape structured data from the PDFs published by the government but that’s also a lot of work. Manual verification is possible but it’s expensive. It’s very important that you narrow your criteria and only do the cleaning and other work you have to do.
  32. Put similar things close together • haemagglutinin-1-ml.png • haemagglutinin-strain----a-california-7-2009--h1n1--like-strain----variant-a-calif ornia-7-2009--nymc-x-181-----a-perth-16-2009--h3n2--like-strain----variant-a-vi

    ctoria-210-2009--nymc-x-187-----b-brisbane-60-2008--15--g-0-5ml.png • halofantrine-100-mg-5ml.png • halofantrine-250-mg.png • haloperidol-1-mg.png • haloperidol-20-mg-2ml.png So, excitedly, we send big folders full of these charts to people exploring this data with us. Ugh What is this?!?! It turns out, sometimes products rows don’t have product codes. So you add a whole list of ingredients to a product that they don’t belong to. Data is dirty. Accept it. Be subservient to the data. Respect it. But have fun
  33. You can do it! Really. I just showed you. It’s

    messy. That’s ok. It’s not like the textbook makes it look. Just play with it. You’ll find interesting things to do with it in no time.
  34. • Data is fun • Data is dirty • You

    can do it! Data is fun. • I’ve never played with a dataset and not gotten excited about its potential. • You’ll find stories in the data that you never expected. Just be open and dive in • Be cynical. Question everything. Why is this so? There’s a story there. Data is dirty. • It’s ok. • You have to learn to compromise. • Sorry about your beautiful data model. • Can you answer your question or not? • Iteratively develop your questions based on what’s really interesting, necessary and practical You can do it. • There’s great tooling. • Code only when you need to. ◦ Get familiar with pivot tables in your favourite spreadsheet program and OpenRefine ◦ CSVKit is such an amazing tool for getting to know and transforming big and small CSVs. pip install it in any project using csv. • When you need to, code. ◦ Try out Pandas. I find the syntax frustrating but when you get it right it’s so powerful. You don’t want to code the stuff it does for you. ◦ Don’t be afraid to put stuff into the database. Migrations make it easy to develop your data model as you learn about your data and needs
  35. Join the community • CodeBridge Community Evenings ◦ TONIGHT 18:30

    ◦ Every Second Thursday ◦ CodeBridge, Thicket Street, Cape Town • CodeBridge DurbanLab • Hacks/Hackers in Joburg • Start your city’s community • Find your tribe! Civic Tech Directory coming soon ◦ ZATech Slack #civic-tech What you don’t see in this picture is the fat lounge music playing in the background. Until I finally convinced someone else to start DJing (instructions are on the wall)