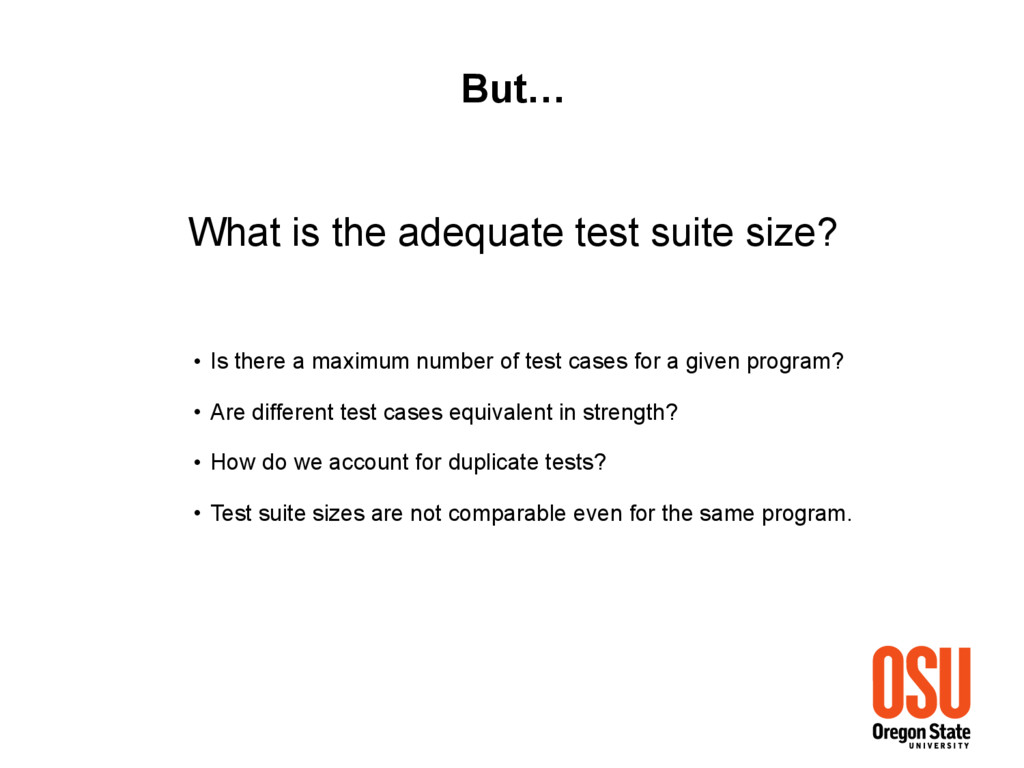
there a maximum number of test cases for a given program? • Are different test cases equivalent in strength? • How do we account for duplicate tests? • Test suite sizes are not comparable even for the same program.
in a statement has 87% probability of being detected if a test covers it. M = 0.87xS Size of dots follow size of projects R2 = 0.94 Results from 250 real world programs largest > 100 KLOC On Developer written test suites
in a statement has 61% probability of being detected if a test covers it. M = 0.61xS R2 = 0.70 Results from 250 real world programs largest > 100 KLOC On Randoop produced test suites
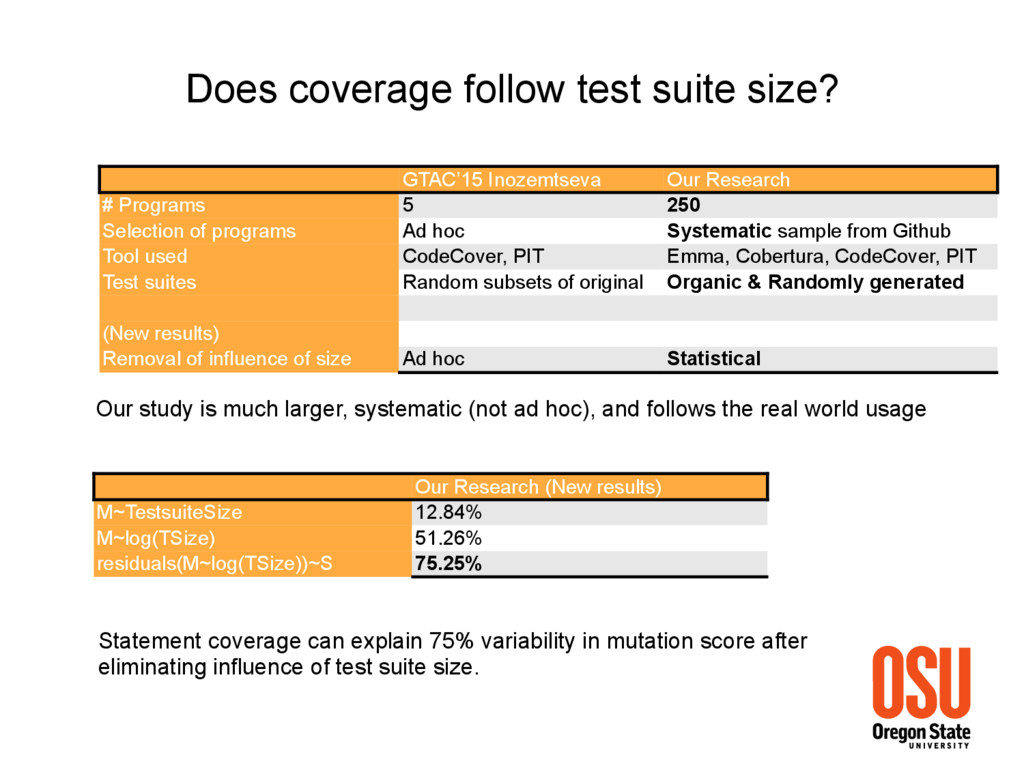
# Programs 5 250 Selection of programs Ad hoc Systematic sample from Github Tool used CodeCover, PIT Emma, Cobertura, CodeCover, PIT Test suites Random subsets of original Organic & Randomly generated (New results) Removal of influence of size Ad hoc Statistical Our study is much larger, systematic (not ad hoc), and follows the real world usage Our Research (New results) M~TestsuiteSize 12.84% M~log(TSize) 51.26% residuals(M~log(TSize))~S 75.25% Statement coverage can explain 75% variability in mutation score after eliminating influence of test suite size.
* c; d = b^2 * 4 * a * c; d = b^2 / 4 * a * c; d = b^2 ^ 4 * a * c; d = b^2 % 4 * a * c; d = b^2 << 4 * a * c; d = b^2 >> 4 * a * c; d = b^2 * 4 + a * c; d = b^2 * 4 - a * c; d = b^2 * 4 / a * c; d = b^2 * 4 ^ a * c; d = b^2 * 4 % a * c; d = b^2 * 4 << a * c; d = b^2 * 4 >> a * c; d = b^2 * 4 * a + c; d = b^2 * 4 * a - c; d = b^2 * 4 * a / c; d = b^2 * 4 * a ^ c; d = b^2 * 4 * a % c; d = b^2 * 4 * a << c; d = b^2 * 4 * a >> c; d = b + 2 - 4 * a * c; d = b - 2 - 4 * a * c; d = b * 2 - 4 * a * c; d = b / 2 - 4 * a * c; d = b % 2 - 4 * a * c; d = b^0 - 4 * a * c; d = b^1 - 4 * a * c; d = b^-1 - 4 * a * c; d = b^MAX - 4 * a * c; d = b^MIN - 4 * a * c; d = b^2 - 0 * a * c; d = b^2 - 1 * a * c; d = b^2 – (-1) * a * c; d = b^2 - MAX * a * c; d = b^2 - MIN * a * c; 14 Mutation Analysis: High cost of analysis
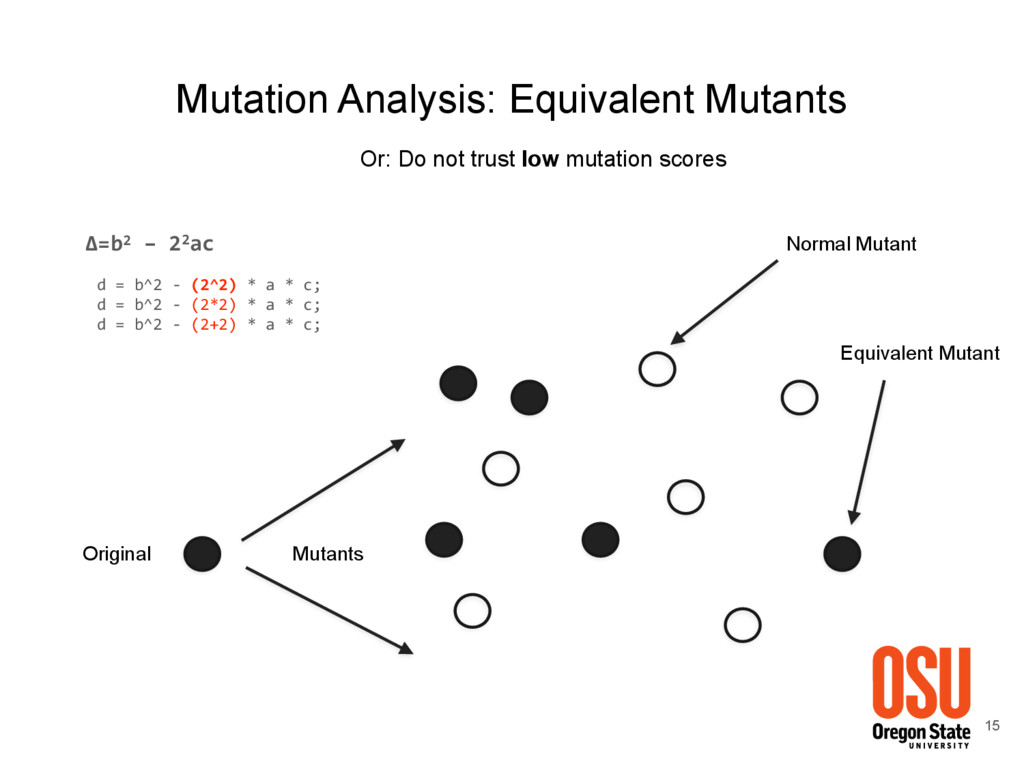
* c; d = b^2 - (2*2) * a * c; d = b^2 - (2+2) * a * c; 15 Mutation Analysis: Equivalent Mutants Mutants Original Equivalent Mutant Normal Mutant Or: Do not trust low mutation scores
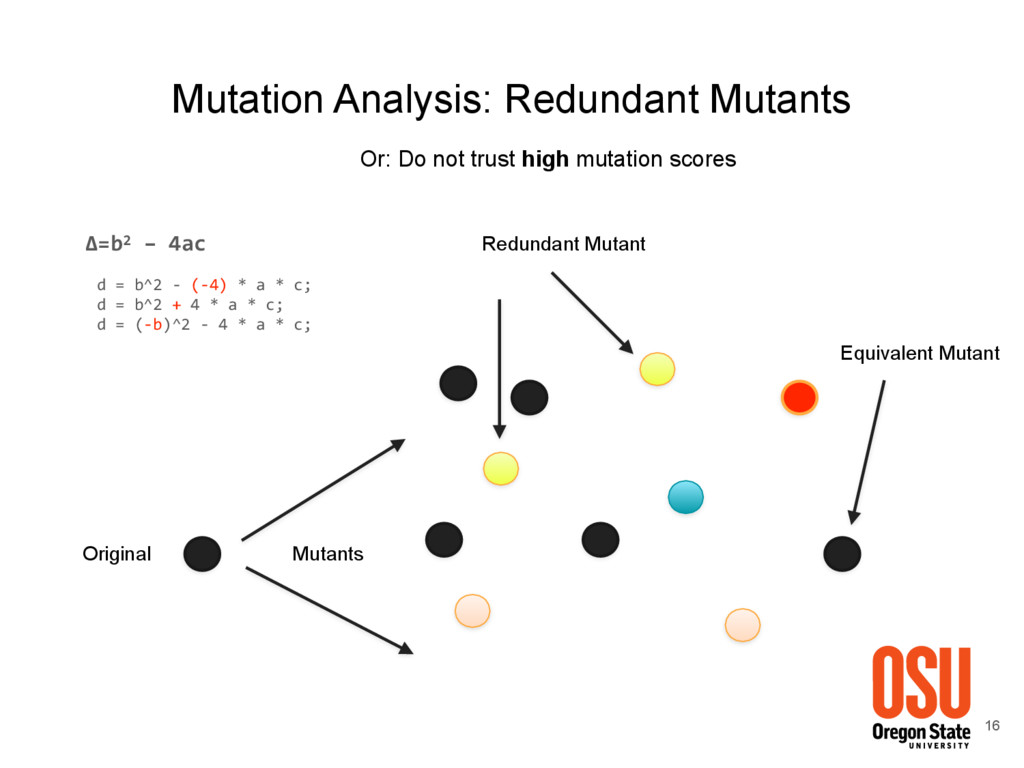
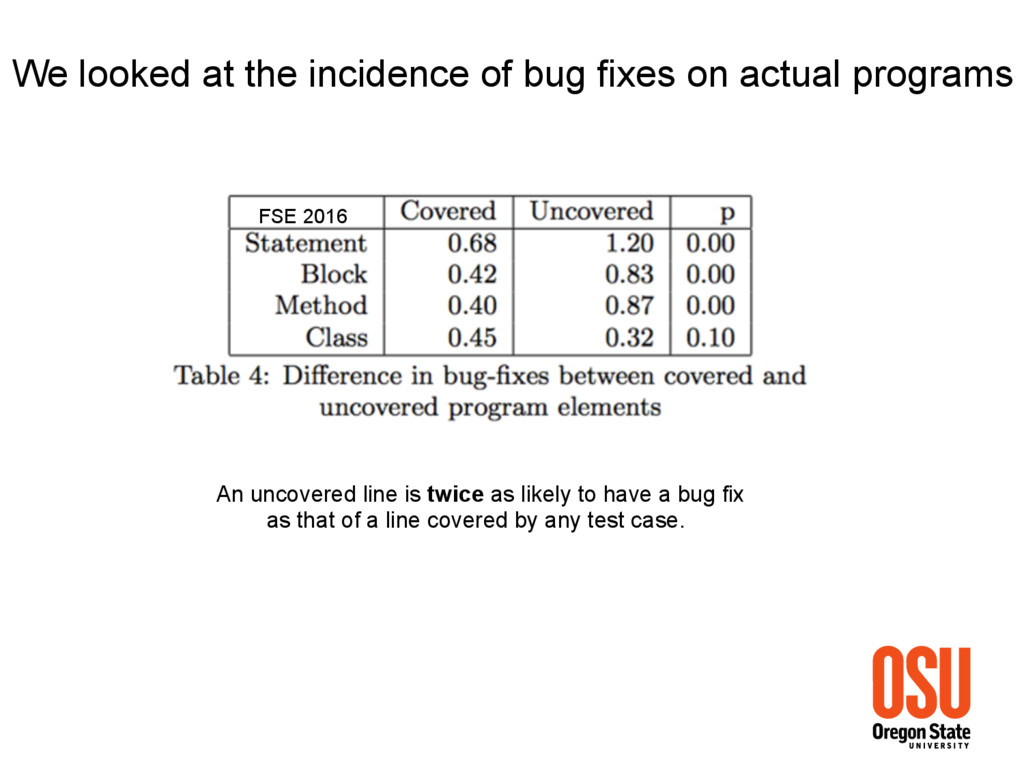
(92%) • Mutation score provides little extra information compared to coverage. • Coverage provides 75% more information than just test suite size. • Mutation score can be unreliable. • Coverage thresholds actually help reduce incidence of bugs.