Upgrade to Pro — share decks privately, control downloads, hide ads and more …

Jupyter, Pixiedust & Maps: Simplifying spatial visualization in Jupyter Notebooks

Raj Singh
August 24, 2017

Jupyter, Pixiedust & Maps: Simplifying spatial visualization in Jupyter Notebooks

video: https://www.youtube.com/watch?v=Ezh7Xb67lkI&t=107s&list=PLGVZCDnMOq0rxoq9Nx0B4tqtr891vaCn7&index=47

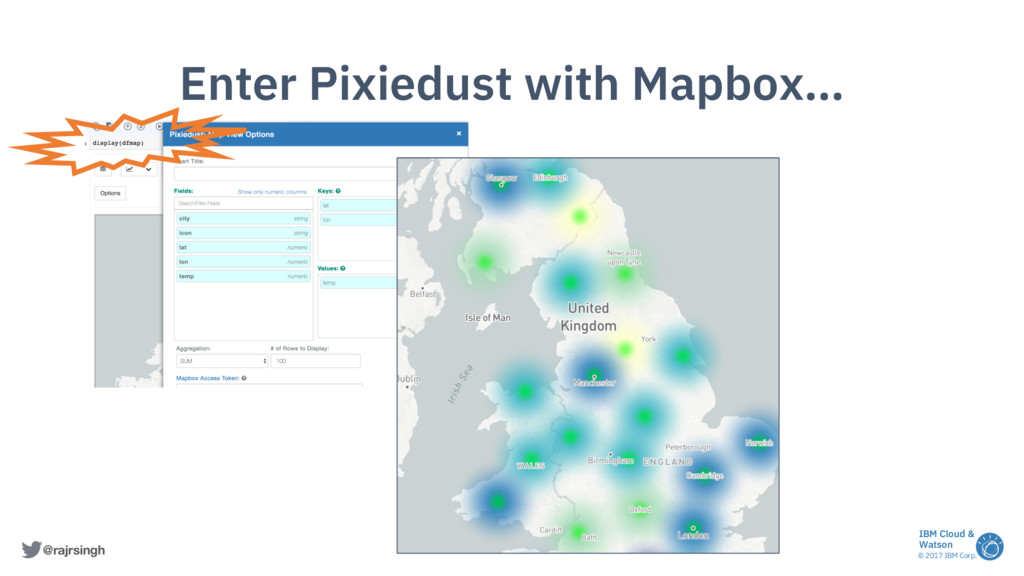
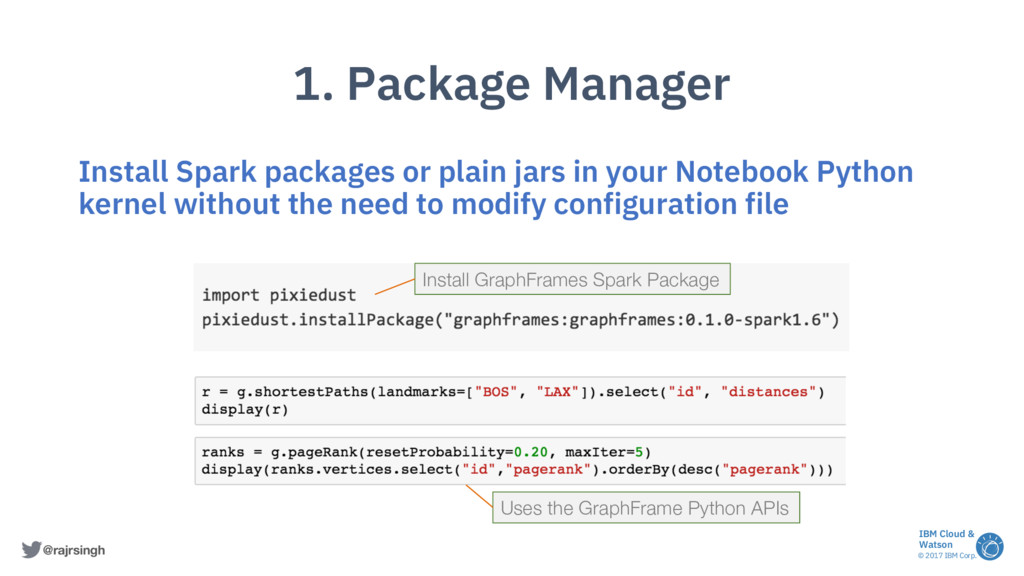
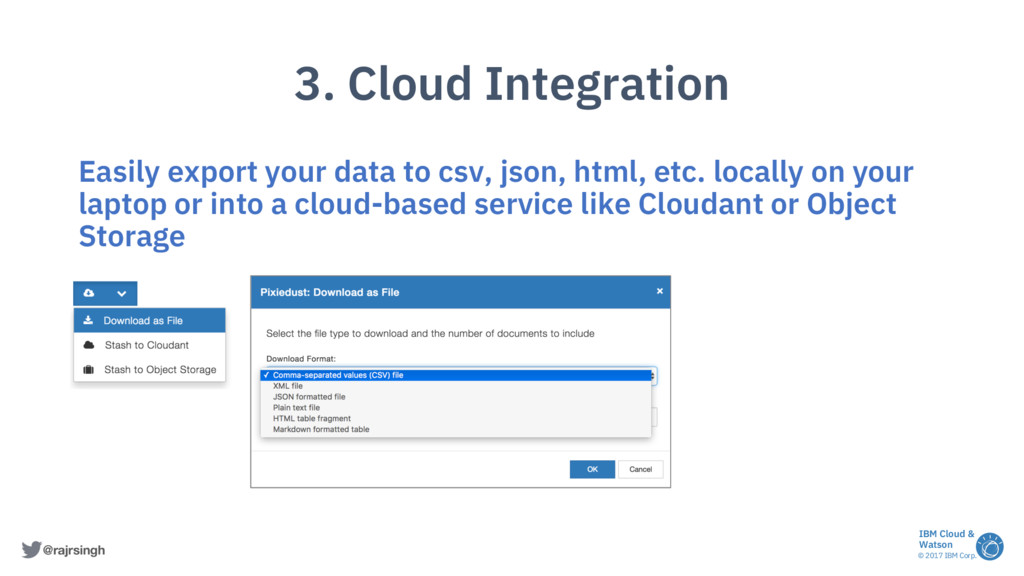
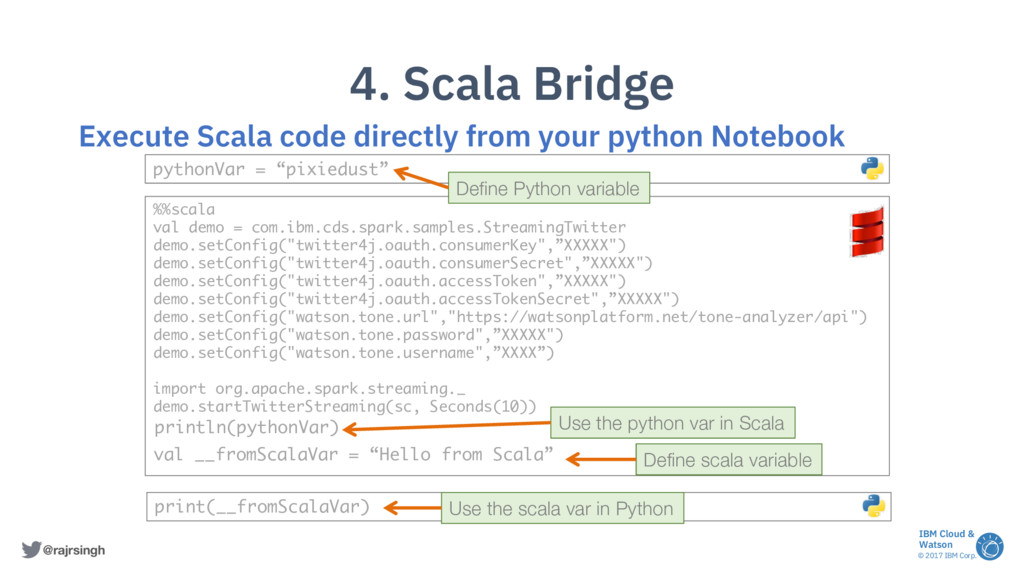
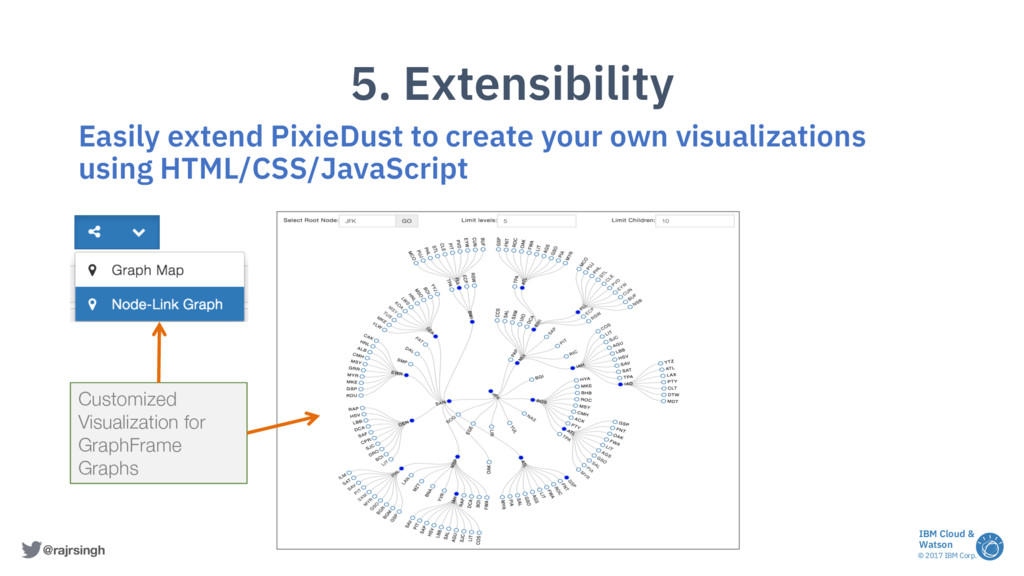
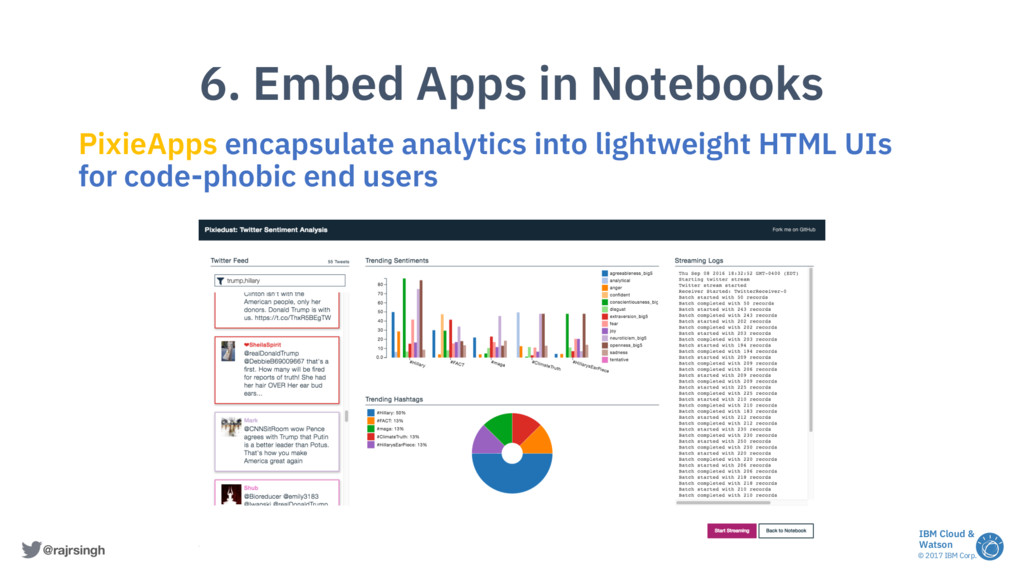
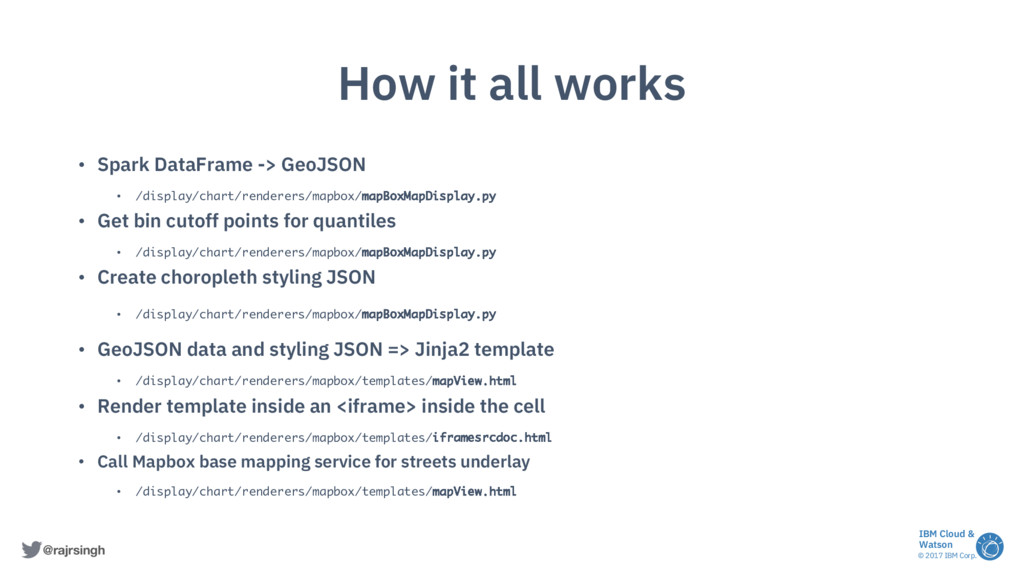
The Jupyter Notebook is a web application that allows you to create and share documents that contain live code, equations, visualizations and explanatory text. The Jupyter stack is built from the ground up to be extensible and hackable. The Developer Advocacy team at IBM Analytics has developed an open source library of useful time-saving and anxiety reducing tools we call "Pixiedust". It was designed to ease the pain of charting, saving data to the cloud and exposing Python data structures to Scala code. I'll talk about how I built mapping into Pixiedust, putting data from Spark-based analytics on maps using Mapbox GL.

Raj Singh

August 24, 2017
Tweet

More Decks by Raj Singh

Other Decks in Technology

Transcript

  1. © 2017 IBM Corp. IBM Cloud & Watson @rajrsingh Jupyter,

    Pixiedust & Maps Simplifying spatial visualization in Jupyter Notebooks Raj Singh Developer Advocate, IBM August, 2017
  2. © 2017 IBM Corp. IBM Cloud & Watson @rajrsingh “Good

    Programmers are Lazy and Dumb” -- Phillipp Lenssen • only lazy programmers will want to write the kind of tools that replace them • only a lazy programmer will avoid writing monotonous, repetitive code – thus avoiding redundancy, the enemy of software maintenance and flexible refactoring • tools and processes that come out will speed up production
  3. © 2017 IBM Corp. IBM Cloud & Watson @rajrsingh Machine

    learning Spark Visualization Notebooks Data lakes Updates Data cleansing Sharing & Collaboration Automated error correction table joins Database Interoperability Schema mapping ETL Model fitting Moving between platforms linear regression Security Good Bad Ugly!
  4. © 2017 IBM Corp. IBM Cloud & Watson @rajrsingh from

    mpl_toolkits.basemap import Basemap from matplotlib.offsetbox import AnnotationBbox from matplotlib._png import read_png from itertools import izip matplotlib.style.use('bmh') fig, axes = plt.subplots(nrows=1, ncols=2, figsize=(10, 12)) # background maps m1 = Basemap(projection='mill',resolution=None, llcrnrlon=-7.5, llcrnrlat=49.84,urcrnrlon=2.5, urcrnrlat=59,ax=axes[0]) m1.drawlsmask(land_color='dimgrey', ocean_color='dodgerBlue',lakes=True) # temperature map for [temp,city] in izip(temps,cities): lat = city[1] lon = city[2] if temp>8: col='indigo' elif temp>10: col='darkmagenta' elif temp>8: col='red' elif temp>6: col='tomato' elif temp>4: col='turquoise' x1, y1 = m2(lon,lat) bbox_props = dict(boxstyle="round,pad=0.3", fc=col, ec=col, lw=2) axes[1].text(x1, y1, temp, ha="center", va="center", size=11,bbox=bbox_props) plt.tight_layout() Is this really mapping in 2017?
  5. © 2017 IBM Corp. IBM Cloud & Watson @rajrsingh Jupyter

    + Pixiedust = 1. PackageManager 2. Visualizations 3. Cloud Integration 4. Scala Bridge 5. Extensibility 6. Embedded Apps
  6. © 2017 IBM Corp. IBM Cloud & Watson @rajrsingh 1.

    Package Manager Install Spark packages or plain jars in your Notebook Python kernel without the need to modify configuration file Install GraphFrames Spark Package Uses the GraphFrame Python APIs
  7. © 2017 IBM Corp. IBM Cloud & Watson @rajrsingh 2.

    Visualizations One simple API: display() Call the Options dialog Performance statistics Panning/Zooming options
  8. © 2017 IBM Corp. IBM Cloud & Watson @rajrsingh 3.

    Cloud Integration Easily export your data to csv, json, html, etc. locally on your laptop or into a cloud-based service like Cloudant or Object Storage
  9. © 2017 IBM Corp. IBM Cloud & Watson @rajrsingh 4.

    Scala Bridge Execute Scala code directly from your python Notebook %%scala val demo = com.ibm.cds.spark.samples.StreamingTwitter demo.setConfig("twitter4j.oauth.consumerKey",”XXXXX") demo.setConfig("twitter4j.oauth.consumerSecret",”XXXXX") demo.setConfig("twitter4j.oauth.accessToken",”XXXXX") demo.setConfig("twitter4j.oauth.accessTokenSecret",”XXXXX") demo.setConfig("watson.tone.url","https://watsonplatform.net/tone-analyzer/api") demo.setConfig("watson.tone.password",”XXXXX") demo.setConfig("watson.tone.username",”XXXX”) import org.apache.spark.streaming._ demo.startTwitterStreaming(sc, Seconds(10)) pythonVar = “pixiedust” Define Python variable println(pythonVar) Use the python var in Scala val __fromScalaVar = “Hello from Scala” Define scala variable print(__fromScalaVar) Use the scala var in Python
  10. © 2017 IBM Corp. IBM Cloud & Watson @rajrsingh 5.

    Extensibility Easily extend PixieDust to create your own visualizations using HTML/CSS/JavaScript Customized Visualization for GraphFrame Graphs
  11. © 2017 IBM Corp. IBM Cloud & Watson @rajrsingh 6.

    Embed Apps in Notebooks PixieApps encapsulate analytics into lightweight HTML UIs for code-phobic end users
  12. © 2017 IBM Corp. IBM Cloud & Watson @rajrsingh Demo

    • https://apsportal.ibm.com/analytics/notebooks/f2bfaebf- 94ec-48a5-aed4- f2bd01226ae3/view?access_token=0b7840132d8634f682b 19a74d57064f75b39c6dfdbee83c28c00cb0fe69d6326
  13. © 2017 IBM Corp. IBM Cloud & Watson @rajrsingh How

    it all works • Spark DataFrame -> GeoJSON • /display/chart/renderers/mapbox/mapBoxMapDisplay.py • Get bin cutoff points for quantiles • /display/chart/renderers/mapbox/mapBoxMapDisplay.py • Create choropleth styling JSON • /display/chart/renderers/mapbox/mapBoxMapDisplay.py • GeoJSON data and styling JSON => Jinja2 template • /display/chart/renderers/mapbox/templates/mapView.html • Render template inside an <iframe> inside the cell • /display/chart/renderers/mapbox/templates/iframesrcdoc.html • Call Mapbox base mapping service for streets underlay • /display/chart/renderers/mapbox/templates/mapView.html
  14. © 2017 IBM Corp. IBM Cloud & Watson @rajrsingh Whither

    Pixiedust mapping? • More cartographic options • Animated temporal visualization • Partner integration: switch to official Mapbox Jupyter lib • Partner integration: Esri, CARTO providers
  15. © 2017 IBM Corp. IBM Cloud & Watson @rajrsingh References

    • IBM Data Science Experience • http://datascience.ibm.com • free 30-day trial • Pixiedust • https://github.com/ibm-watson-data-lab/pixiedust • Project Jupyter • http://jupyter.org/ • Me • [email protected]