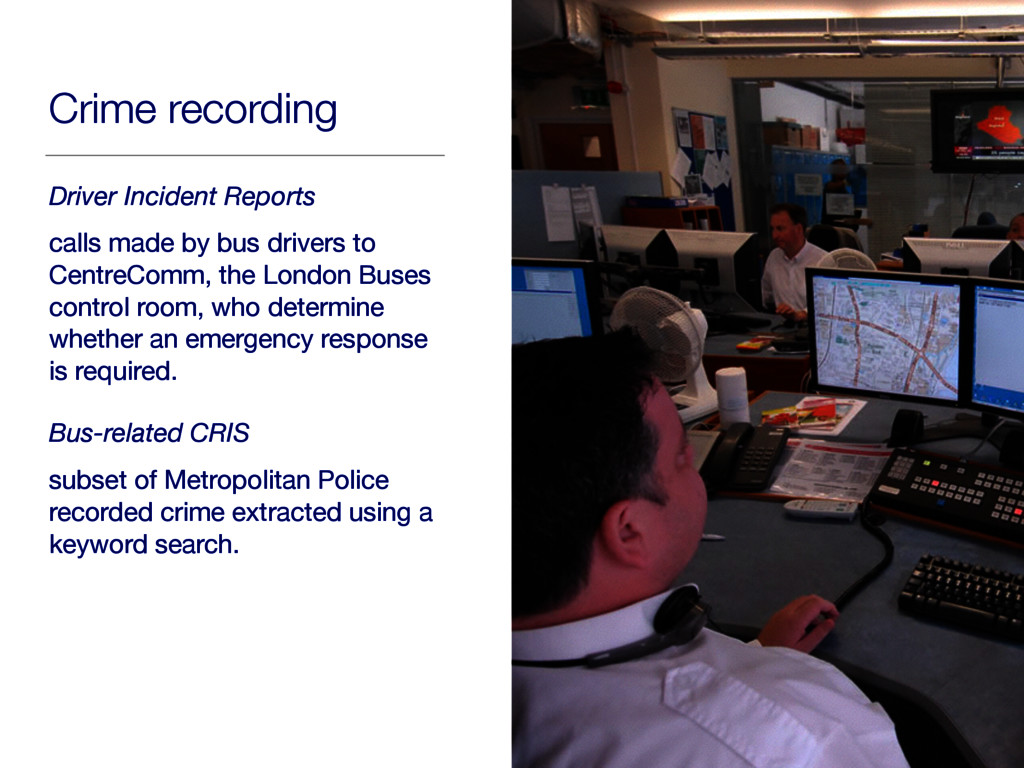
to CentreComm, the London Buses control room, who determine whether an emergency response is required. Bus-related CRIS subset of Metropolitan Police recorded crime extracted using a keyword search.
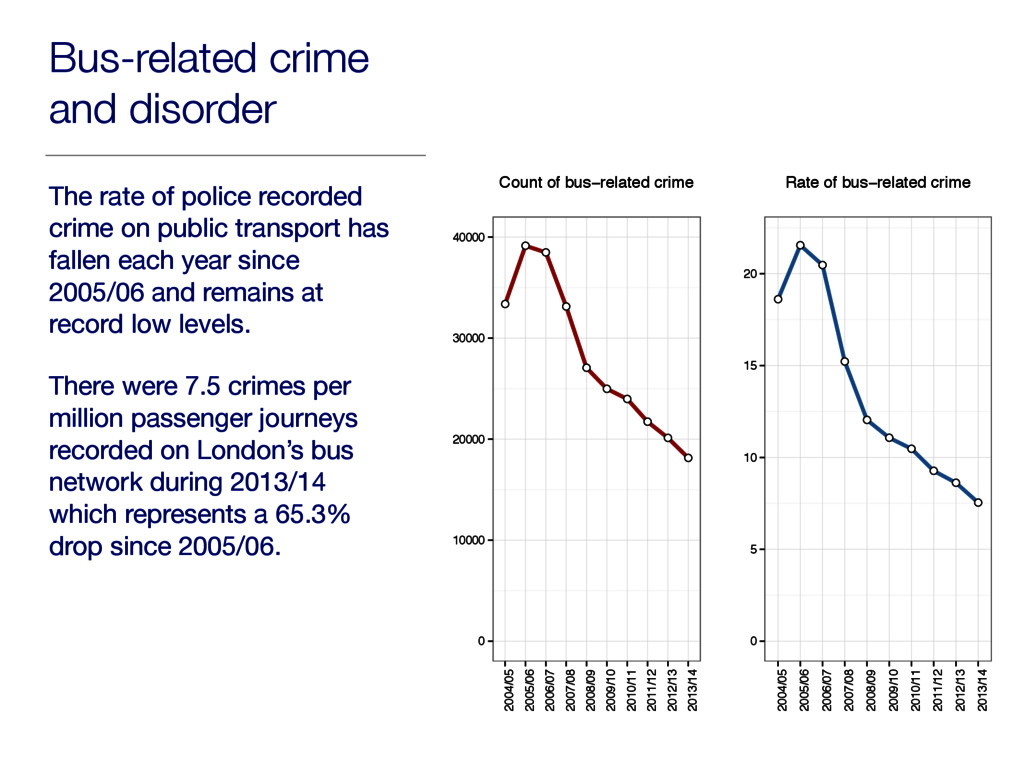
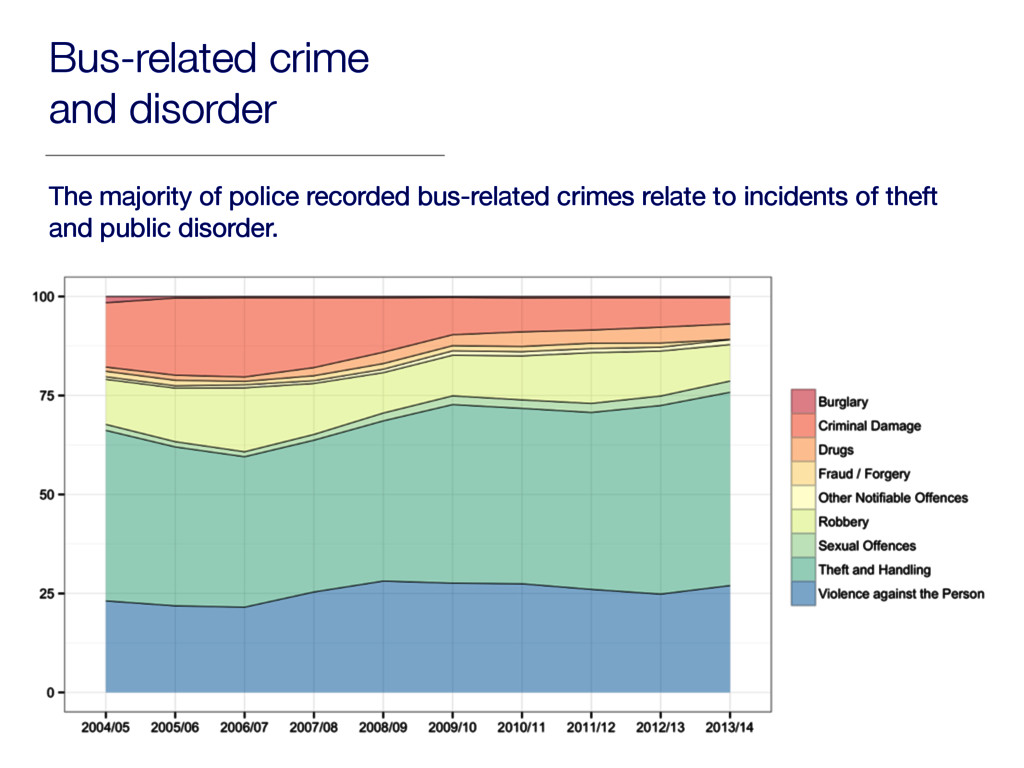
on public transport has fallen each year since 2005/06 and remains at record low levels. There were 7.5 crimes per million passenger journeys recorded on London’s bus network during 2013/14 which represents a 65.3% drop since 2005/06. • • • • • • • • • • 0 10000 20000 30000 40000 2004/05 2005/06 2006/07 2007/08 2008/09 2009/10 2010/11 2011/12 2012/13 2013/14 Count of bus−related crime • • • • • • • • • • 0 5 10 15 20 2004/05 2005/06 2006/07 2007/08 2008/09 2009/10 2010/11 2011/12 2012/13 2013/14 Rate of bus−related crime
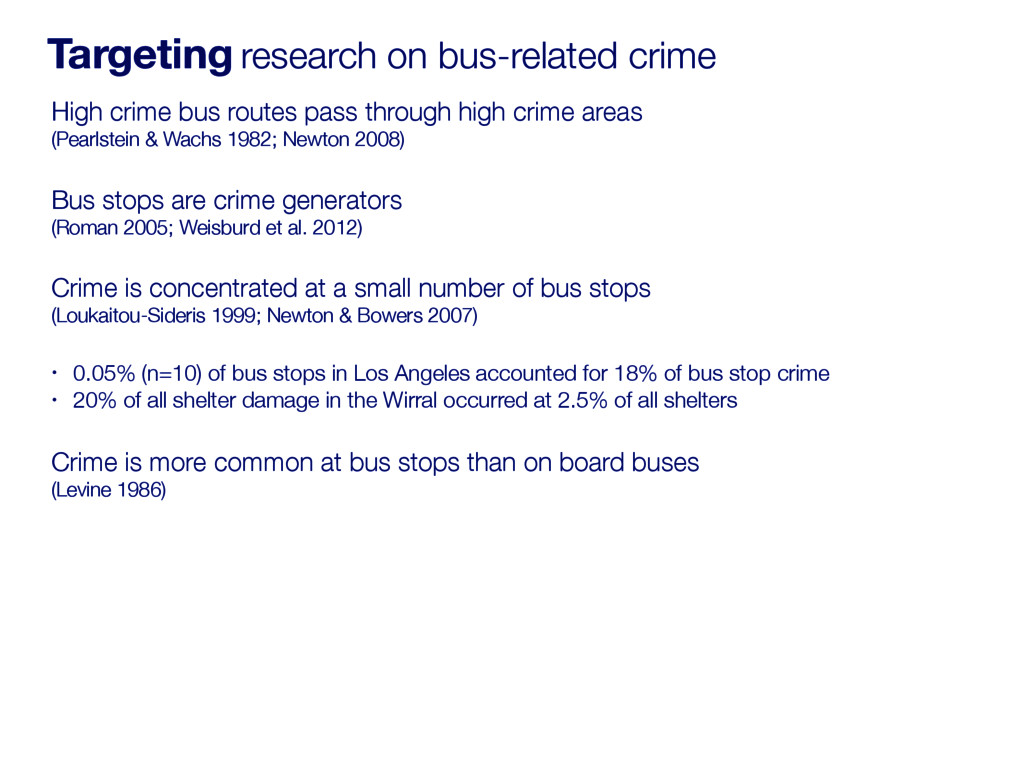
& Wachs 1982; Newton 2008) Bus stops are crime generators (Roman 2005; Weisburd et al. 2012) Crime is concentrated at a small number of bus stops (Loukaitou-Sideris 1999; Newton & Bowers 2007) • 0.05% (n=10) of bus stops in Los Angeles accounted for 18% of bus stop crime • 20% of all shelter damage in the Wirral occurred at 2.5% of all shelters Crime is more common at bus stops than on board buses (Levine 1986) Targeting research on bus-related crime
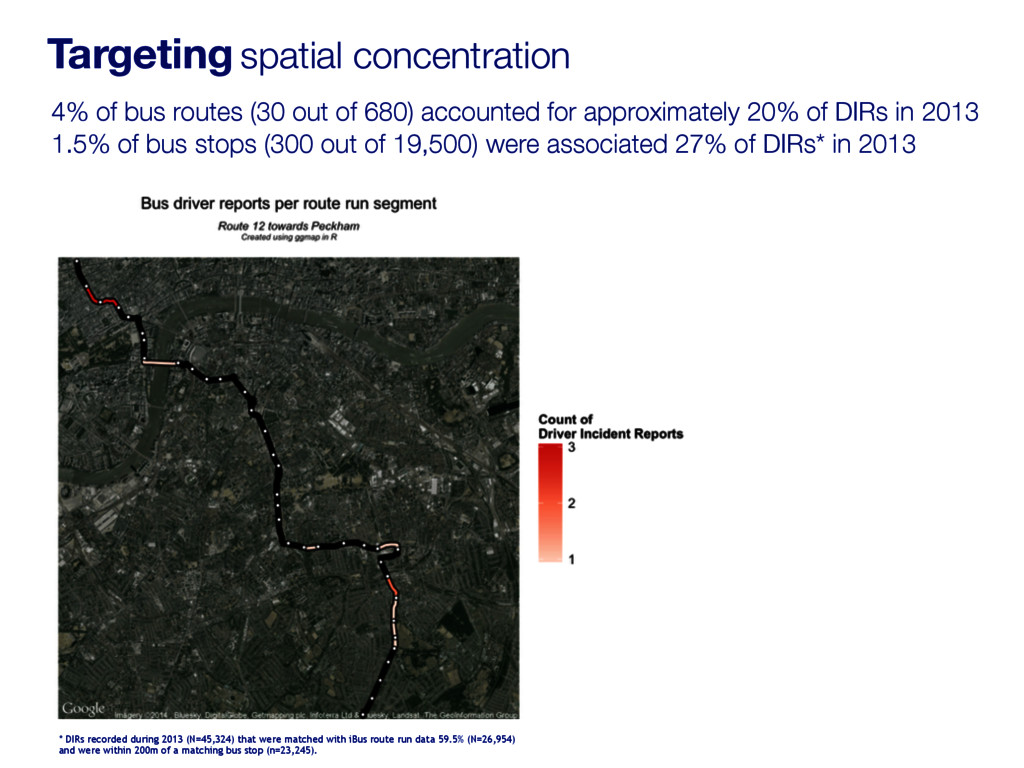
approximately 20% of DIRs in 2013 1.5% of bus stops (300 out of 19,500) were associated 27% of DIRs* in 2013 Targeting spatial concentration * DIRs recorded during 2013 (N=45,324) that were matched with iBus route run data 59.5% (N=26,954) and were within 200m of a matching bus stop (n=23,245).
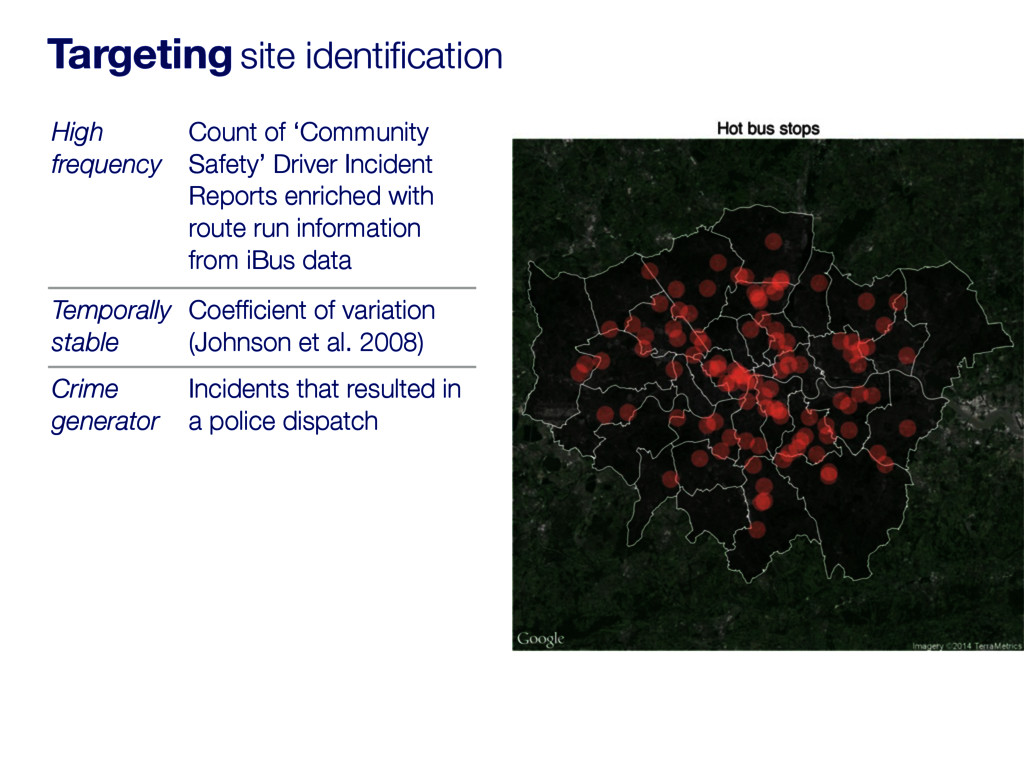
Incident Reports enriched with route run information from iBus data Temporally stable Coefficient of variation (Johnson et al. 2008) Crime generator Incidents that resulted in a police dispatch
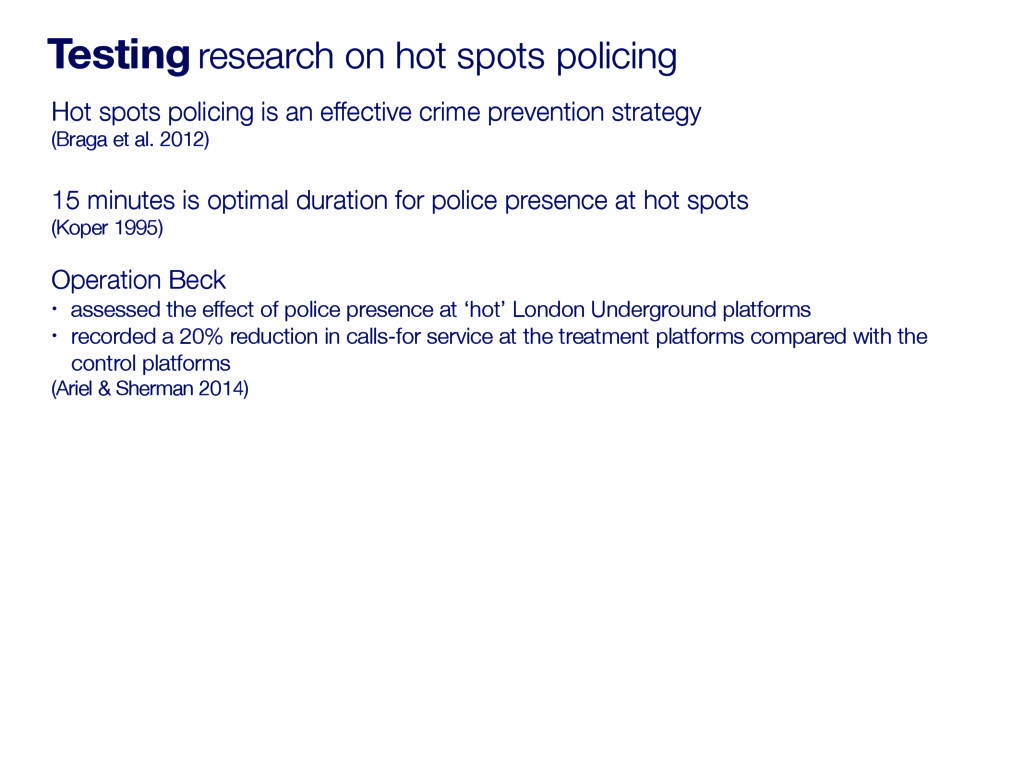
an effective crime prevention strategy (Braga et al. 2012) 15 minutes is optimal duration for police presence at hot spots (Koper 1995) Operation Beck • assessed the effect of police presence at ‘hot’ London Underground platforms • recorded a 20% reduction in calls-for service at the treatment platforms compared with the control platforms (Ariel & Sherman 2014)
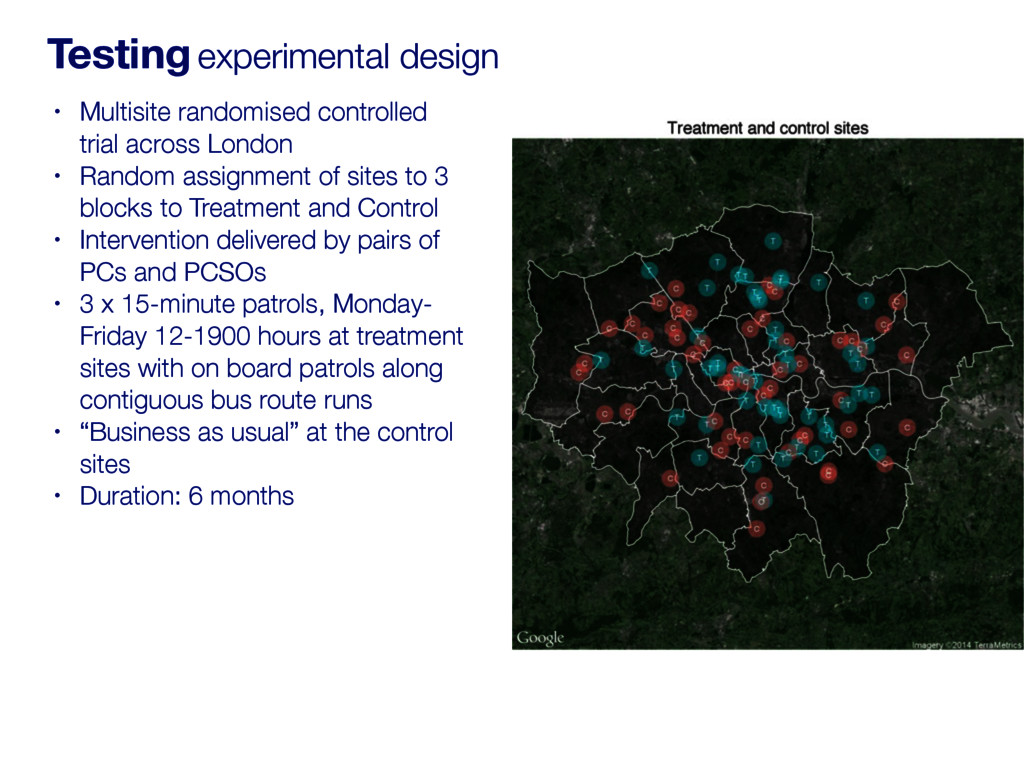
• Random assignment of sites to 3 blocks to Treatment and Control • Intervention delivered by pairs of PCs and PCSOs • 3 x 15-minute patrols, Monday- Friday 12-1900 hours at treatment sites with on board patrols along contiguous bus route runs • “Business as usual” at the control sites • Duration: 6 months
practices, they should generate and use internal evidence to track the daily delivery and effects of those practices, including public perceptions of police legitimacy (Sherman, 2013)
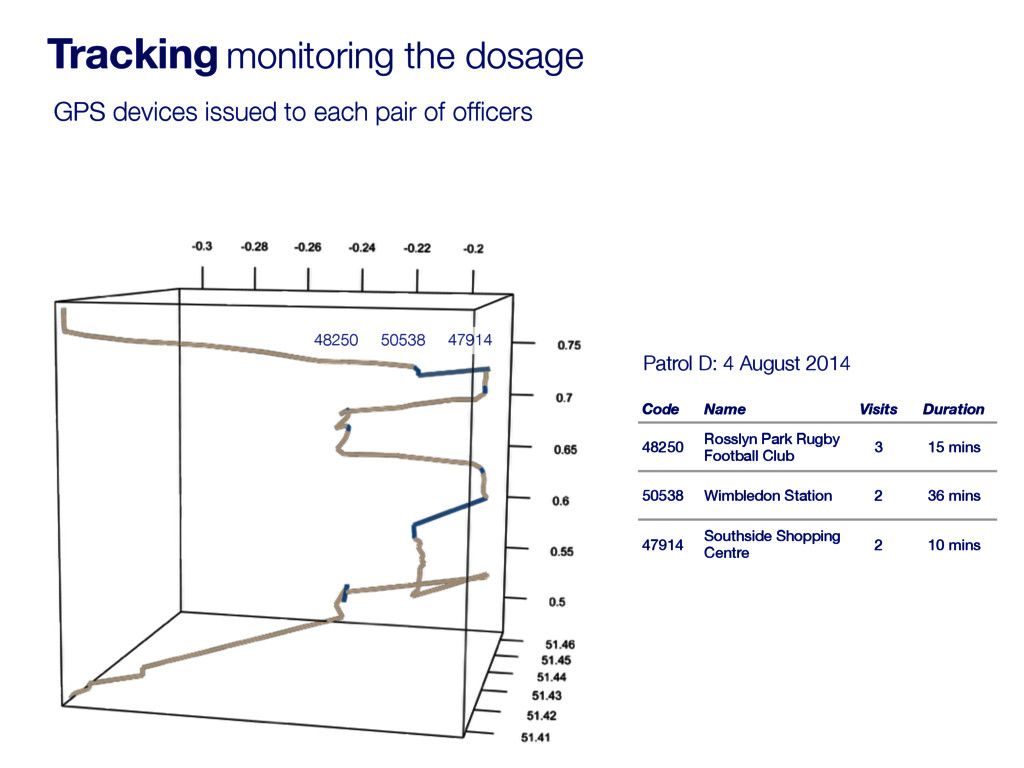
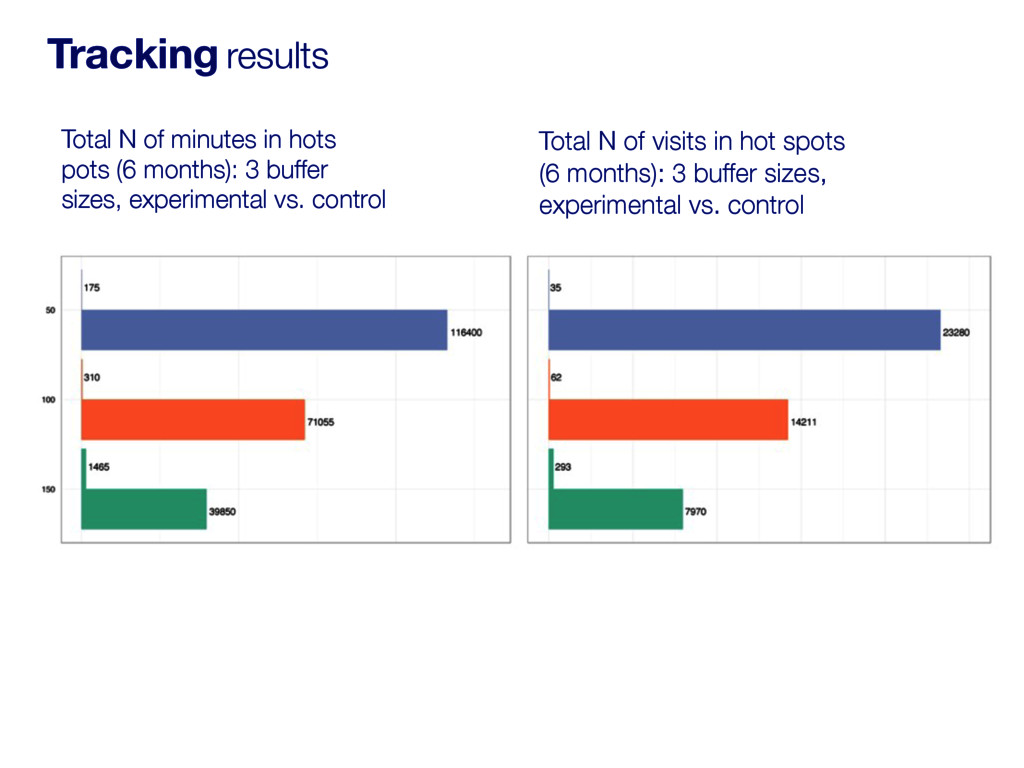
the dosage 48250 50538 47914 Code Name Visits Duration 48250 Rosslyn Park Rugby Football Club 3 15 mins 50538 Wimbledon Station 2 36 mins 47914 Southside Shopping Centre 2 10 mins Patrol D: 4 August 2014
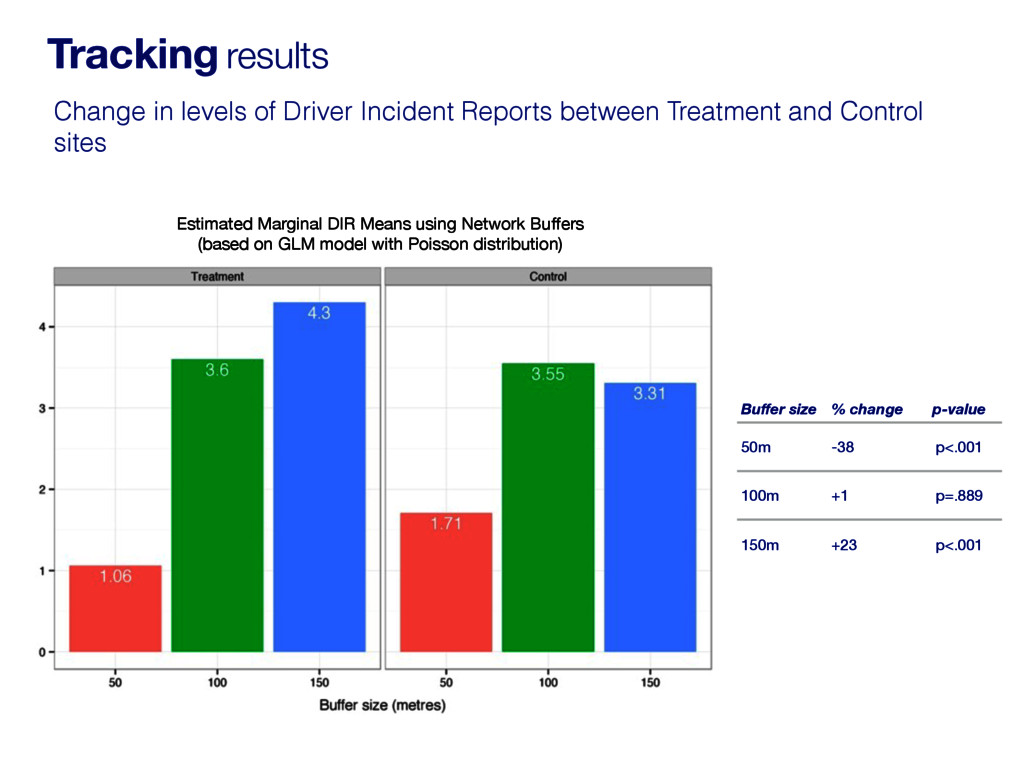
100m +1 p=.889 150m +23 p<.001 Change in levels of Driver Incident Reports between Treatment and Control sites Estimated Marginal DIR Means using Network Buffers (based on GLM model with Poisson distribution)