Upgrade to Pro — share decks privately, control downloads, hide ads and more …

Using Shiny to Visualise Crime and Collision Data

Henry Partridge
November 11, 2015

Using Shiny to Visualise Crime and Collision Data

Data Visualisation Summit, London, 11-12 November 2015.

The slides were created in R using ioslides and R Markdown.

Henry Partridge

November 11, 2015
Tweet

More Decks by Henry Partridge

Other Decks in Business

Transcript

  1. Using Shiny to visualise crime and collision data Henry Partridge

    Data Visualisation Summit, 11 November 2015
  2. Outline R What is R? Why use R? Shiny What

    is Shiny? The structure of a Shiny app A simple Shiny app Shiny app development at TfL · · · · · · · ·
  3. About me Data analyst at Transport for London Background in

    philosophy and crime science Programming in R for two years · · ·
  4. R

  5. What is R? is a programming language for statistical analysis

    and data visualisation. Created by Ross Ihaka and Robert Gentleman (University of Auckland). Released in 1995. Implements the S programming language created at Bell Labs. Companies like Google, Facebook and the New York Times use it. · · · ·
  6. Why use R? Leading tool for statistics, data analysis, and

    machine learning Cutting edge analytics: over 7,000 user-contributed packages available on finance, genomics, animal tracking, crime analysis … Powerful graphics and data visualisations: used by New York Times, FiveThirtyEight etc Open source: no vendor lock-in Reproducibility: code can be shared and the results repeated Transparency: explicitly documents all the steps of your analyses Automation: analyses can be run and re-run with new and existing data sets Support network: worldwide community of developers and users · · · · · · · ·
  7. What is Shiny? An R package developed by RStudio (https://www.rstudio.com)

    that allows data analysts to analyse, visualise and share their results with non-R users. Interactive web applications connected to an R session. No knowledge of HTML, CSS, and JavaScript is required but web apps are customisable and extensible. Integrates with JavaScript libraries. Uses a reactive programming framework. An input is sent to an R process which generates a plot in a web browser. · · · ·
  8. The structure of a Shiny app Each Shiny app has

    two components: a ui script and a server script. The ui specifies the user interface elements, e.g. HTML widgets like dropdowns, sliders, radio buttons etc whilst the server specifies how to generate the output, e.g. table, plot, text. A single app.R file contains both components: You can also use separate ui.R and server.R files. library(shiny) ui <- fluidPage() server <- function(input, output) {} shinyApp(ui = ui, server = server)
  9. The code library(shiny) library(png) ; library(grid) ; library(ggplot2) ; library(DT)

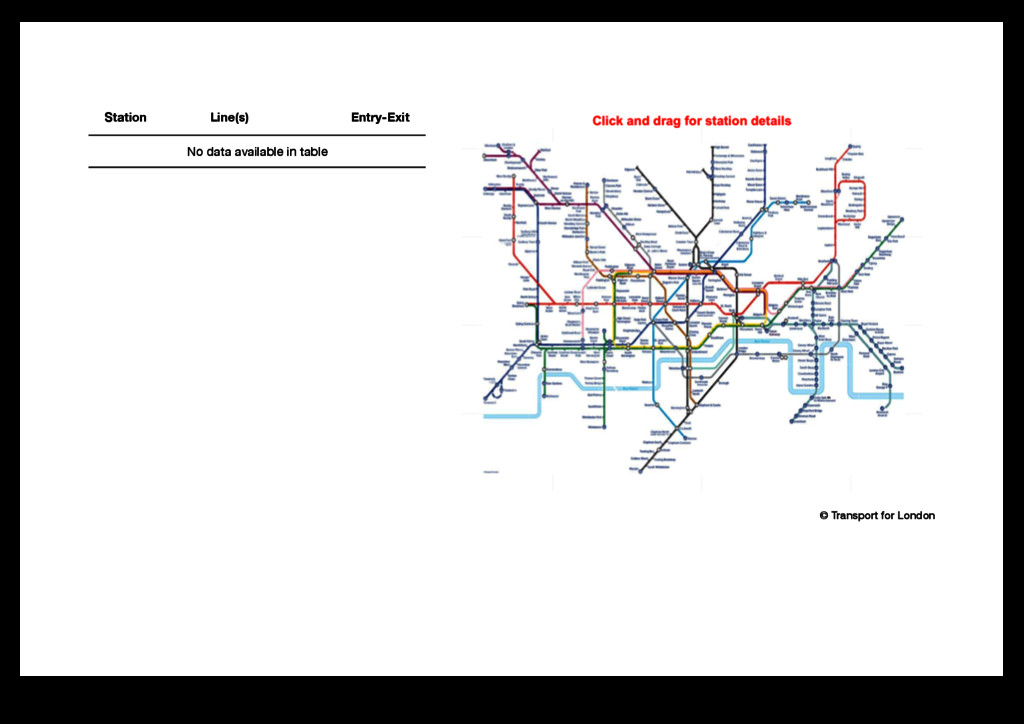
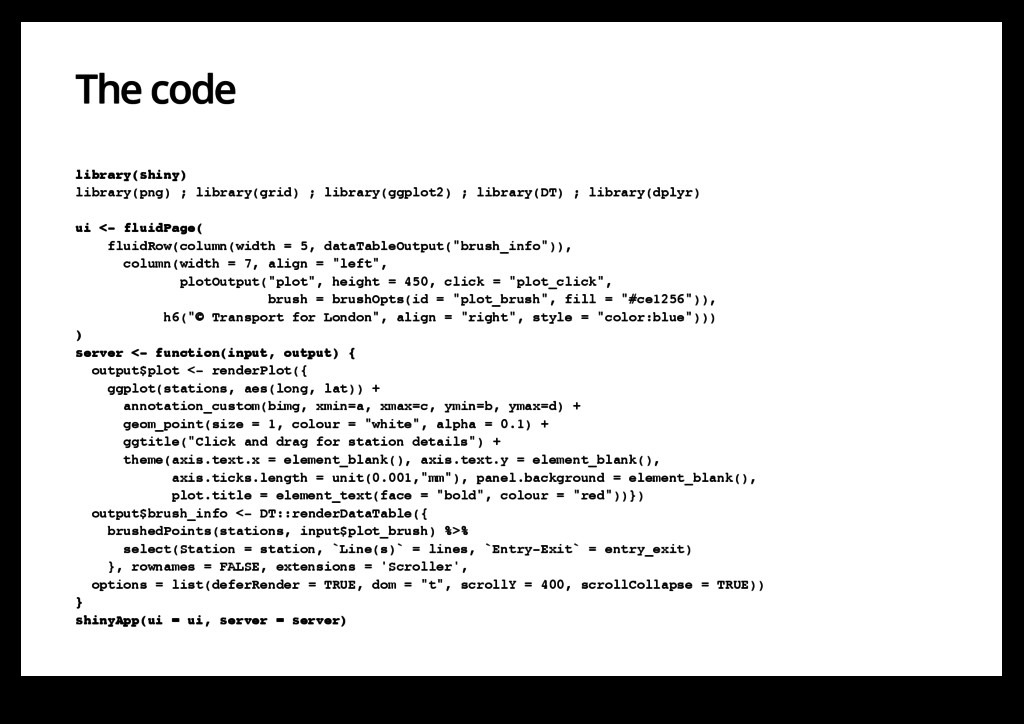
    ; library(dplyr) # data loading and raster rendering code removed for brevity ui <- fluidPage( fluidRow(column(width = 5, dataTableOutput("brush_info")), column(width = 7, align = "left", plotOutput("plot", height = 450, click = "plot_click", brush = brushOpts(id = "plot_brush", fill = "#ce1256")), h6("© Transport for London", align = "right", style = "color:blue"))) ) server <- function(input, output) { output$plot <- renderPlot({ ggplot(stations, aes(long, lat)) + annotation_custom(bimg, xmin=a, xmax=c, ymin=b, ymax=d) + geom_point(size = 1, colour = "white", alpha = 0.1) + ggtitle("Click and drag for station details") + theme(axis.text.x = element_blank(), axis.text.y = element_blank(), axis.ticks.length = unit(0.001,"mm"), panel.background = element_blank(), plot.title = element_text(face = "bold", colour = "red"))}) output$brush_info <- DT::renderDataTable({ brushedPoints(stations, input$plot_brush) %>% select(Station = station, `Line(s)` = lines, `Entry-Exit` = entry_exit) }, rownames = FALSE, extensions = 'Scroller', options = list(deferRender = TRUE, dom = "t", scrollY = 400, scrollCollapse = TRUE)) } shinyApp(ui = ui, server = server)
  10. Crime Harm Index Harm is calculated by multiplying the crime

    by the number of days in prison that crime would attract according to the sentencing guideline (Sherman et al., 2014). Bus-related Theft is the highest volume category of crime but Robbery is the most harmful.
  11. Sentiment analysis of Night Tube tweets Geotagged tweets that mention

    the Night Tube were mined and plotted according to their sentiment, an estimate of the emotion contained in the tweet's text.
  12. Behaviour of electronic points on the railway Dashboard built to

    interrogate the behaviour of electronic points to help track pre-failure incidents. How long point took to move Mean current needed to move the point · ·
  13. STATS19_scanner Web app designed to allow users to interrogate road

    casualties reported in Greater London between 2005 and 2014.
  14. STATS19_scanner R code is available on GitHub (https://github.com/cat-lord/STATS19_scanner) for users

    to 'fork' and modify change the data re-design the user interface alter the display of the results · · · ·
  15. Advantages of using R and Shiny Process of loading, cleaning,

    manipulating and visualising data possible entirely within R. Lowers barrier of entry to web development. R bindings for JavaScript visualization libraries becoming available all the time. Open source code encourages collaboration. · · · ·
  16. The future of R and Shiny at TfL The R

    community within TfL is growing fast. Increasing demand for developing Shiny apps (and interactive documents) for internal and external use. Promoting external collaboration in Shiny app development. · · ·