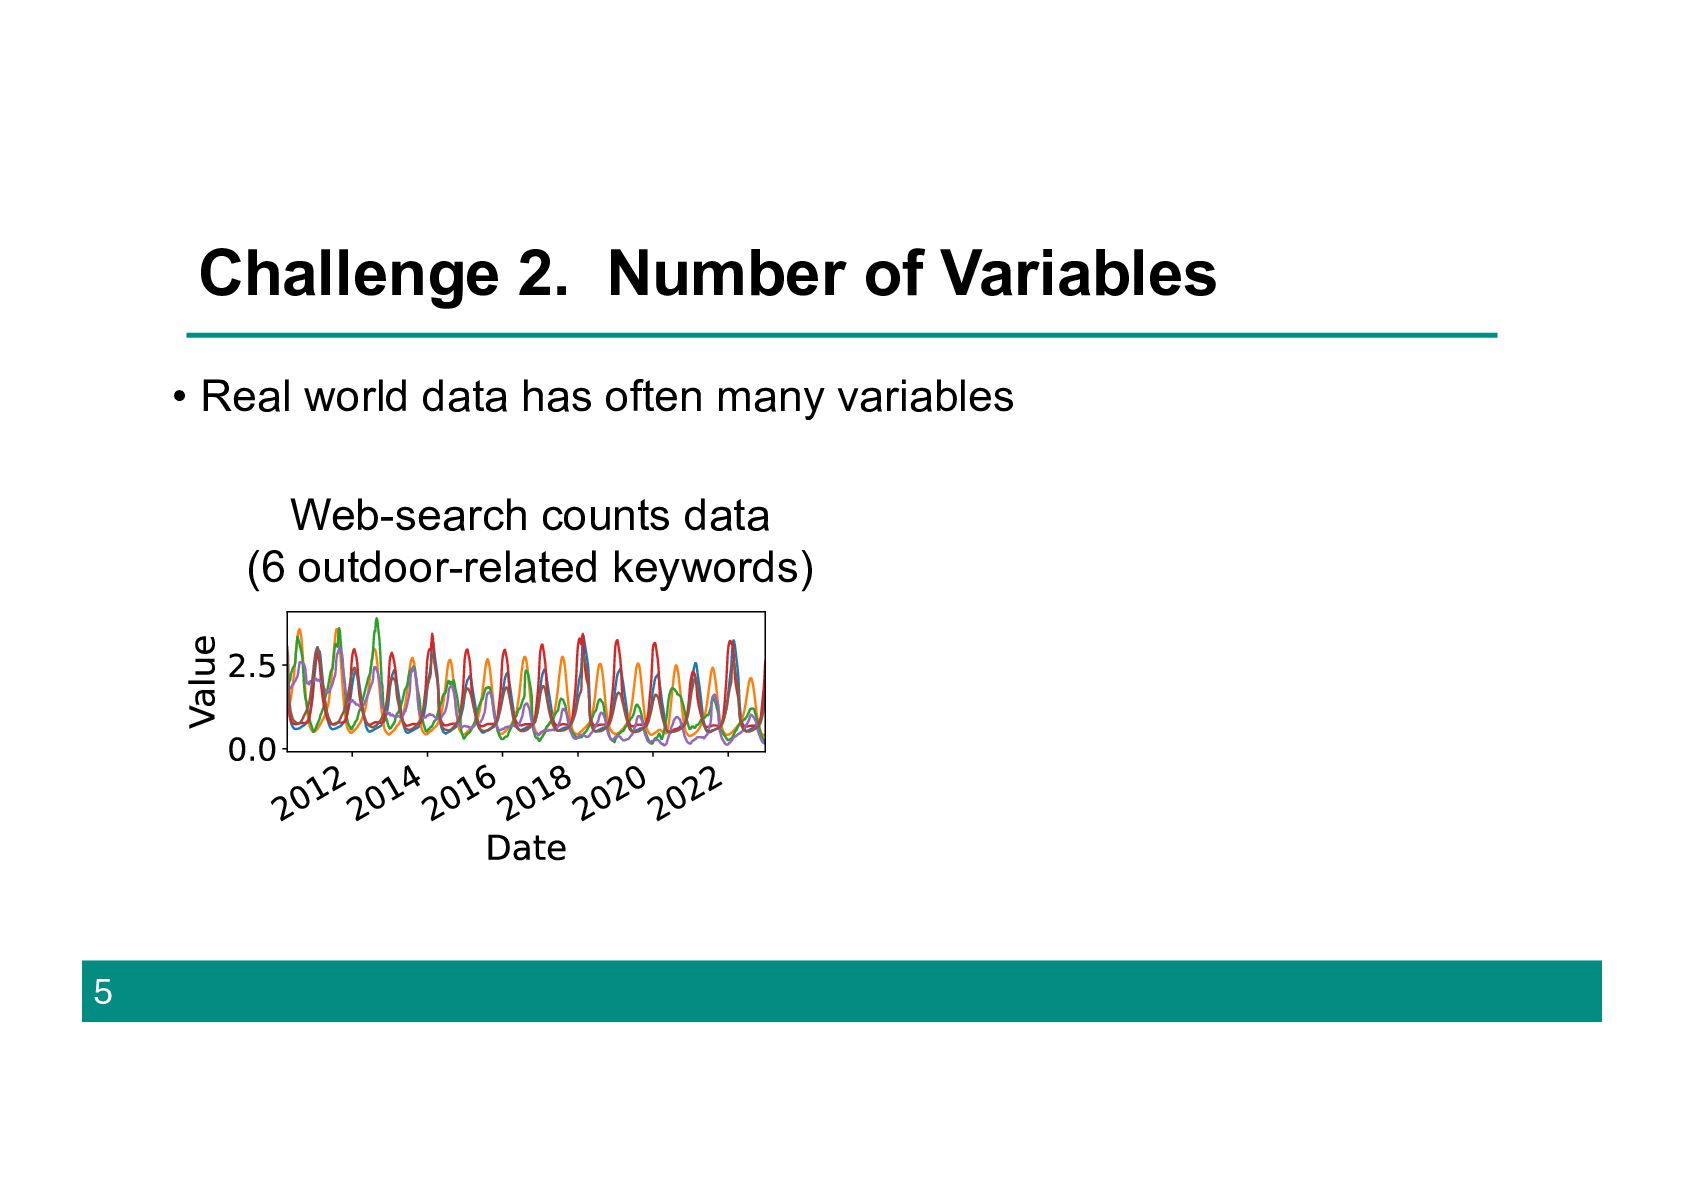
often many variables 5 (i) Original Sequence (ii) Latent Dynamics A (left), F (right) (iv) Query Component Web-search counts data (6 outdoor-related keywords)
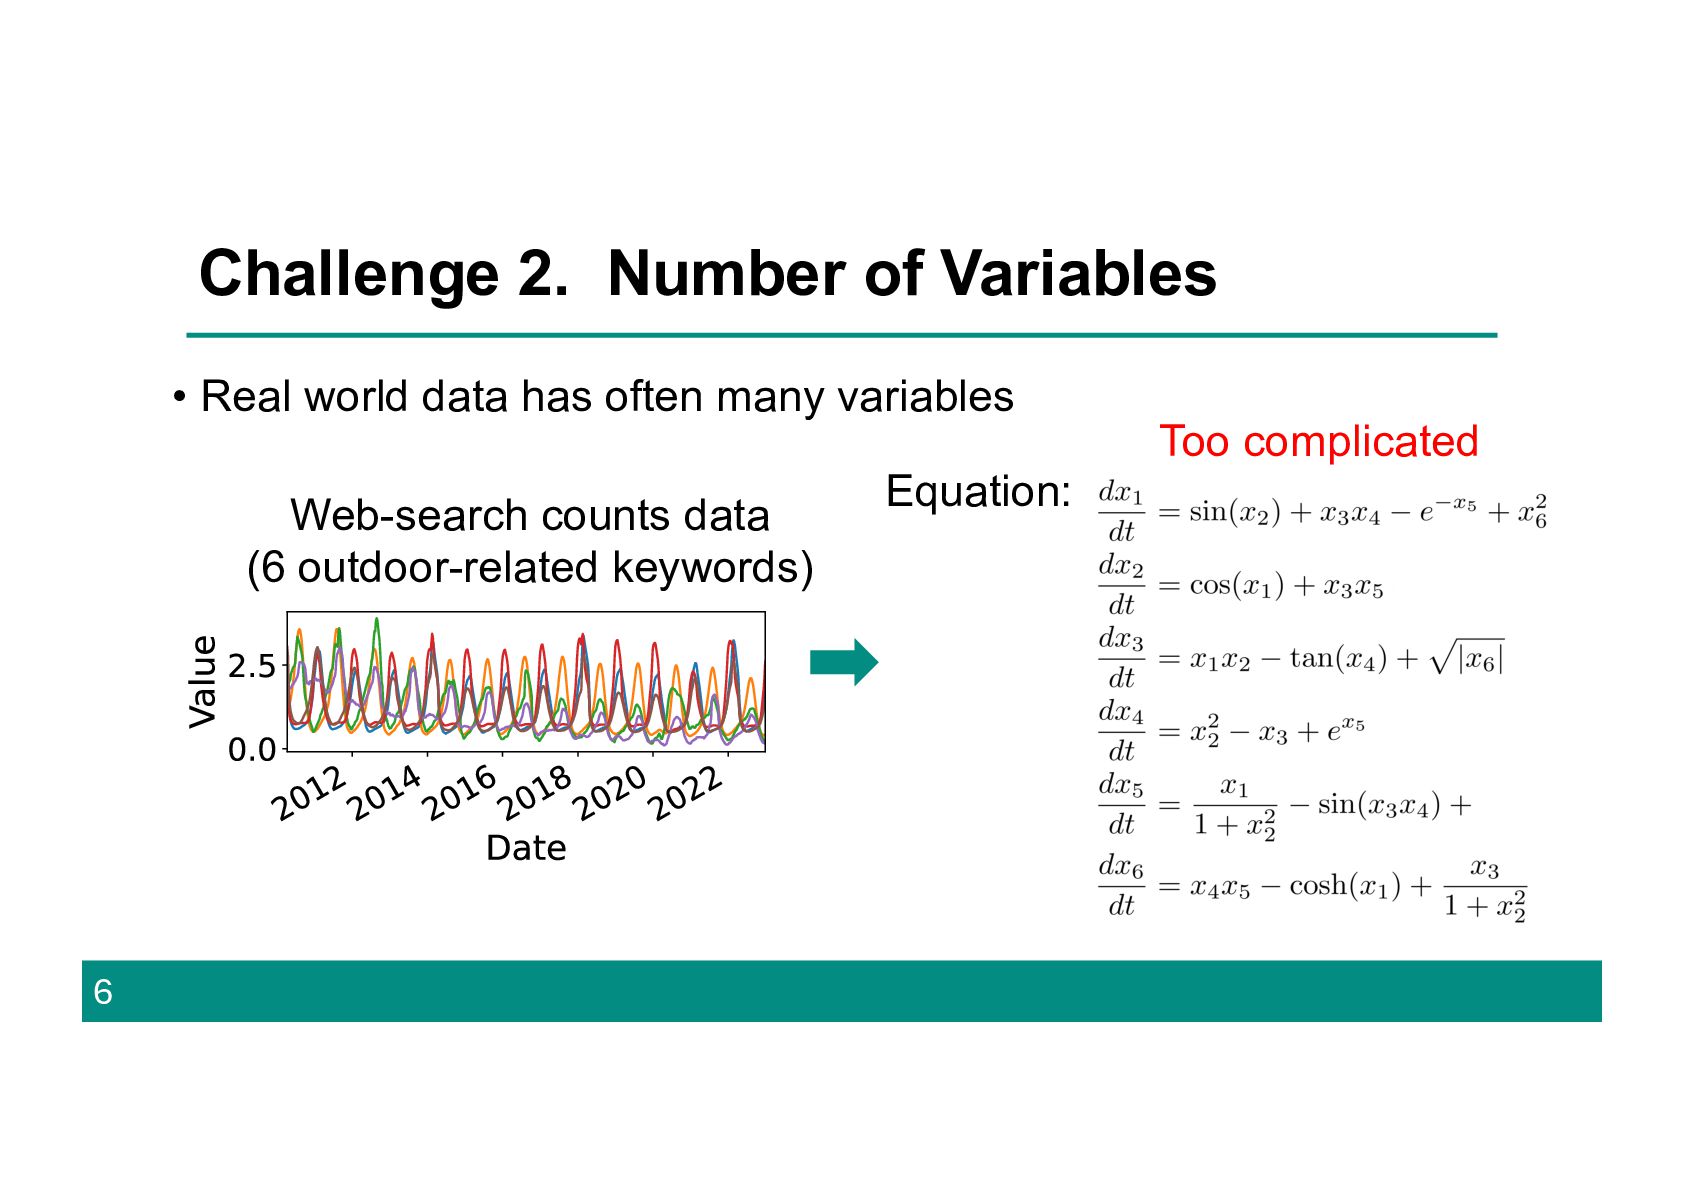
often many variables 6 Equation: Too complicated (i) Original Sequence (ii) Latent Dynamics A (left), F (right) (iv) Query Component Web-search counts data (6 outdoor-related keywords)
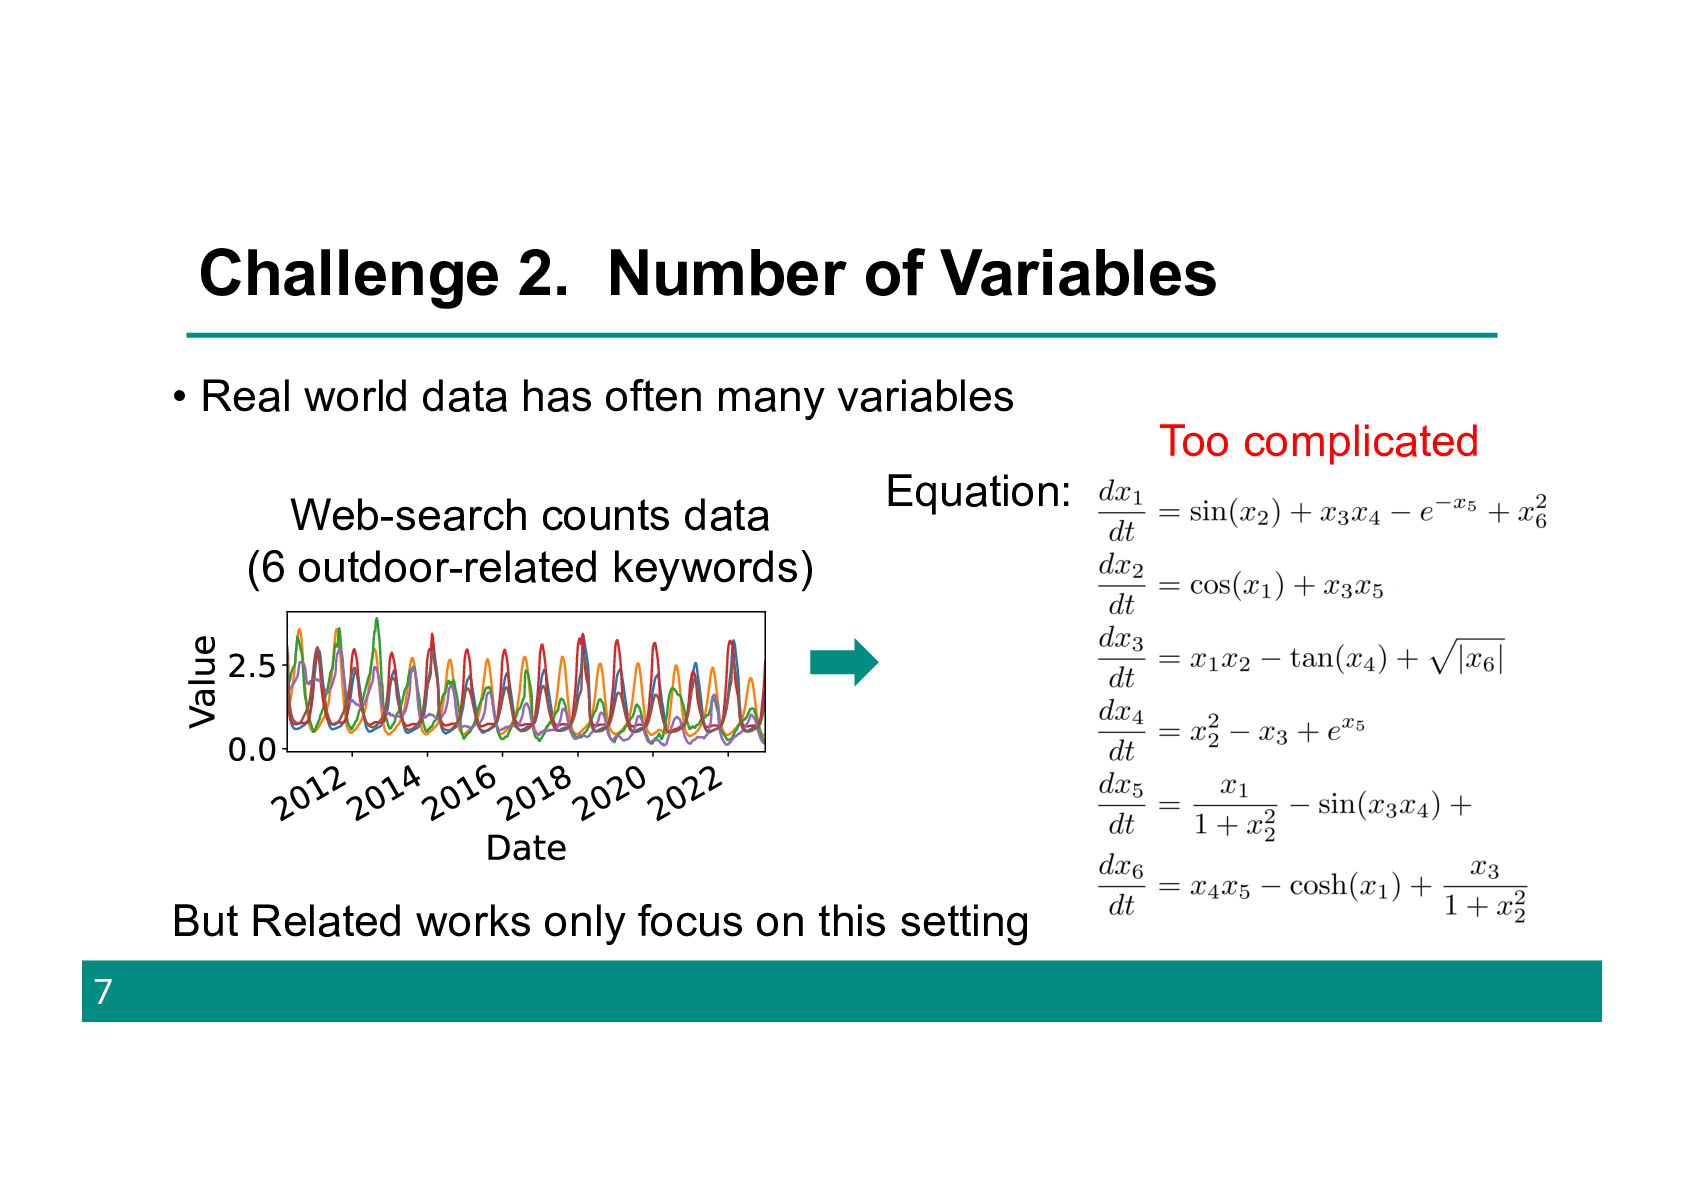
often many variables 7 Equation: Too complicated But Related works only focus on this setting (i) Original Sequence (ii) Latent Dynamics A (left), F (right) (iv) Query Component Web-search counts data (6 outdoor-related keywords)
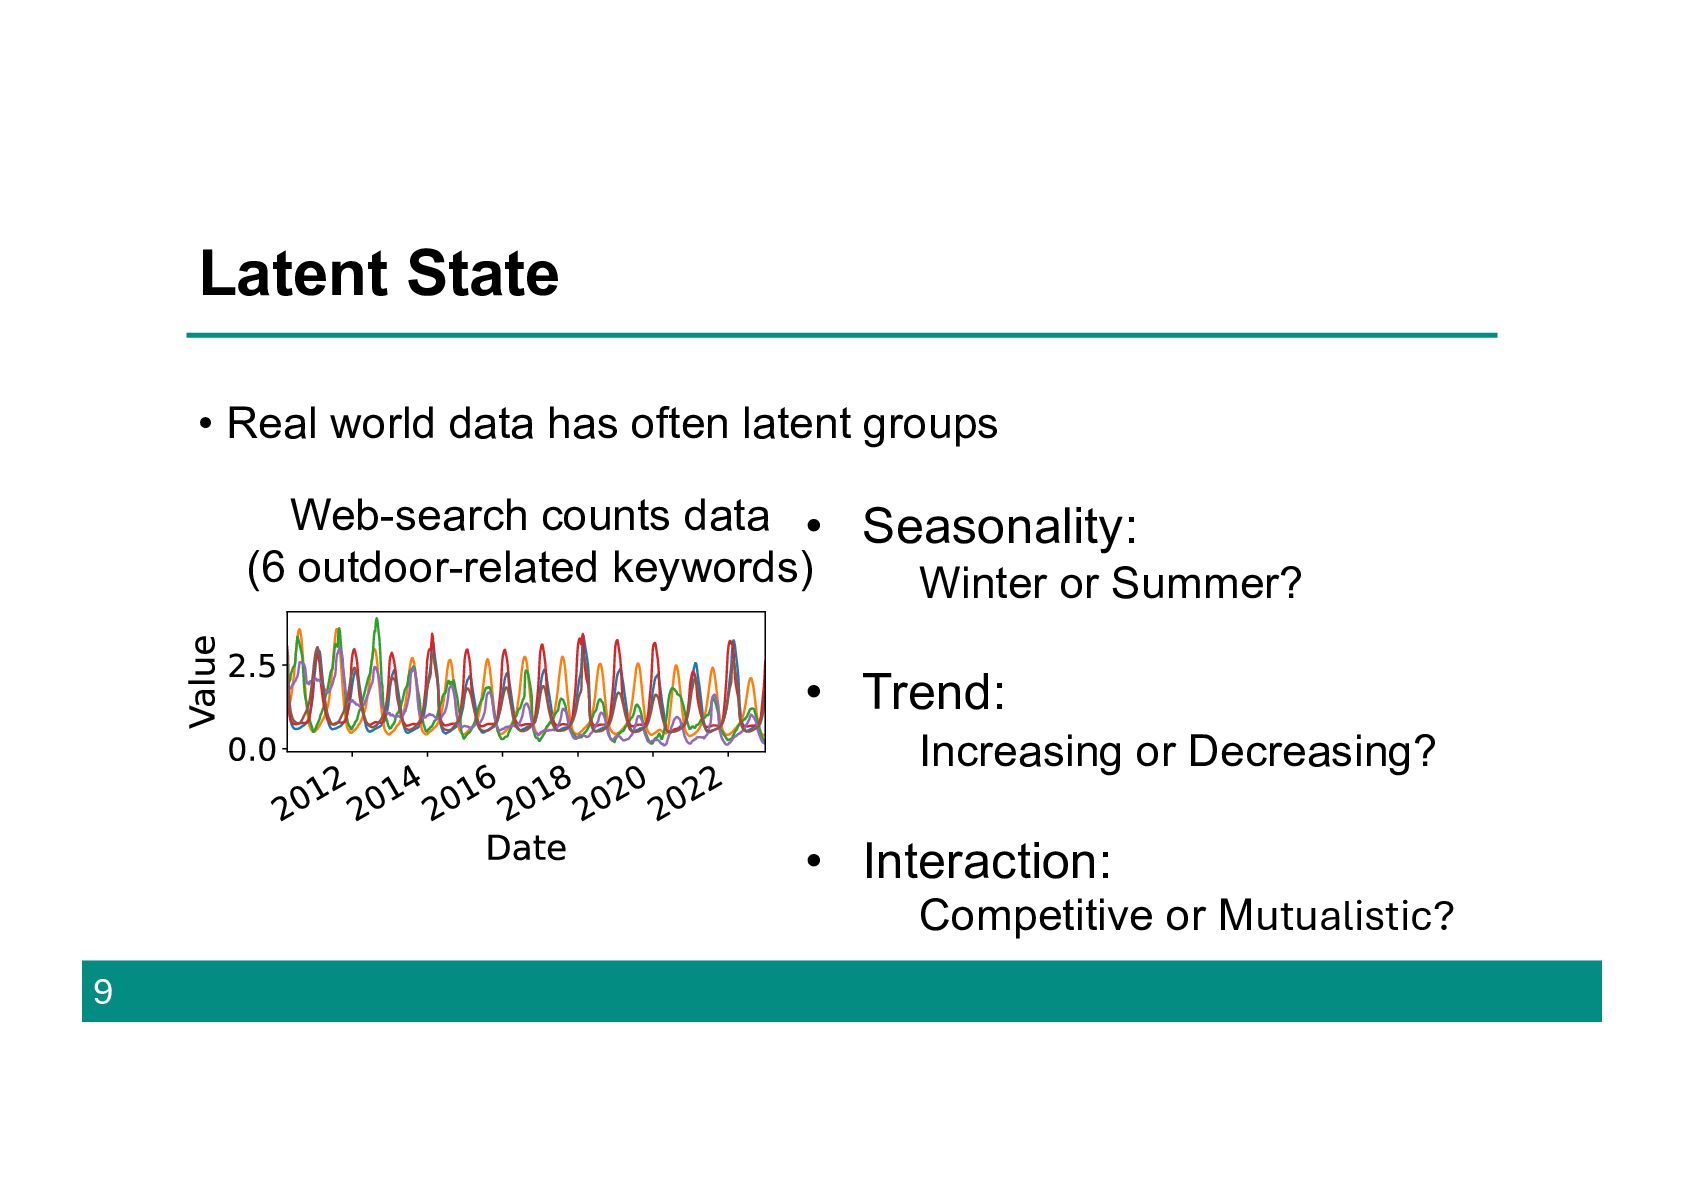
9 • Seasonality: Winter or Summer? • Trend: Increasing or Decreasing? • Interaction: Competitive or Mutualistic? (i) Original Sequence (ii) Latent Dynamics A (left), F (right) (iv) Query Component Web-search counts data (6 outdoor-related keywords)
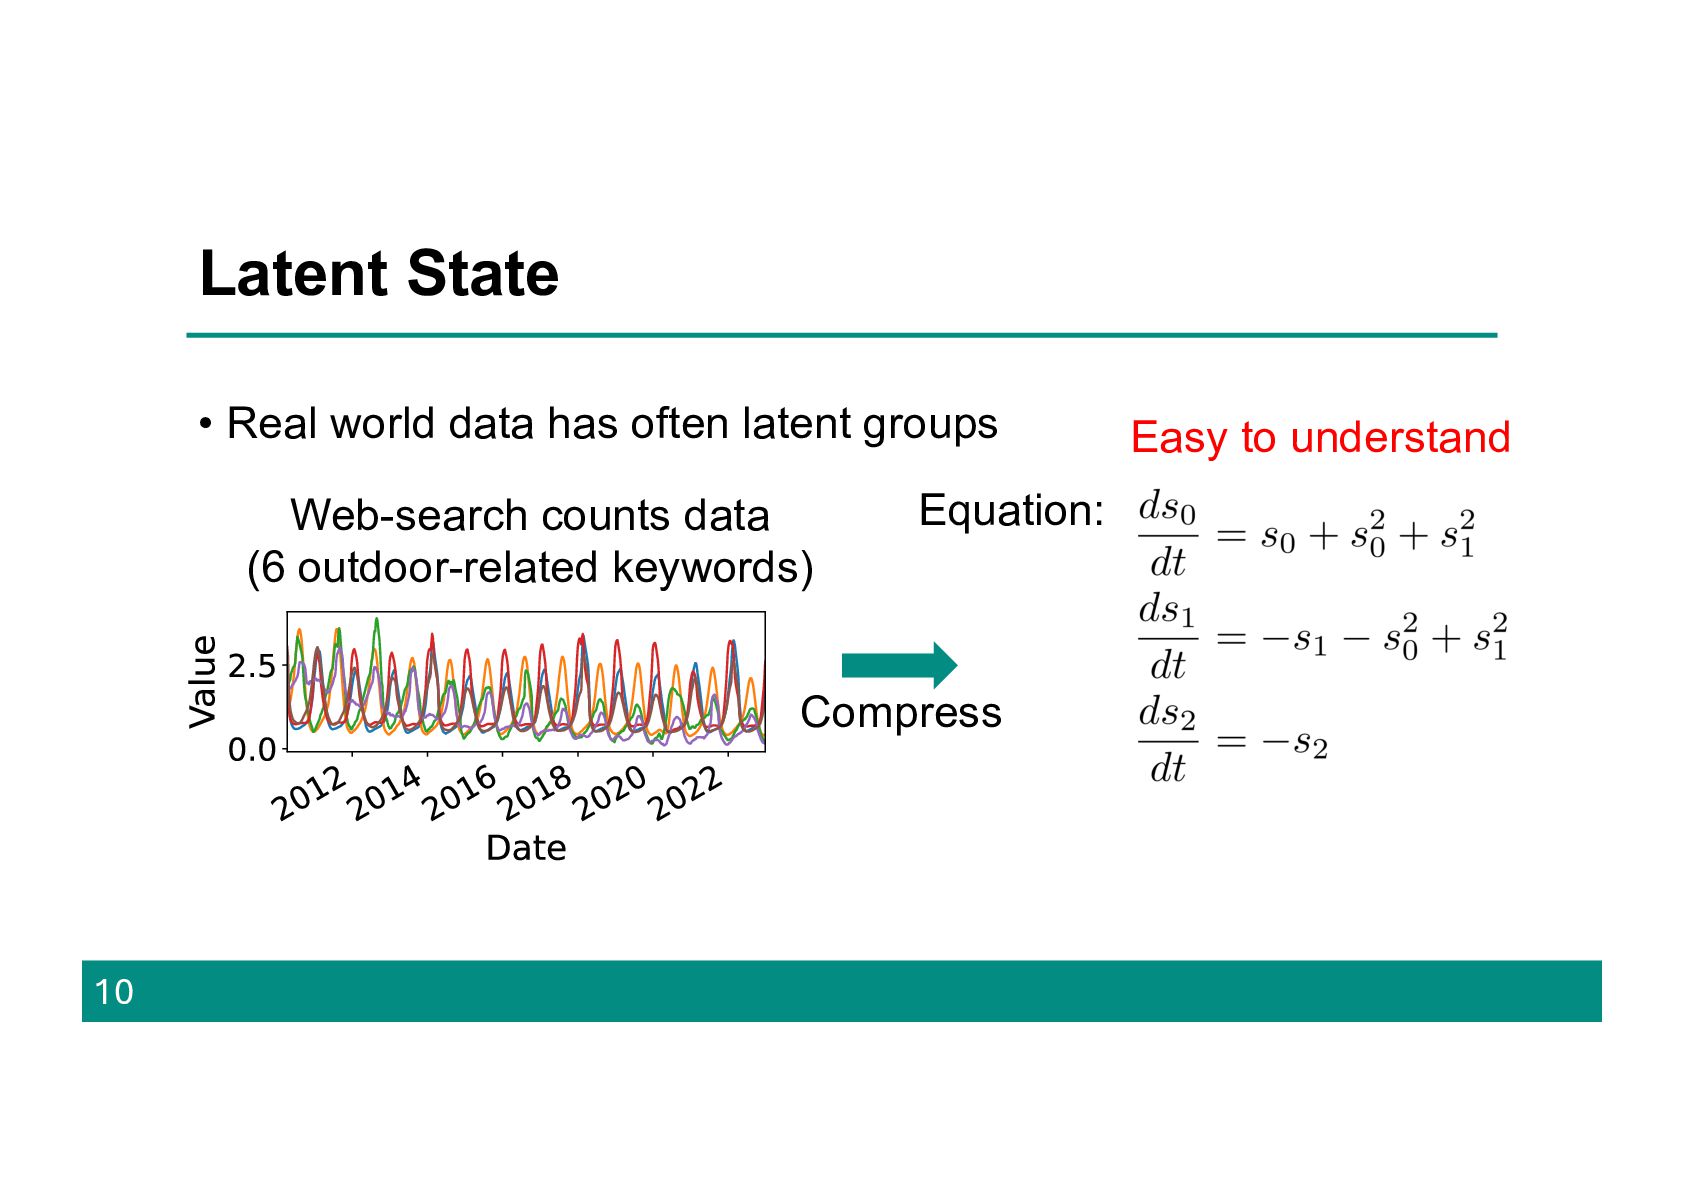
10 Compress Equation: Easy to understand (i) Original Sequence (ii) Latent Dynamics A (left), F (right) (iv) Query Component Web-search counts data (6 outdoor-related keywords)
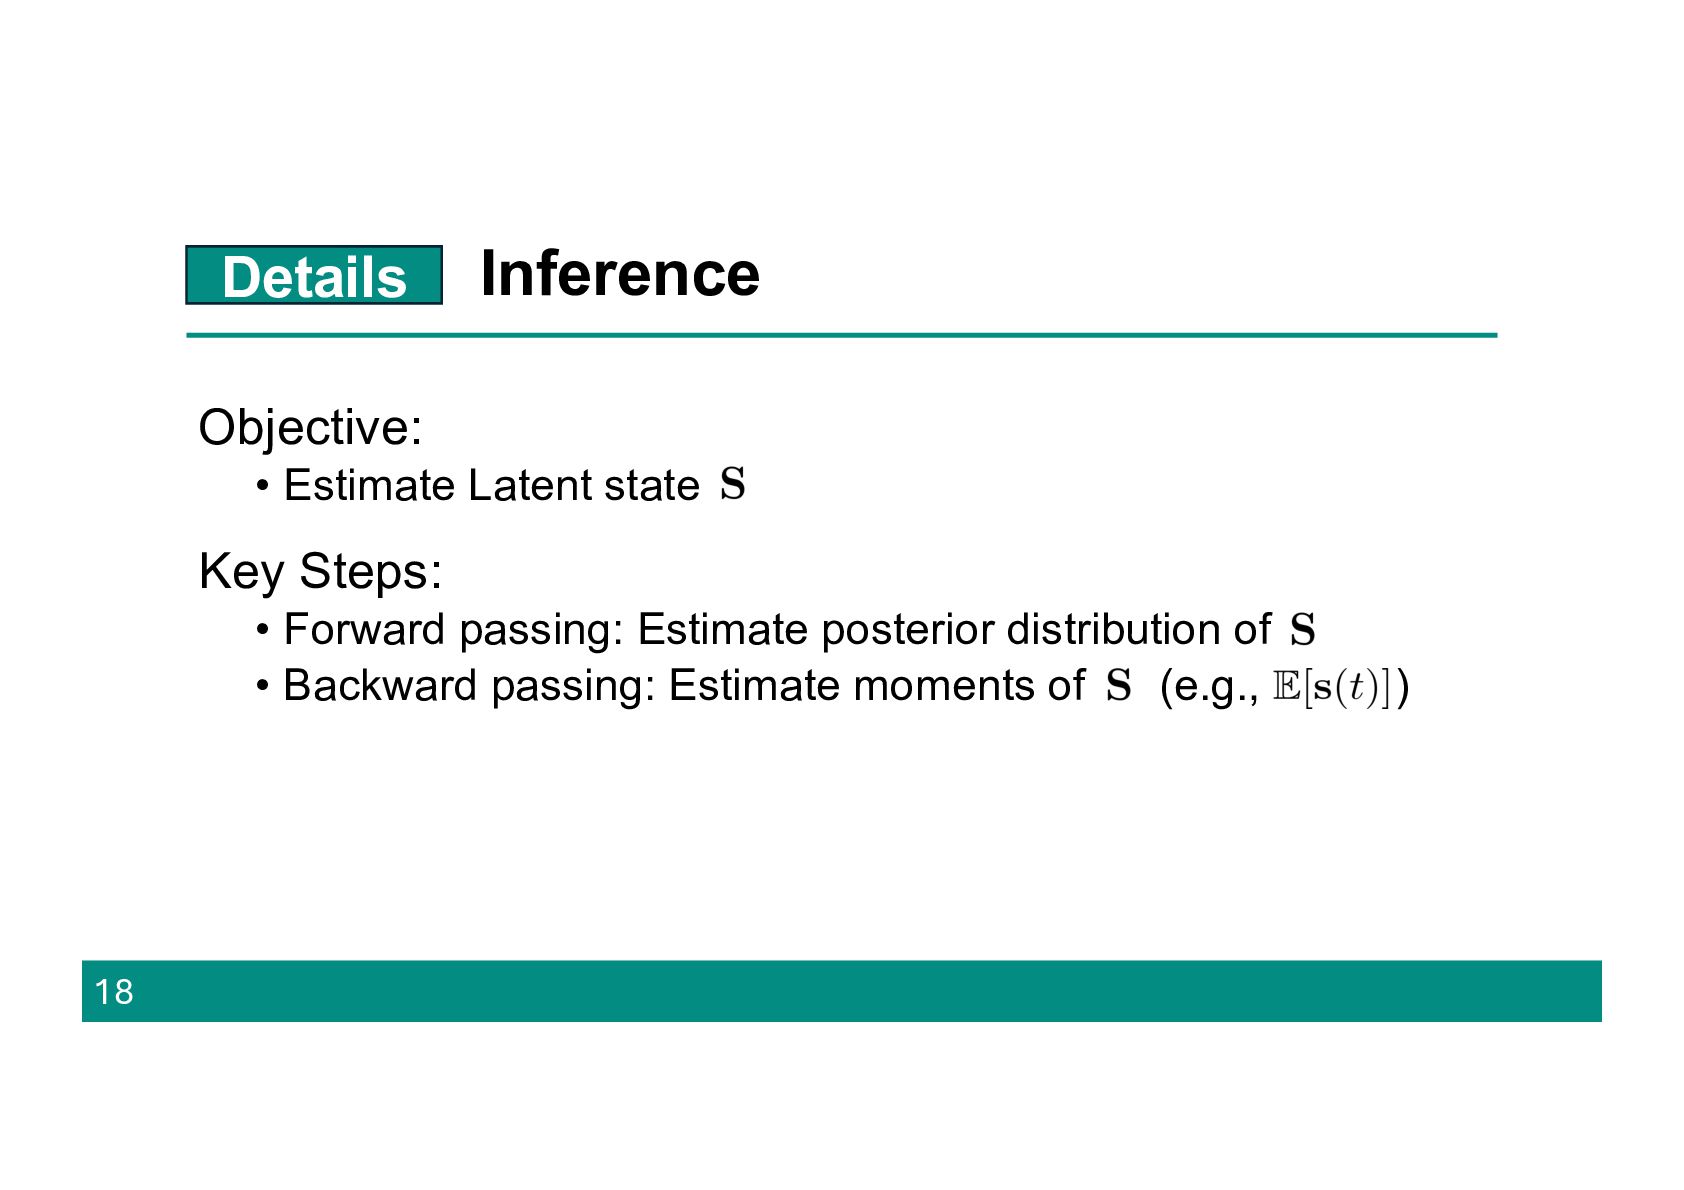
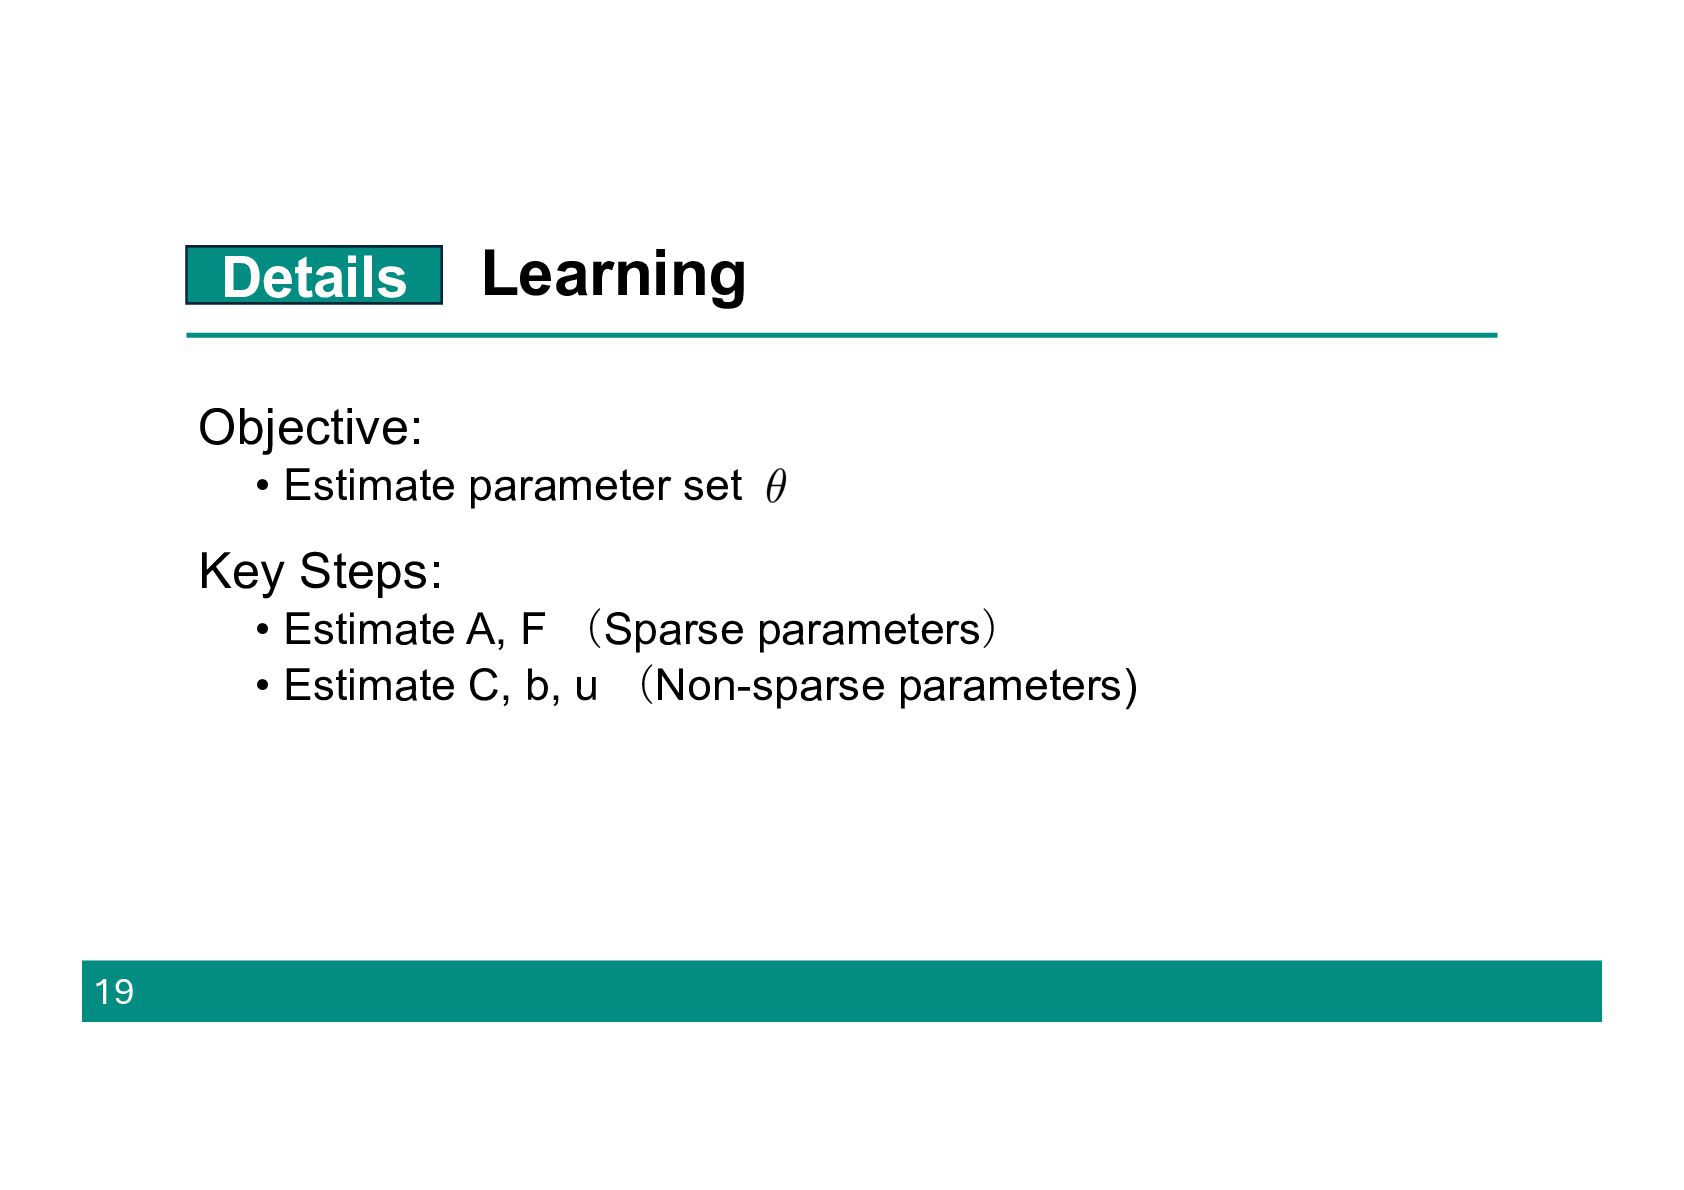
components • Latent non-linear dynamical system • Criterion for model complexity Our Algorithm consists of two sub-algorithms • Inference: Estimate latent states • Learning: Estimate parameter set 13
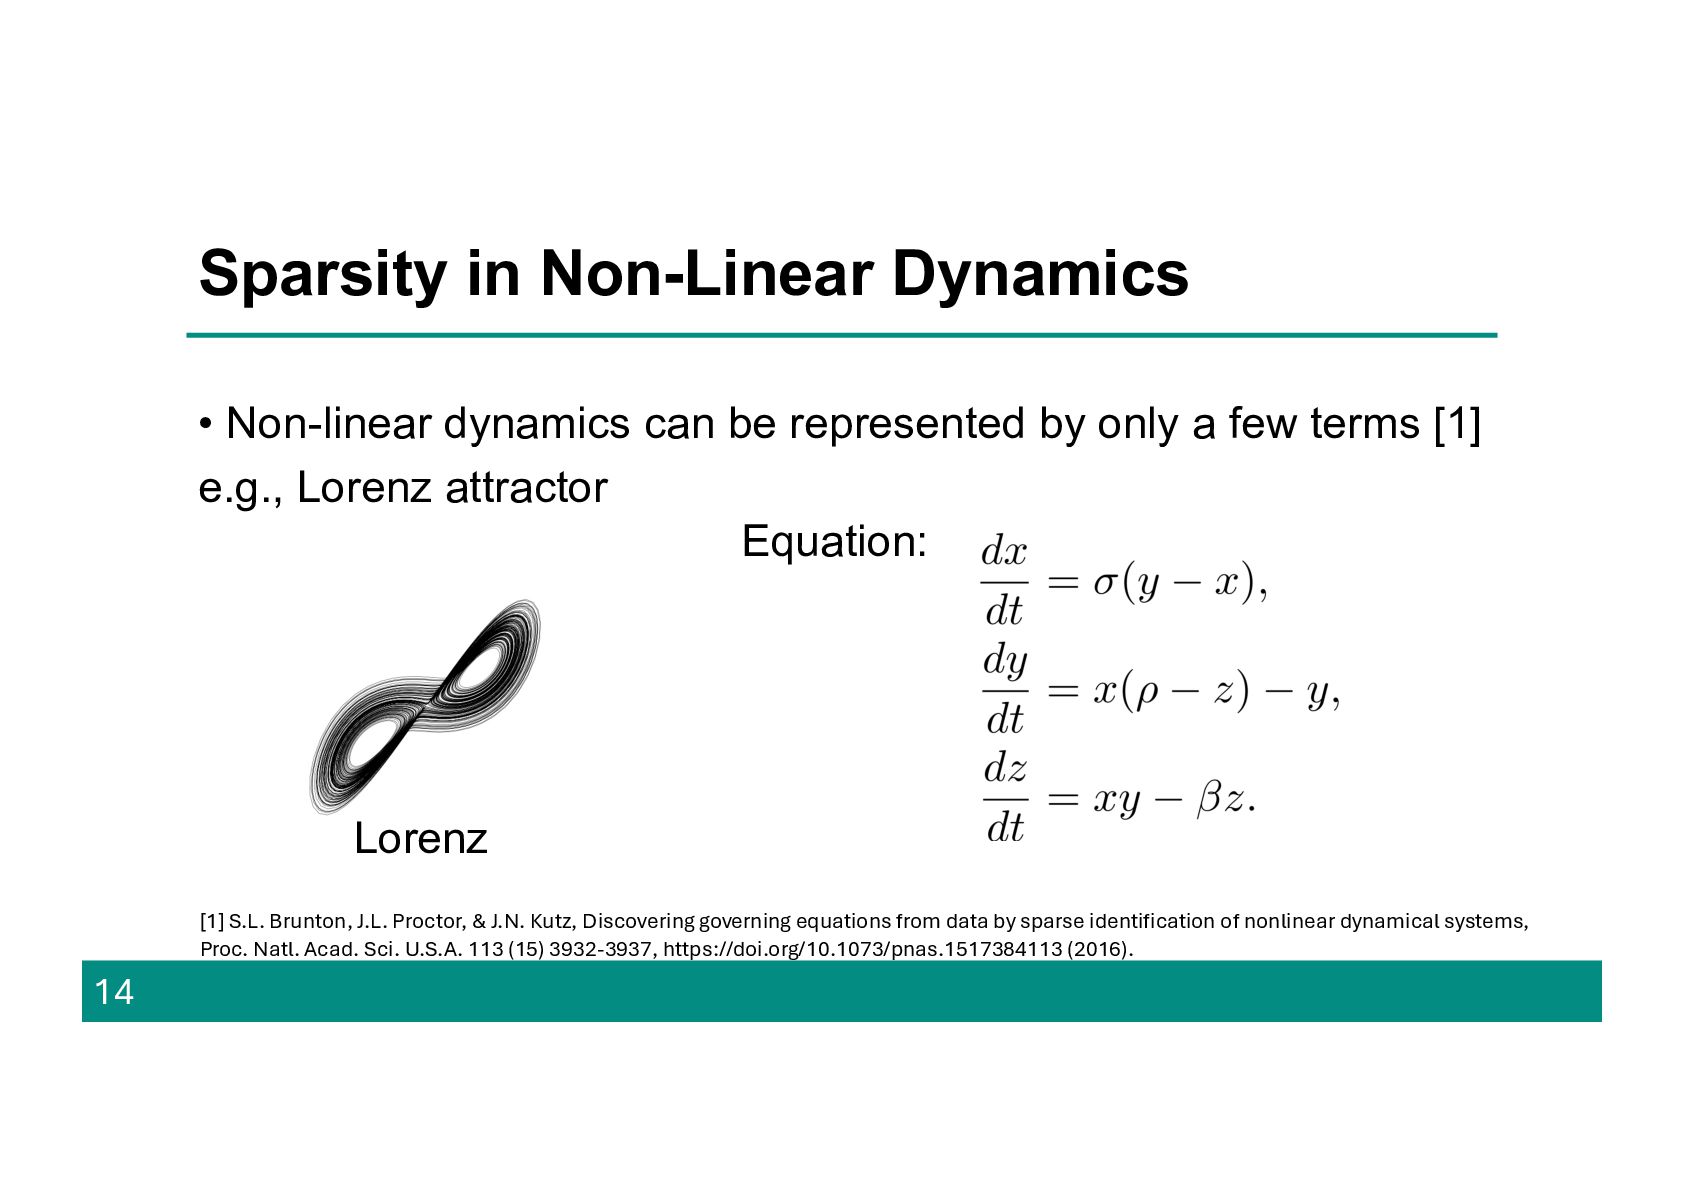
by only a few terms [1] e.g., Lorenz attractor 14 Lorenz Rossler Halvorsen Arneodo [1] S.L. Brunton, J.L. Proctor, & J.N. Kutz, Discovering governing equations from data by sparse identification of nonlinear dynamical systems, Proc. Natl. Acad. Sci. U.S.A. 113 (15) 3932-3937, https://doi.org/10.1073/pnas.1517384113 (2016). Equation:
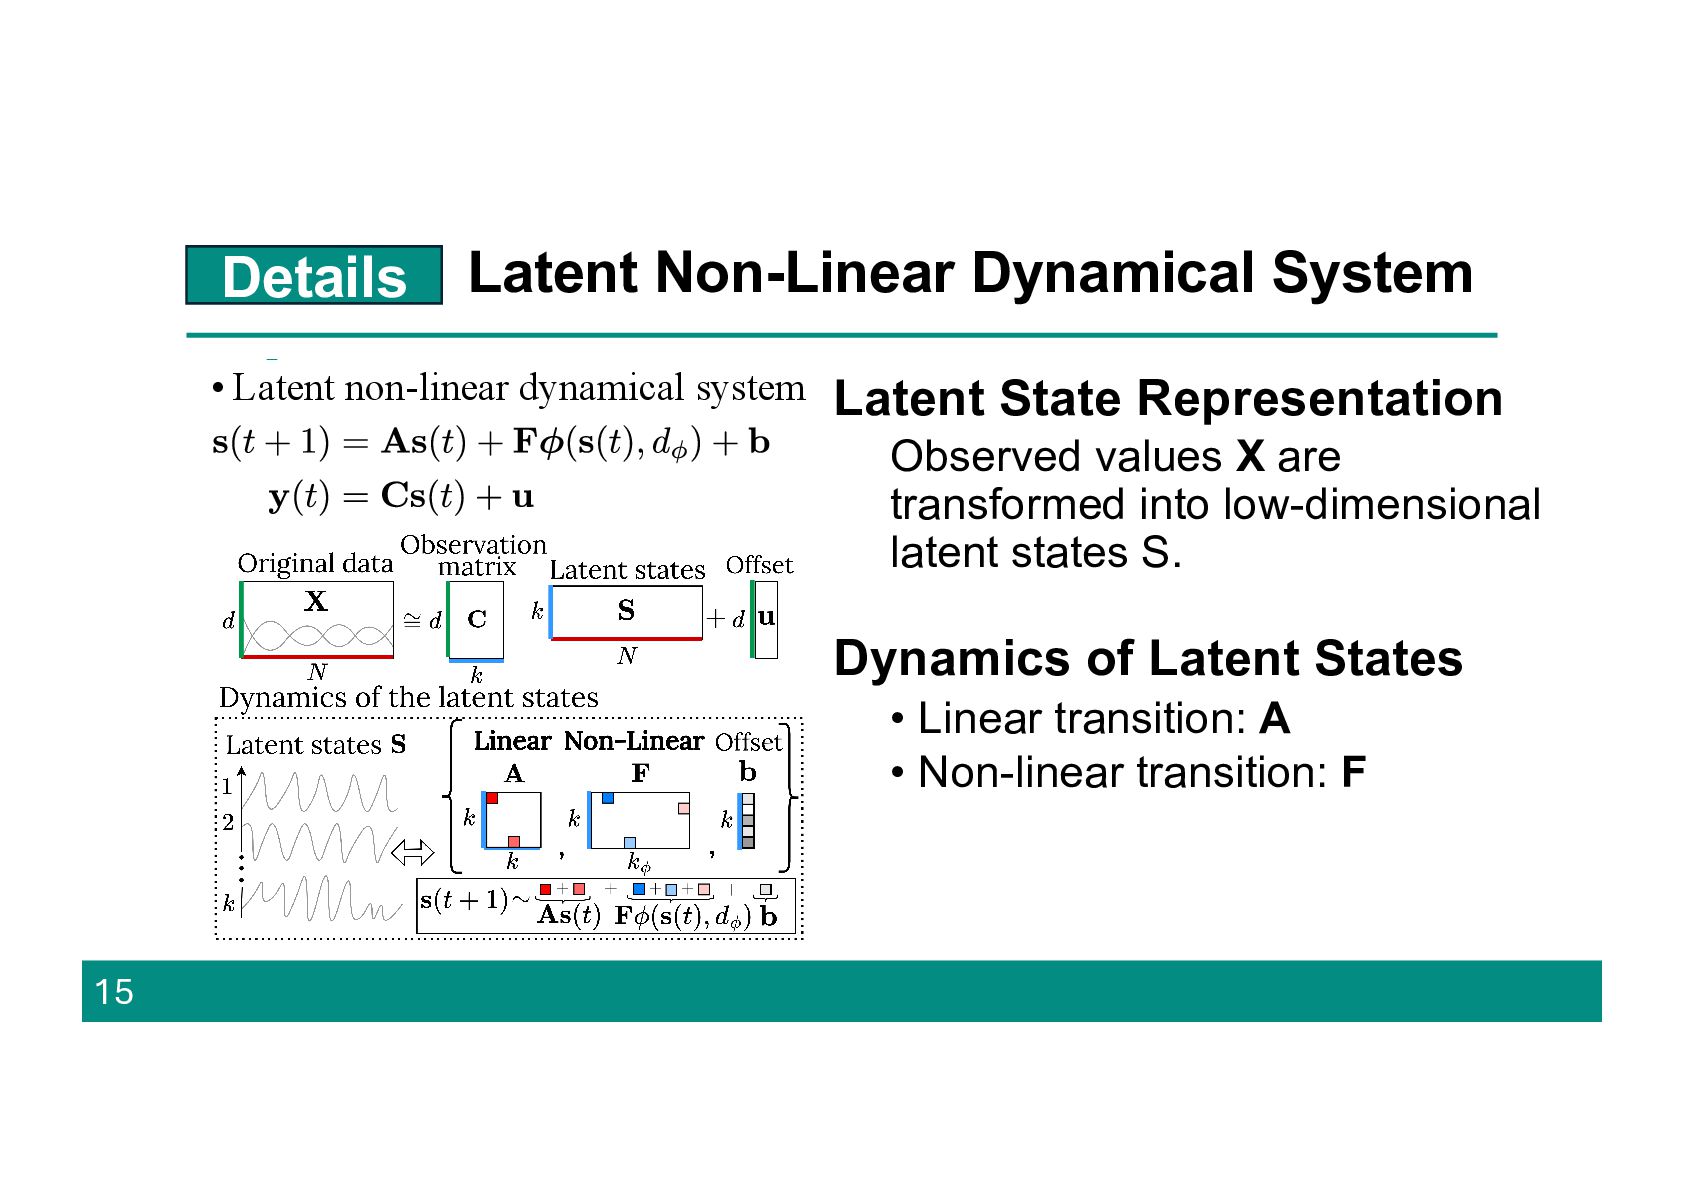
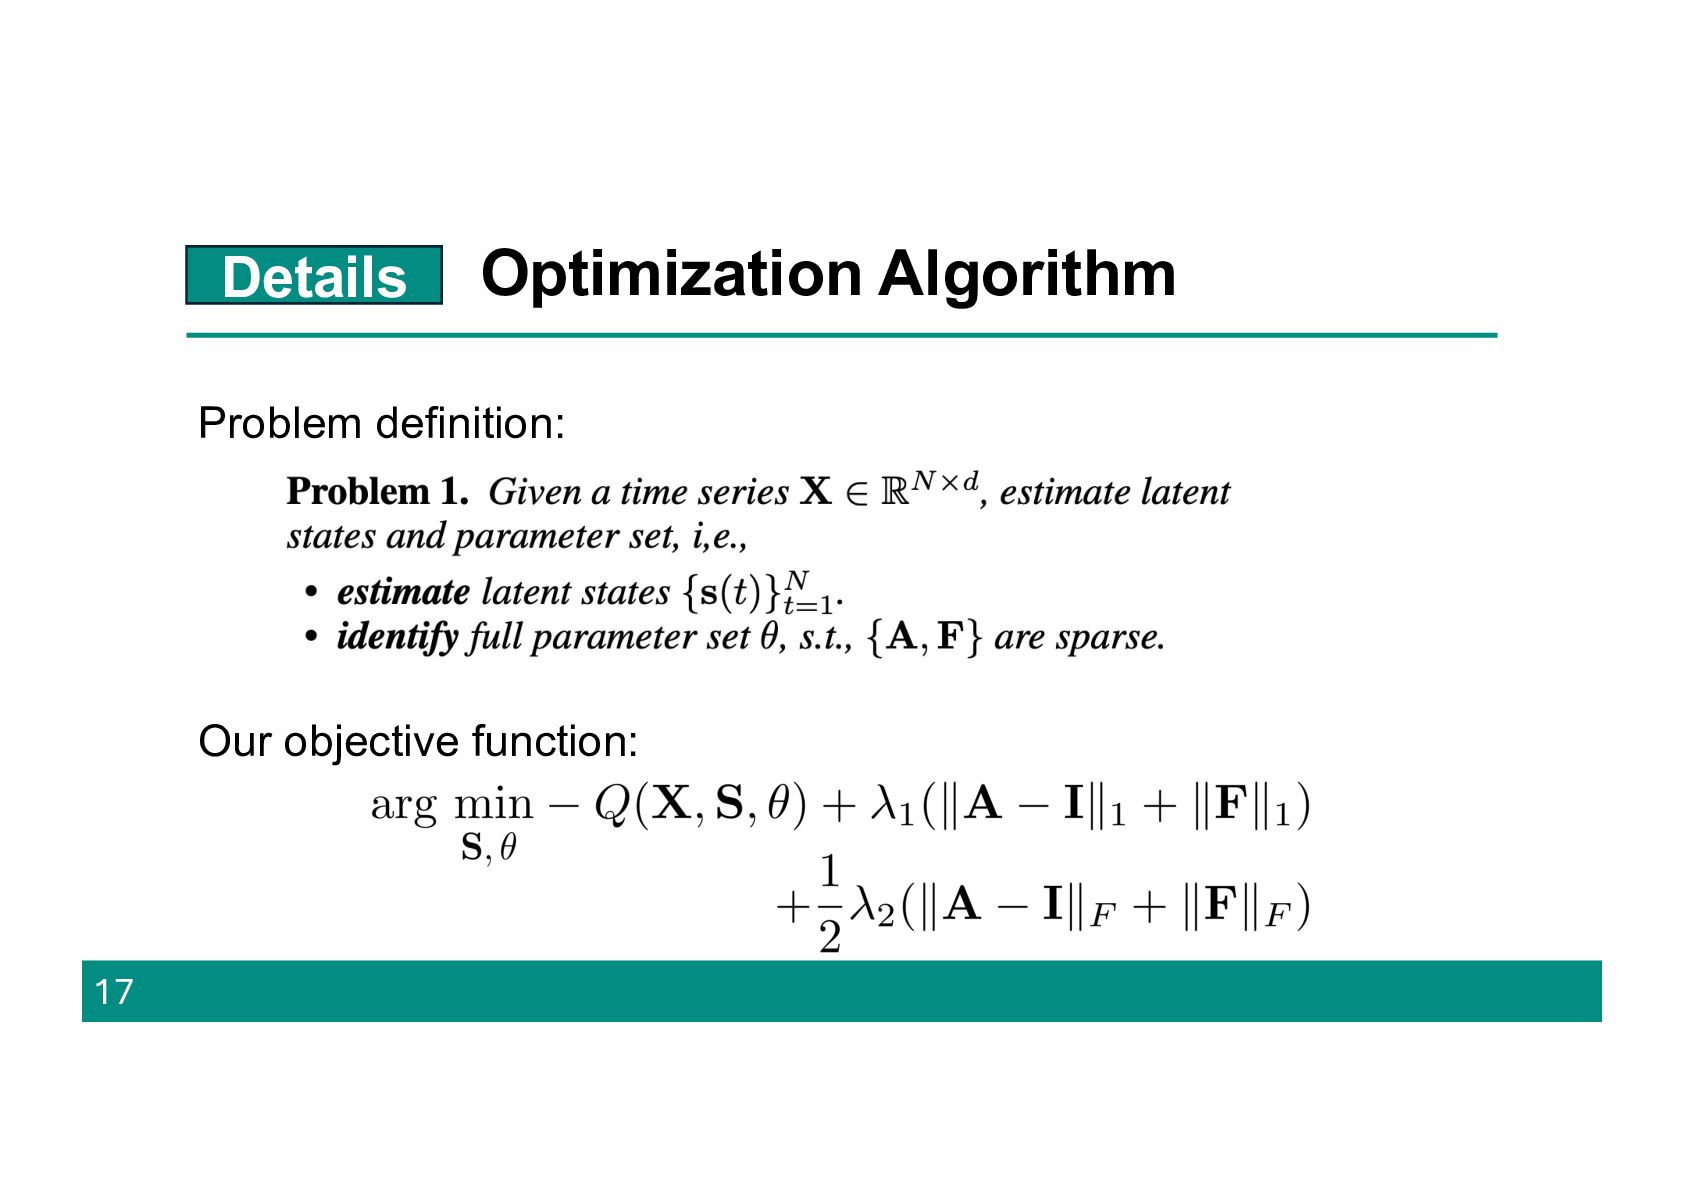
system • Criteria for model complexity Data encoding cost Model description cost Proposed Model - LaNoLem Latent State Representation Observed values X are transformed into low-dimensional latent states S. Dynamics of Latent States • Linear transition: A • Non-linear transition: F
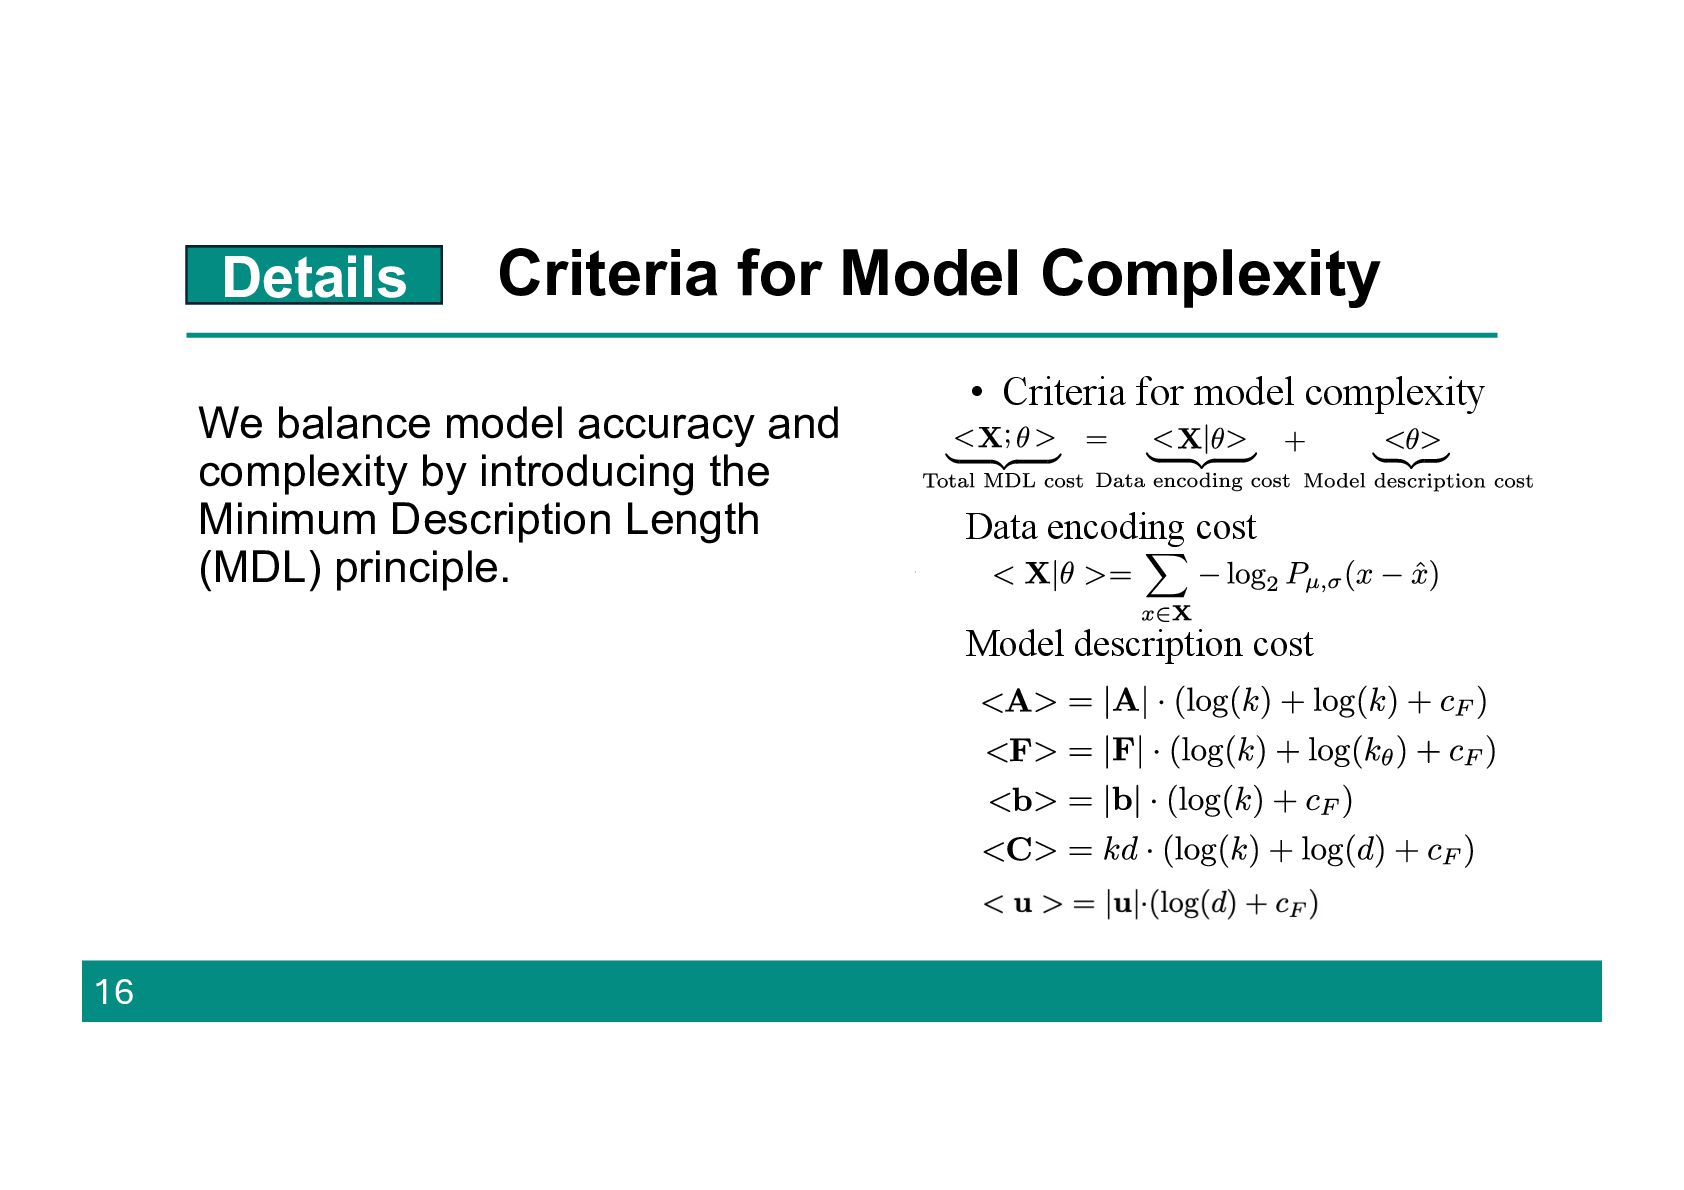
by introducing the Minimum Description Length (MDL) principle. 16 Details • Latent non-linear dynamical system • Criteria for model complexity Data encoding cost Model description cost Proposed Model - LaNoLem • Latent non-linear dynamical system • Criteria for model complexity Data encoding cost Model description cost Proposed Model - LaNoLem
generated by 71 chaotic ODEs • Baseline Methods: 3 SINDy-based methods: STLSQ, SSR, MIOSR 22 Lorenz Rossler Halvorsen Arneodo [2] Gilpin, W. 2021. Chaos as an interpretable benchmark for forecasting and data-driven modeling. In Vanschoren, J.; and Yeung, S., eds., Proceedings of the Neural Information Processing Systems Track on Datasets and Benchmarks.
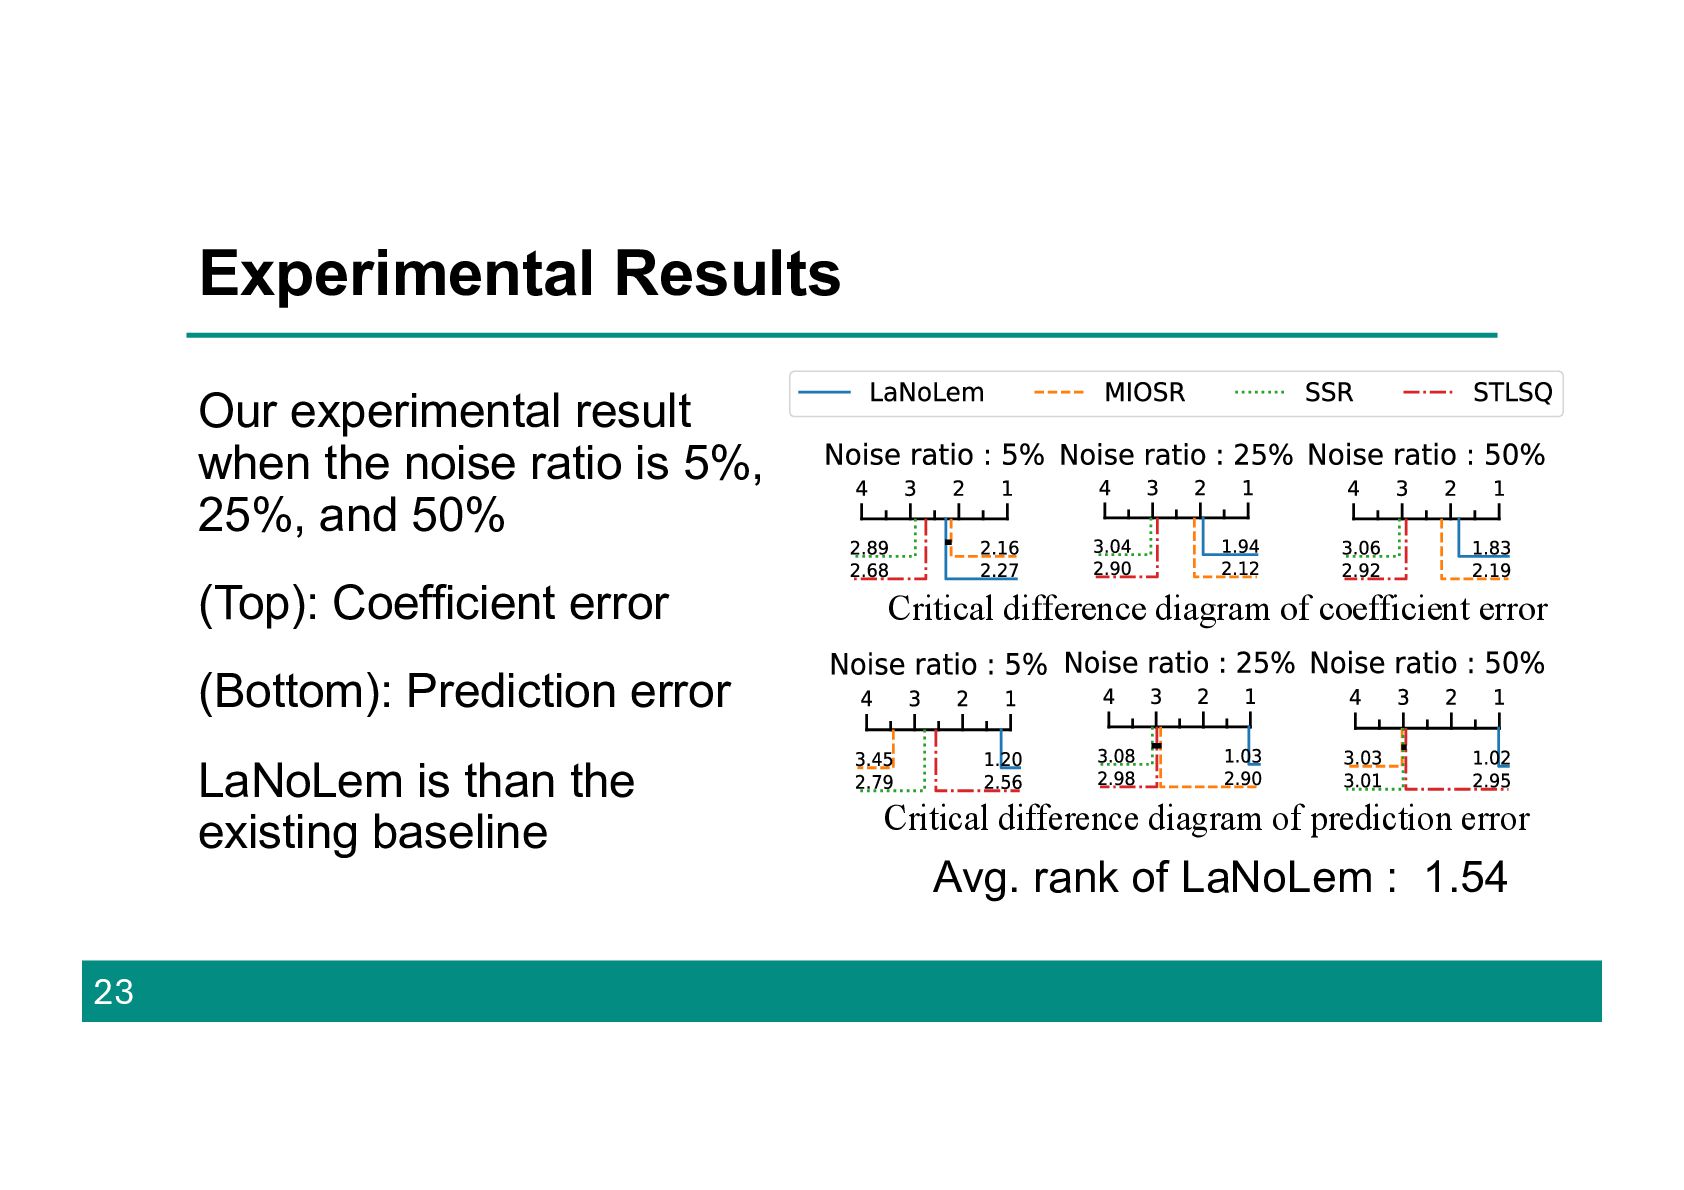
is better) (b-ii) Critical difference diagram of prediction error Critical difference diagram of coefficient error Experimental Results 23 Our experimental result when the noise ratio is 5%, 25%, and 50% (Top): Coefficient error (Bottom): Prediction error LaNoLem is than the existing baseline (a-i) Coefficient error (lower is better) (a-ii) Critical difference diagram of coefficient error Avg. rank of LaNoLem : 1.54
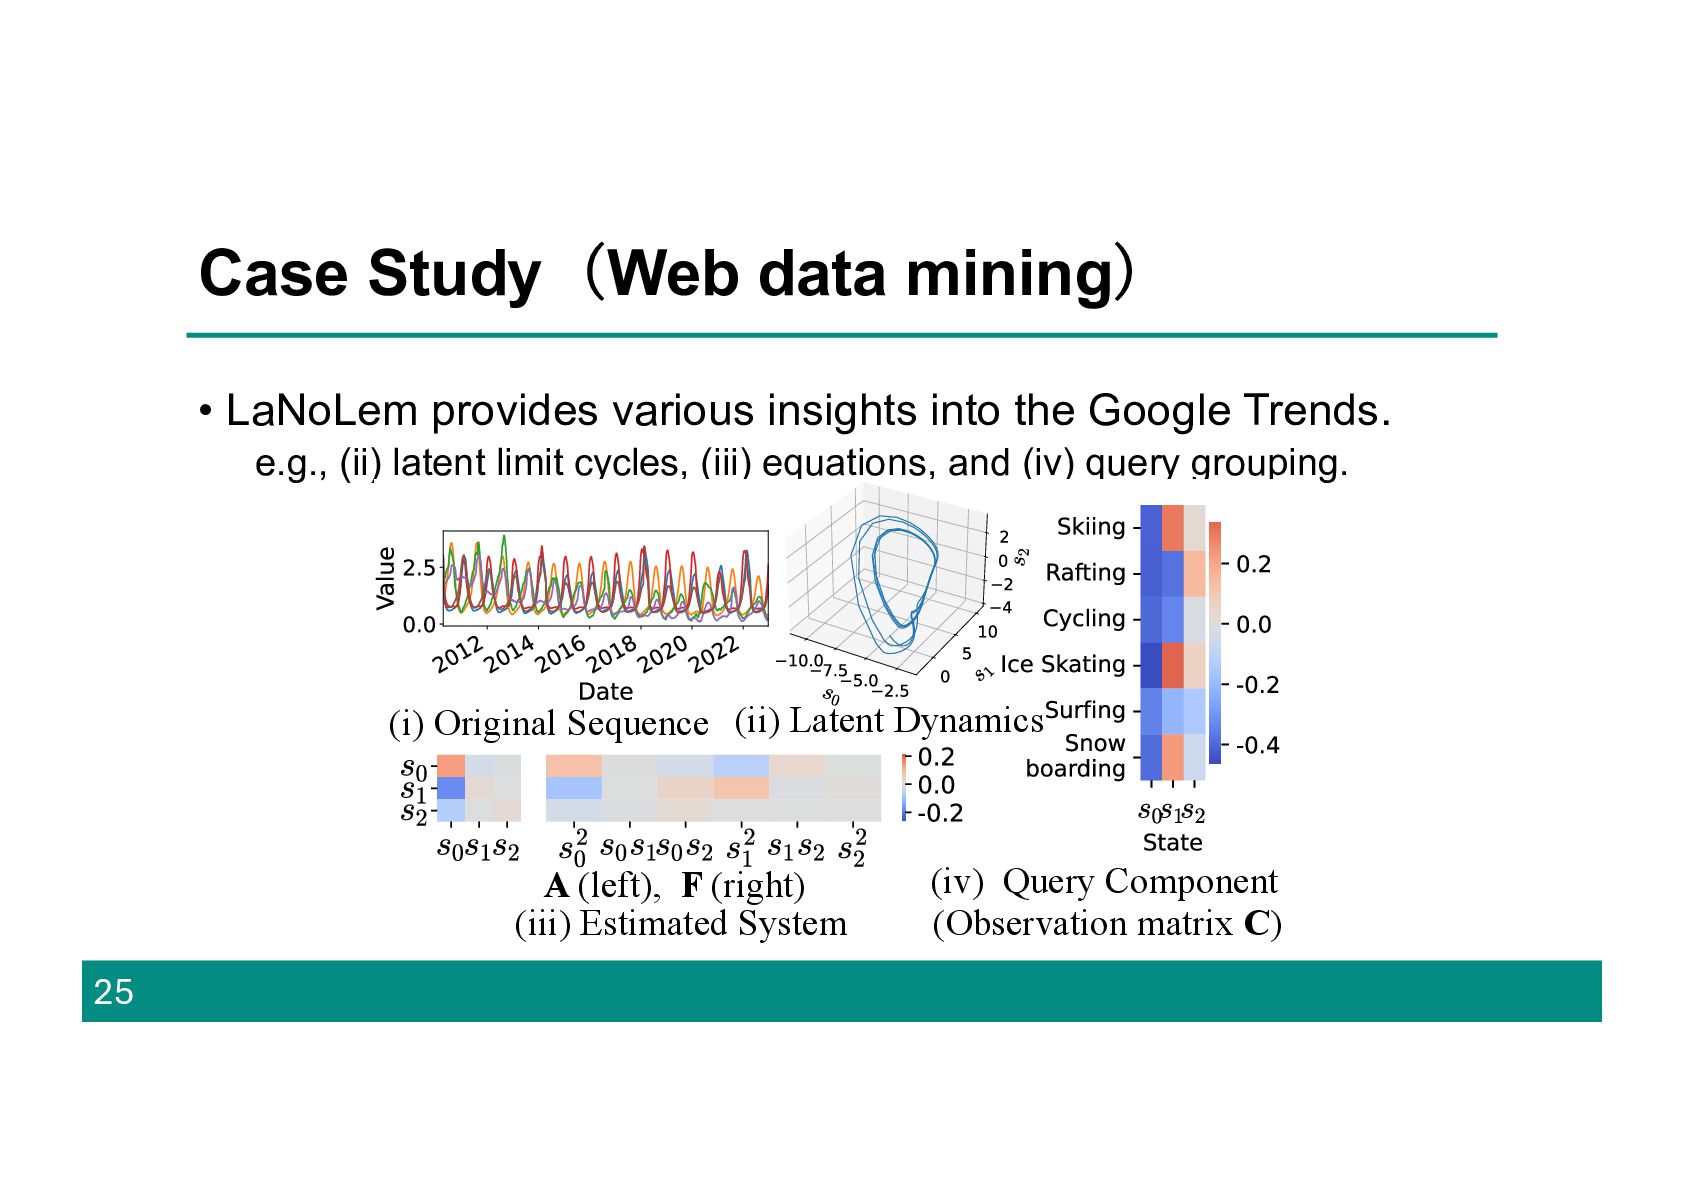
the Google Trends. e.g., (ii) latent limit cycles, (iii) equations, and (iv) query grouping. 25 (i) Original Sequence (ii) Latent Dynamics (iii) Estimated System A (left), F (right) (iv) Query Component (Observation matrix C)
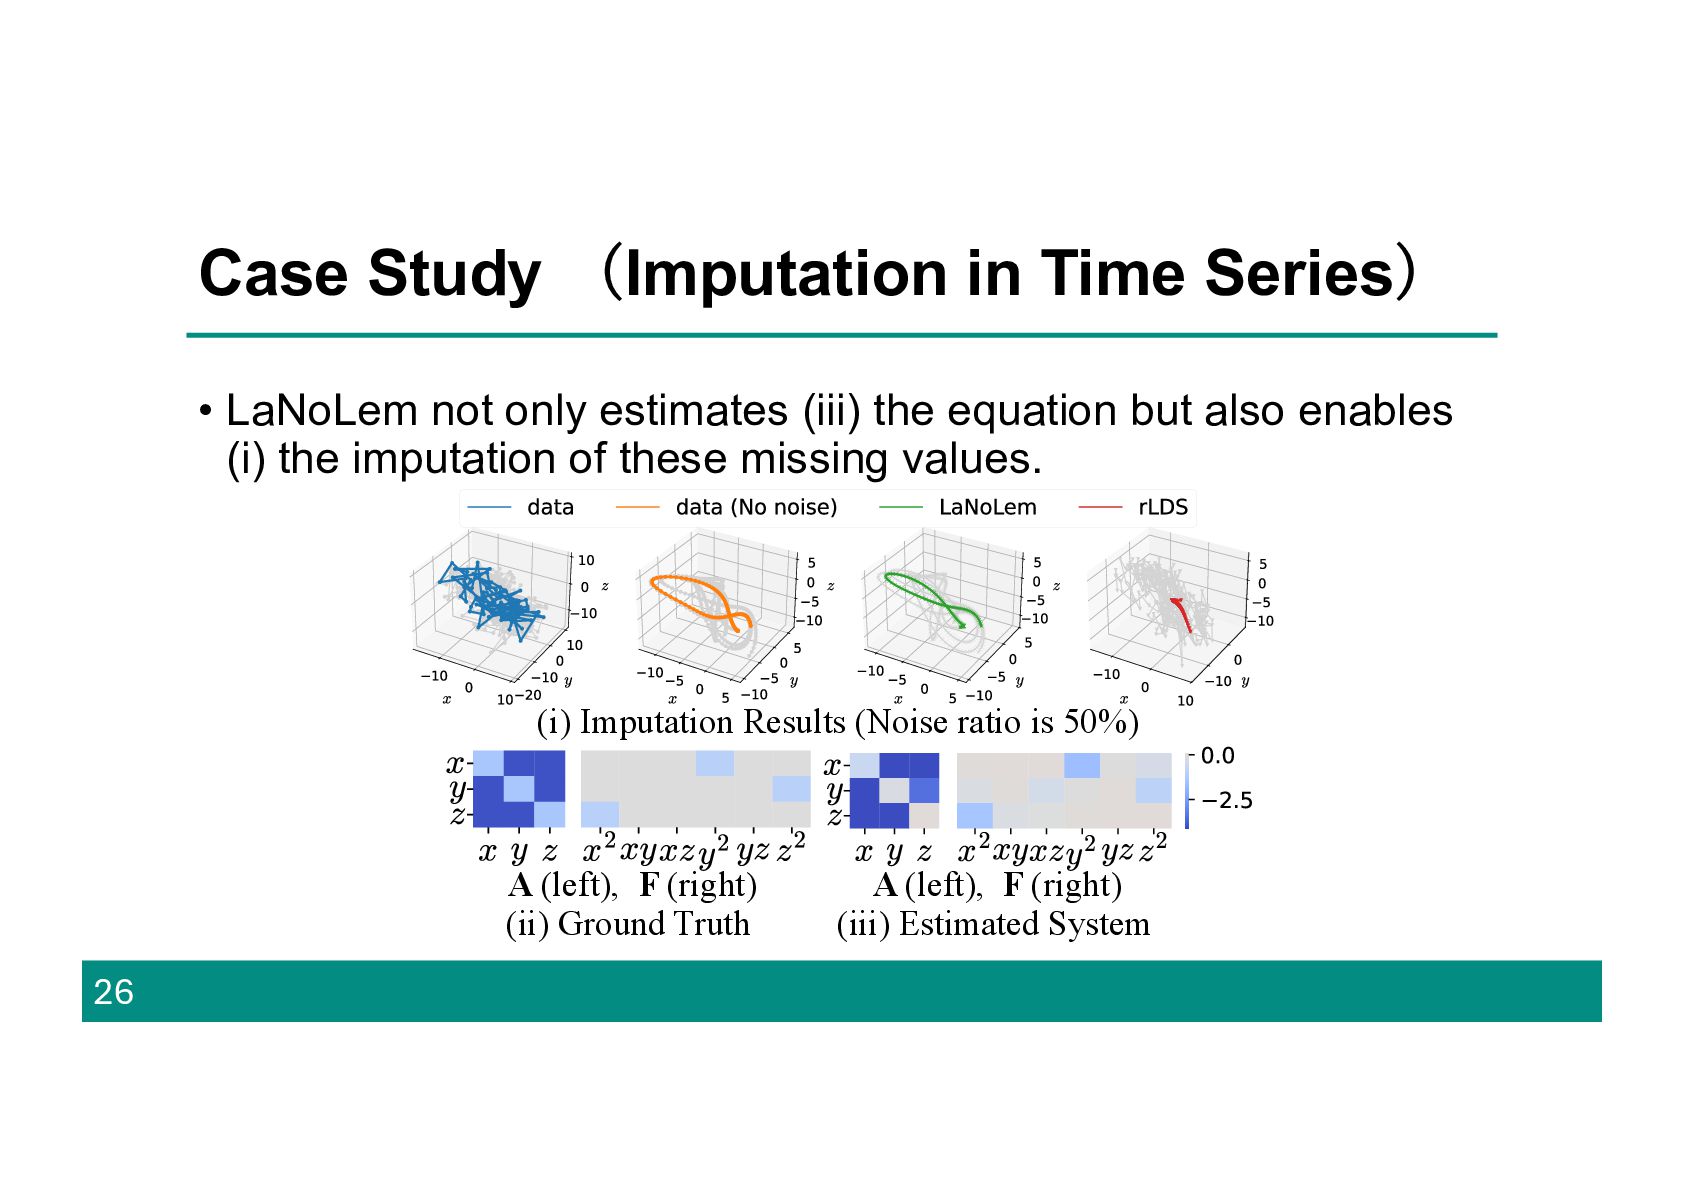
only estimates (iii) the equation but also enables (i) the imputation of these missing values. (i) Imputation Results (Noise ratio is 50%) (ii) Ground Truth A (left), F (right) (iii) Estimated System A (left), F (right)
![Experimental Setting • Dataset: dysts database[2], which is synthetic data](https://files.speakerdeck.com/presentations/8e81e35255334193a7ccf8c46be44f57/slide_21.jpg)