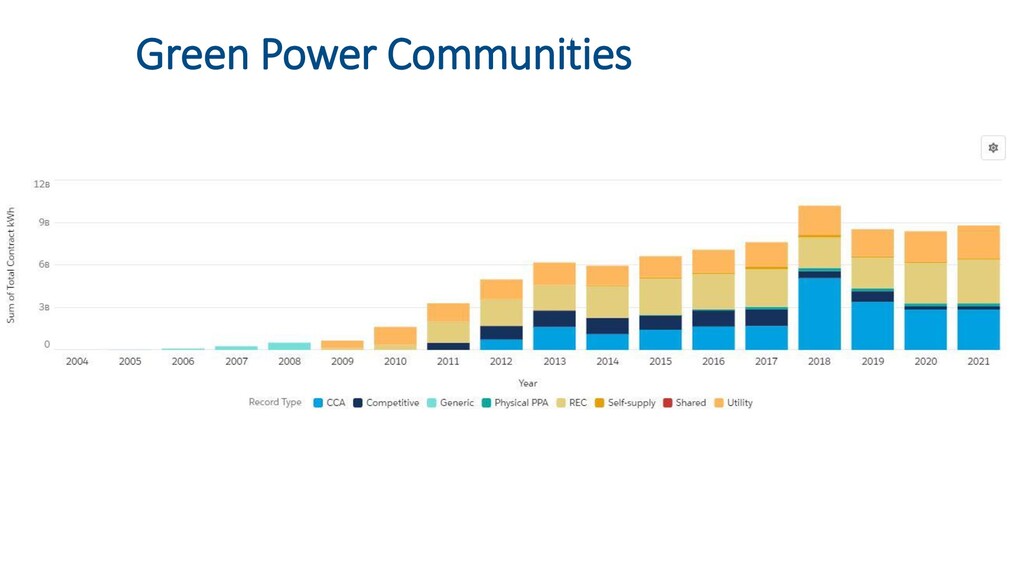
Cities have some of the most impact potential for carbon reductions nationwide and are increasingly making commitments to 100% renewable energy purchasing, carbon neutral and even “net zero” futures. How do various strategies for reaching these goals play out in different geographies and under differing regulatory pressures? This webinar brings together leading municipalities to discuss strategies that have worked, and precautions for what to avoid.
Among the varied energy purchasing options discussed are RECs, PPAs, VPPAs, green tariffs, city-utility partnerships, competitive suppliers, CCAs, on-site, community solar, and the environmental claims that can result from these options.
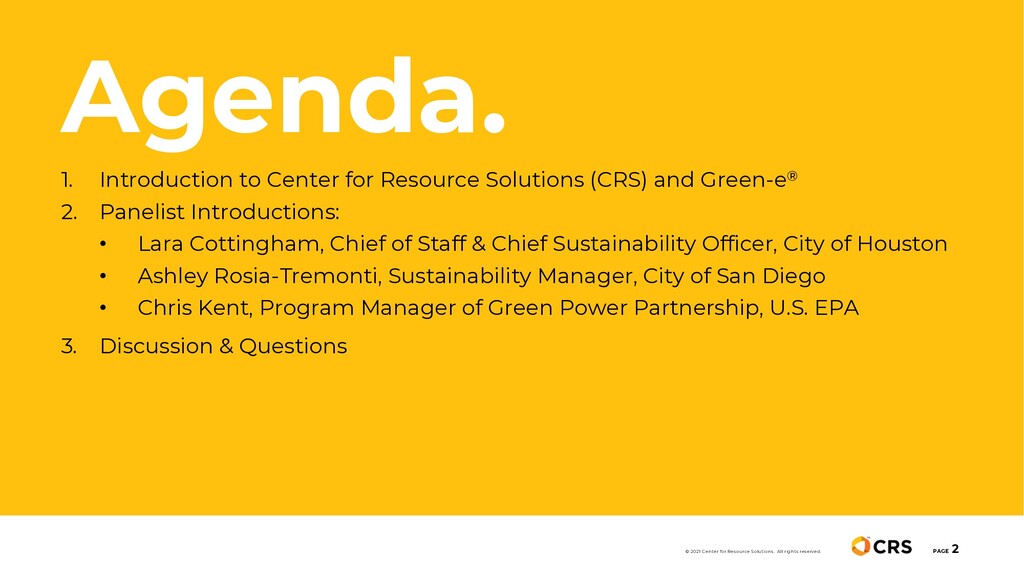
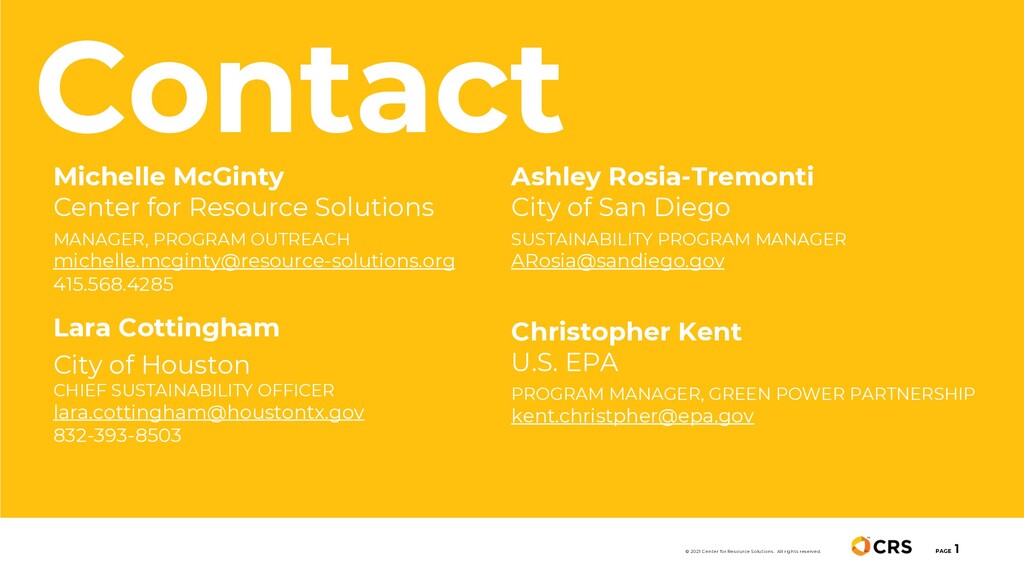
SPEAKERS
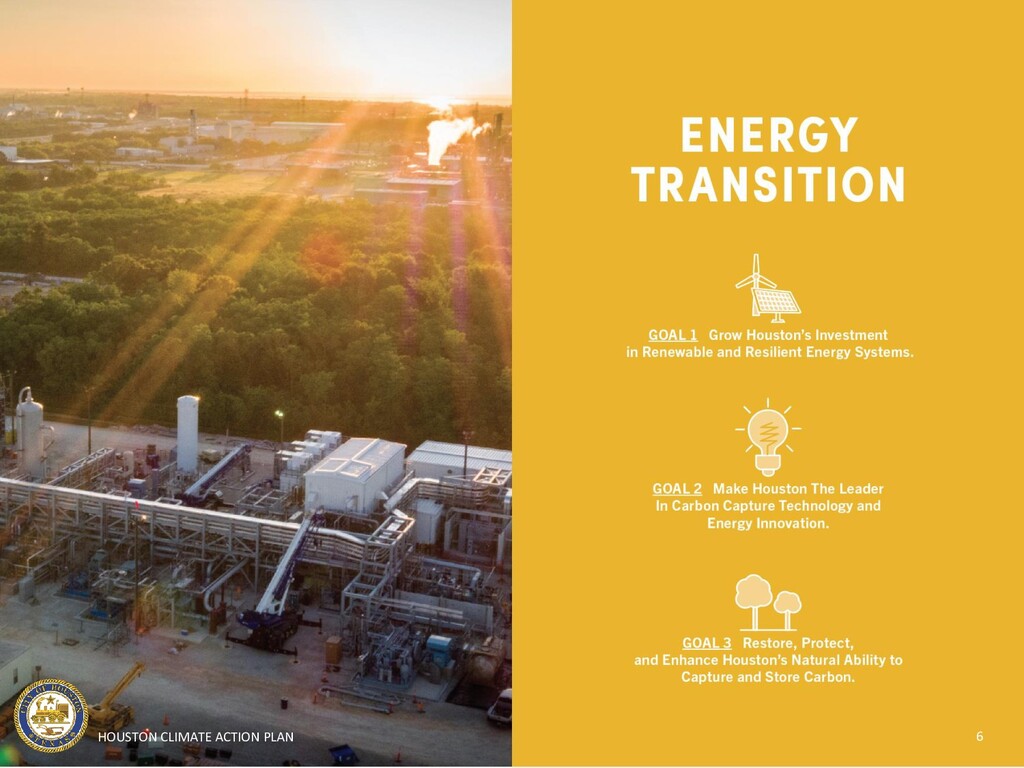
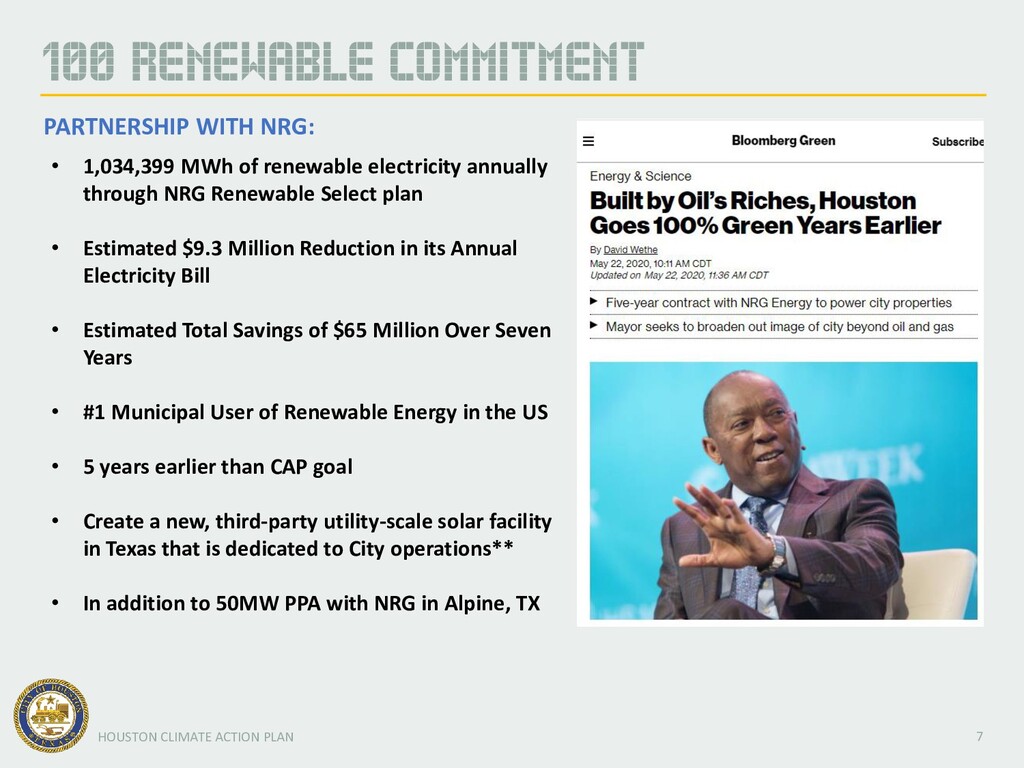
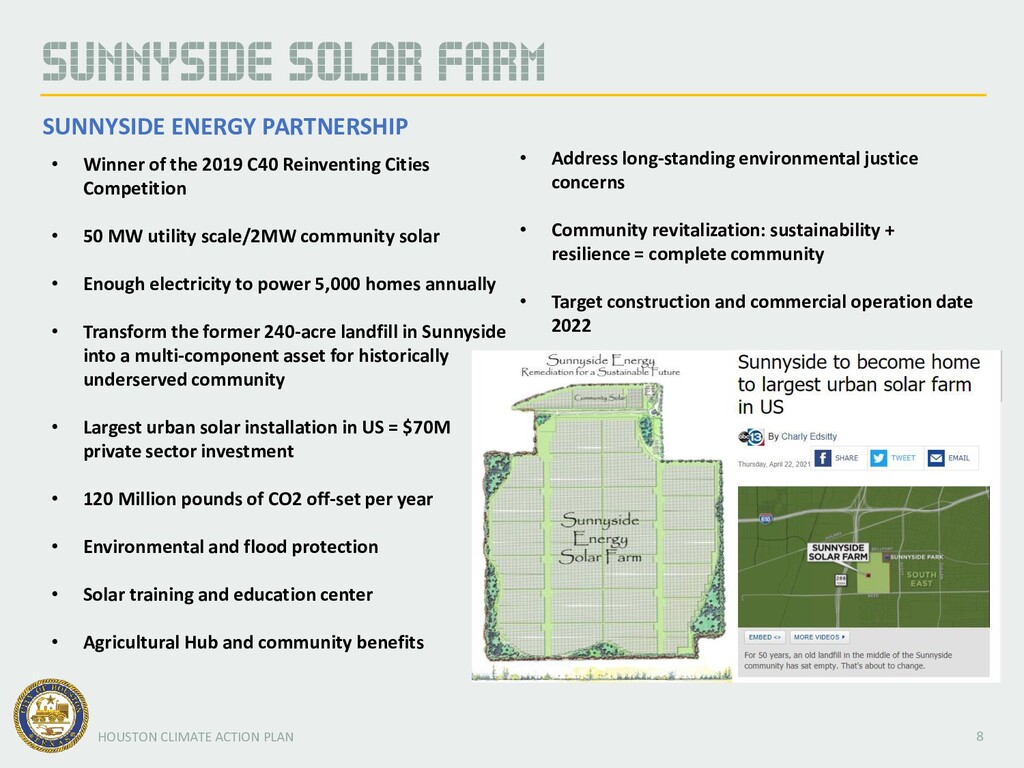
• Lara Cottingham, Chief of Staff & Chief Sustainability Officer, City of Houston
• Ashley Rosia-Tremonti, Sustainability Manager, City of San Diego
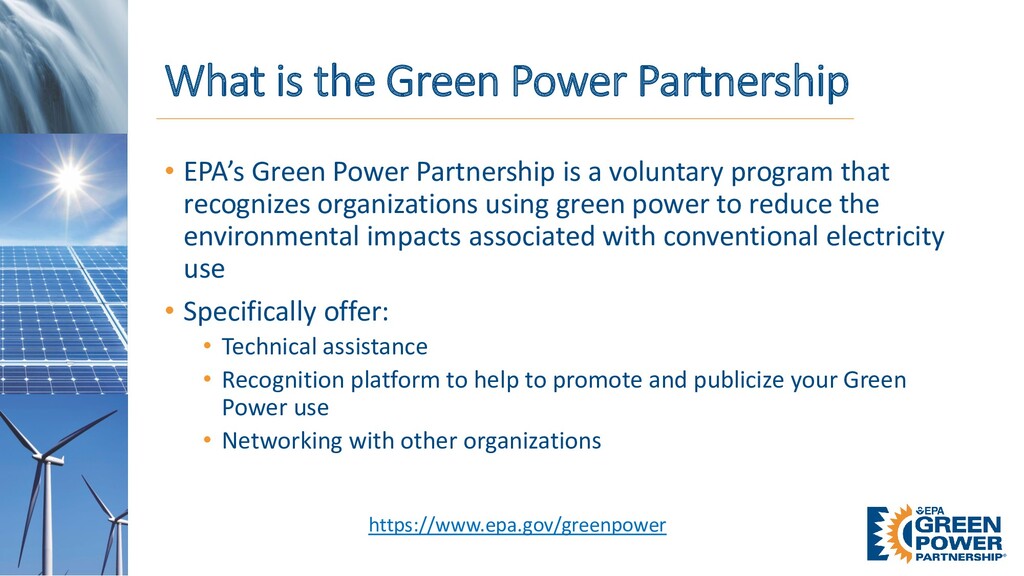
• Chris Kent, U.S. EPA, Green Power Partnership
• Michelle McGinty, Center for Resource Solutions (Moderator)
![Thank you! Ashley Rosia-Tremonti, [email protected]](https://files.speakerdeck.com/presentations/fbc320b445e44730a6b0b06541727166/slide_26.jpg)