Upgrade to Pro — share decks privately, control downloads, hide ads and more …

New York Restaurant Review Benchmarks: Google M...

New York Restaurant Review Benchmarks: Google Maps vs Tripadvisor

A Reviato benchmark deck comparing restaurant review signals across Google Maps and Tripadvisor in New York. It summarizes market-level reputation patterns, platform differences, and topic signals for restaurant operators, hospitality marketers, and analysts.

Source benchmark: https://www.reviato.com/insights/us/new-york/new-york/restaurants/aggregate
Methodology: https://www.reviato.com/insights/methodology
Reviato: https://www.reviato.com/

Avatar for Reviato

Reviato

May 20, 2026

Other Decks in Programming

Transcript

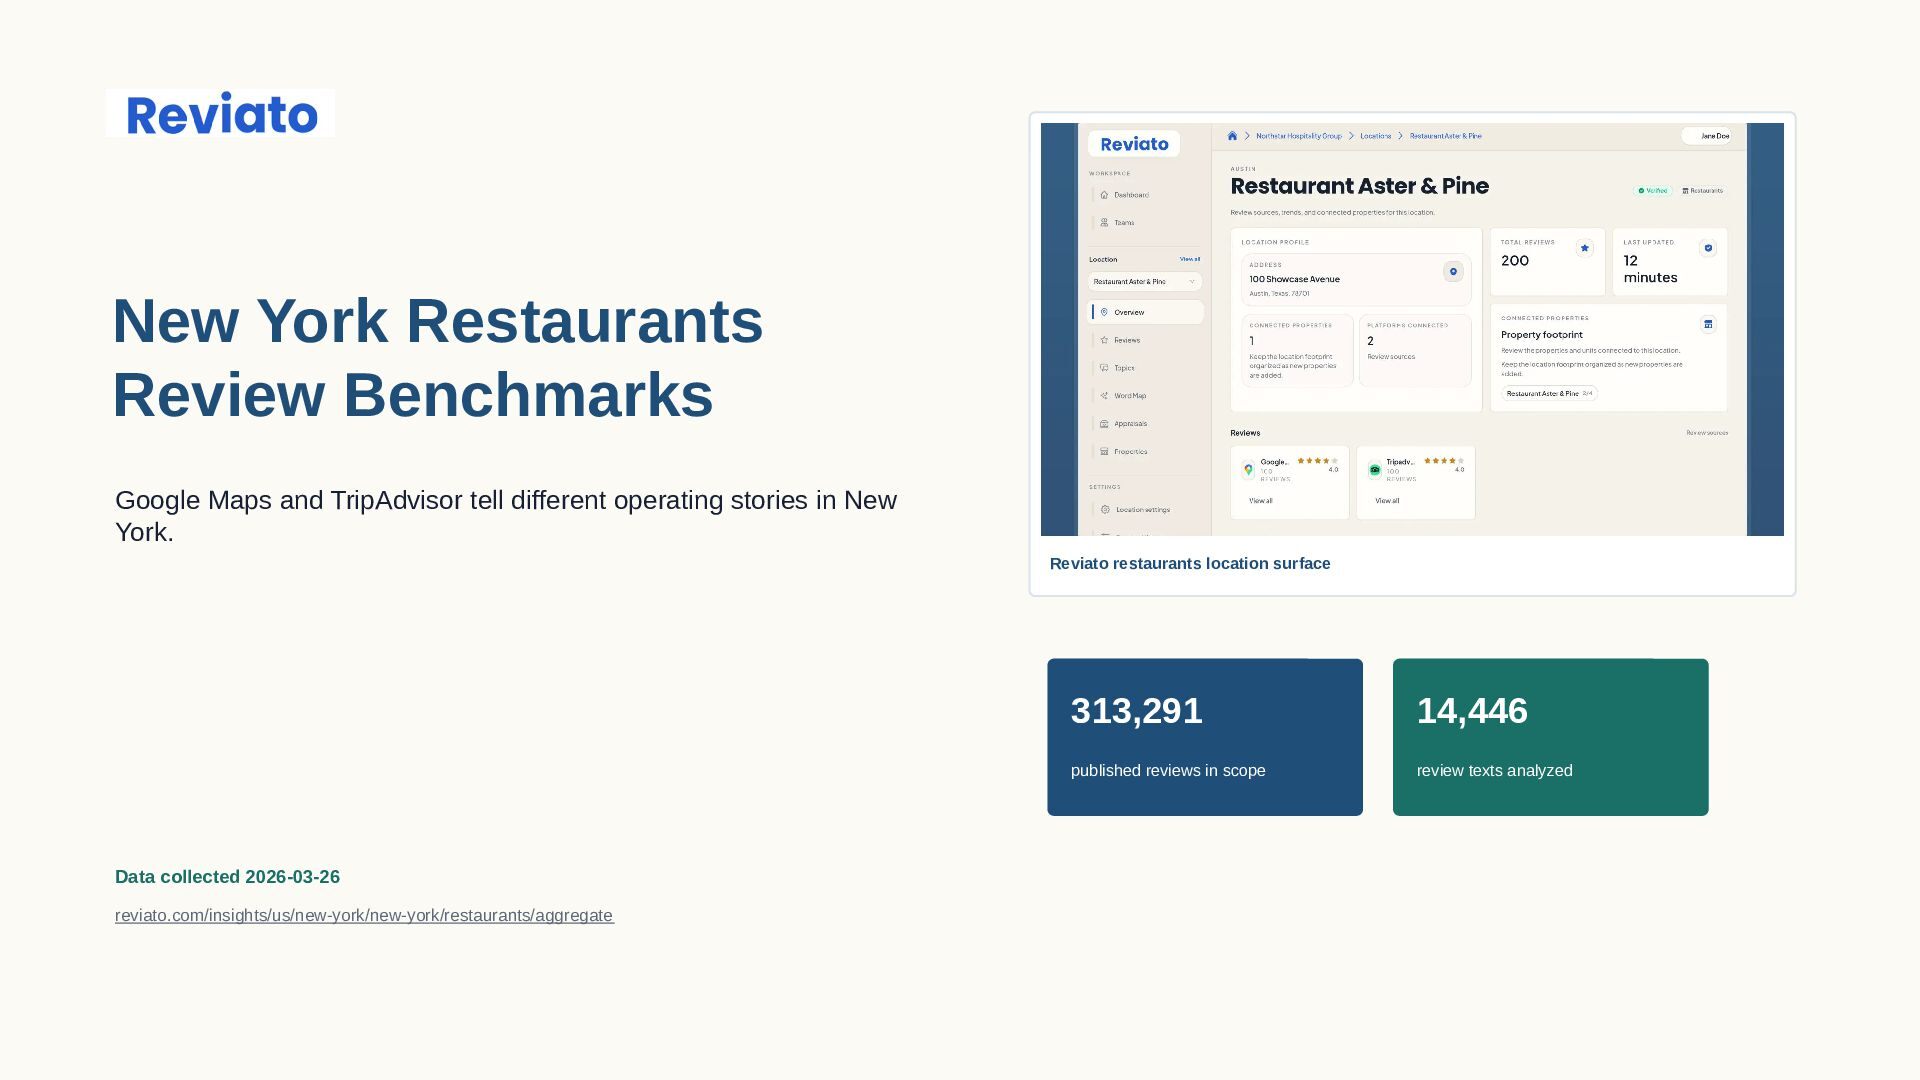
  1. New York Restaurants Review Benchmarks Google Maps and TripAdvisor tell

    different operating stories in New York. Data collected 2026-03-26 reviato.com/insights/us/new-york/new-york/restaurants/aggregate Reviato restaurants location surface 313,291 published reviews in scope 14,446 review texts analyzed
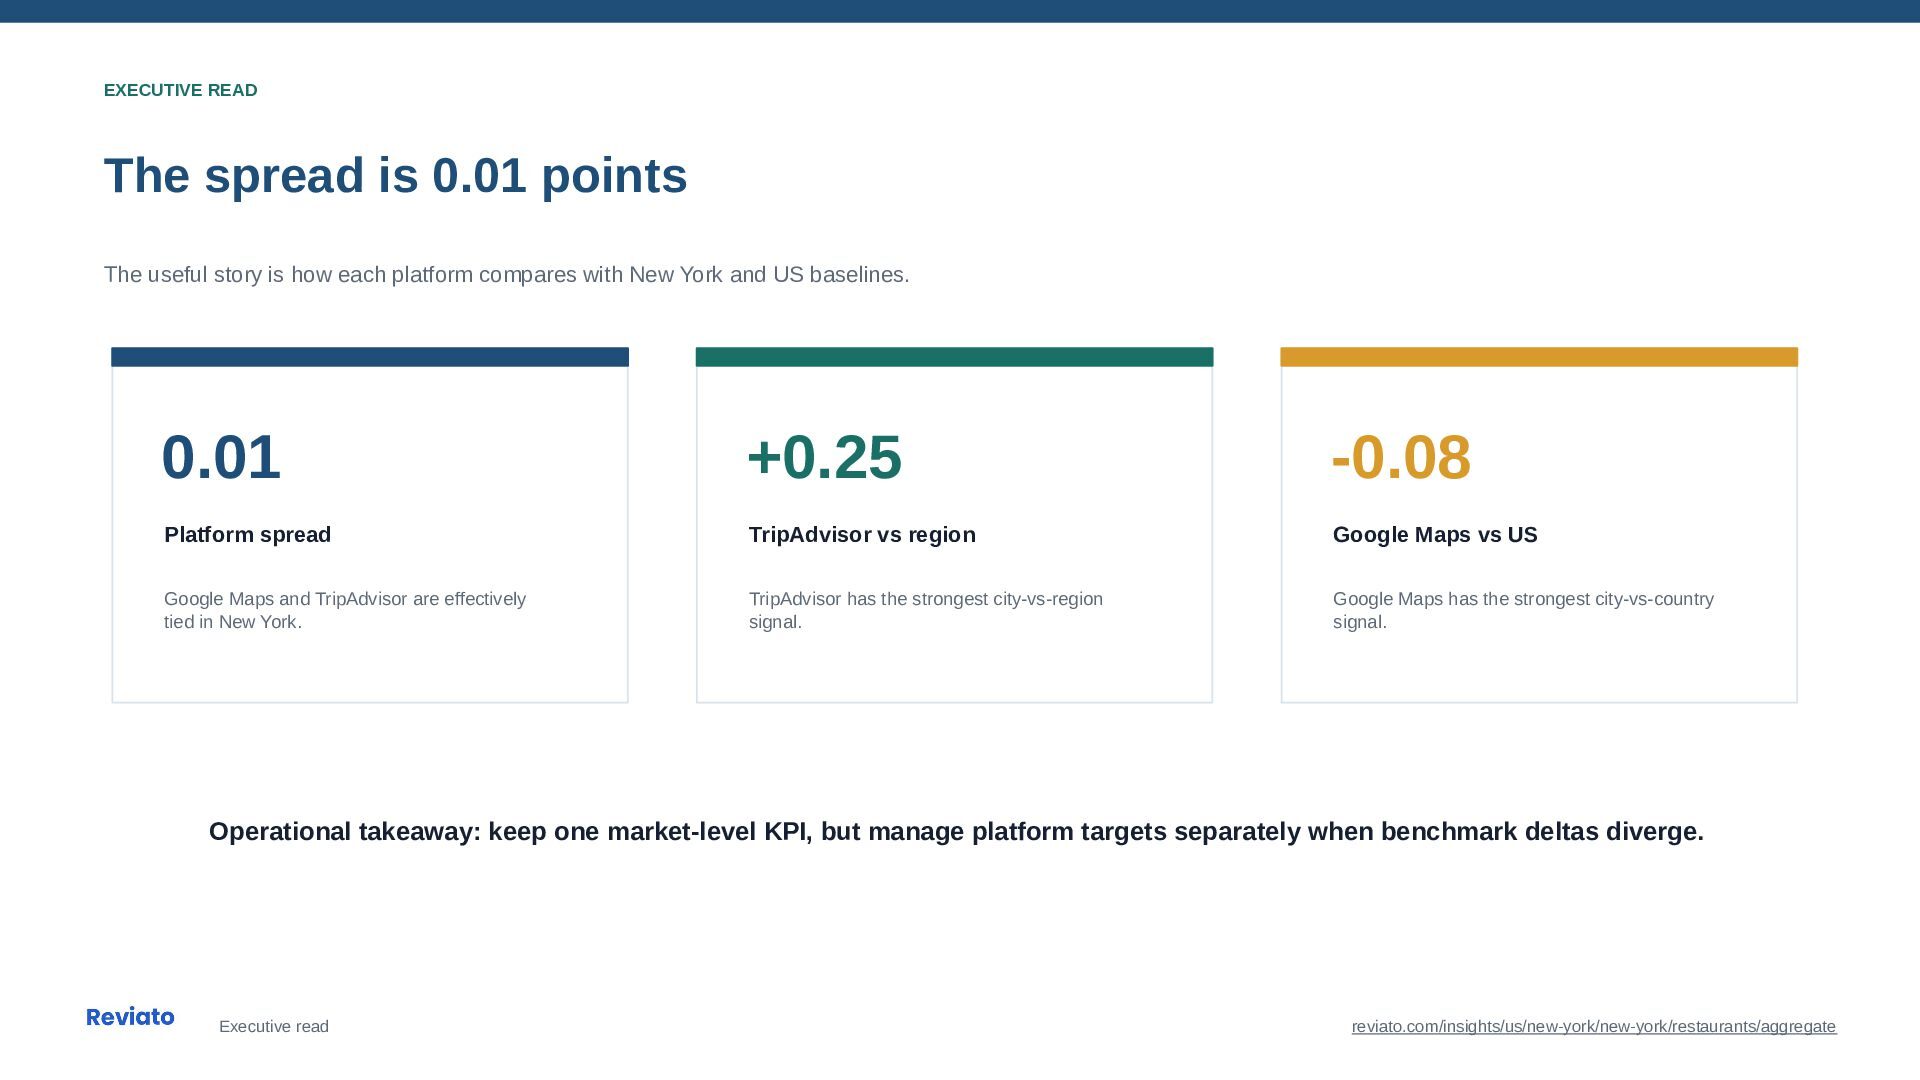
  2. EXECUTIVE READ The spread is 0.01 points The useful story

    is how each platform compares with New York and US baselines. 0.01 Platform spread Google Maps and TripAdvisor are effectively tied in New York. +0.25 TripAdvisor vs region TripAdvisor has the strongest city-vs-region signal. -0.08 Google Maps vs US Google Maps has the strongest city-vs-country signal. Operational takeaway: keep one market-level KPI, but manage platform targets separately when benchmark deltas diverge. Executive read reviato.com/insights/us/new-york/new-york/restaurants/aggregate
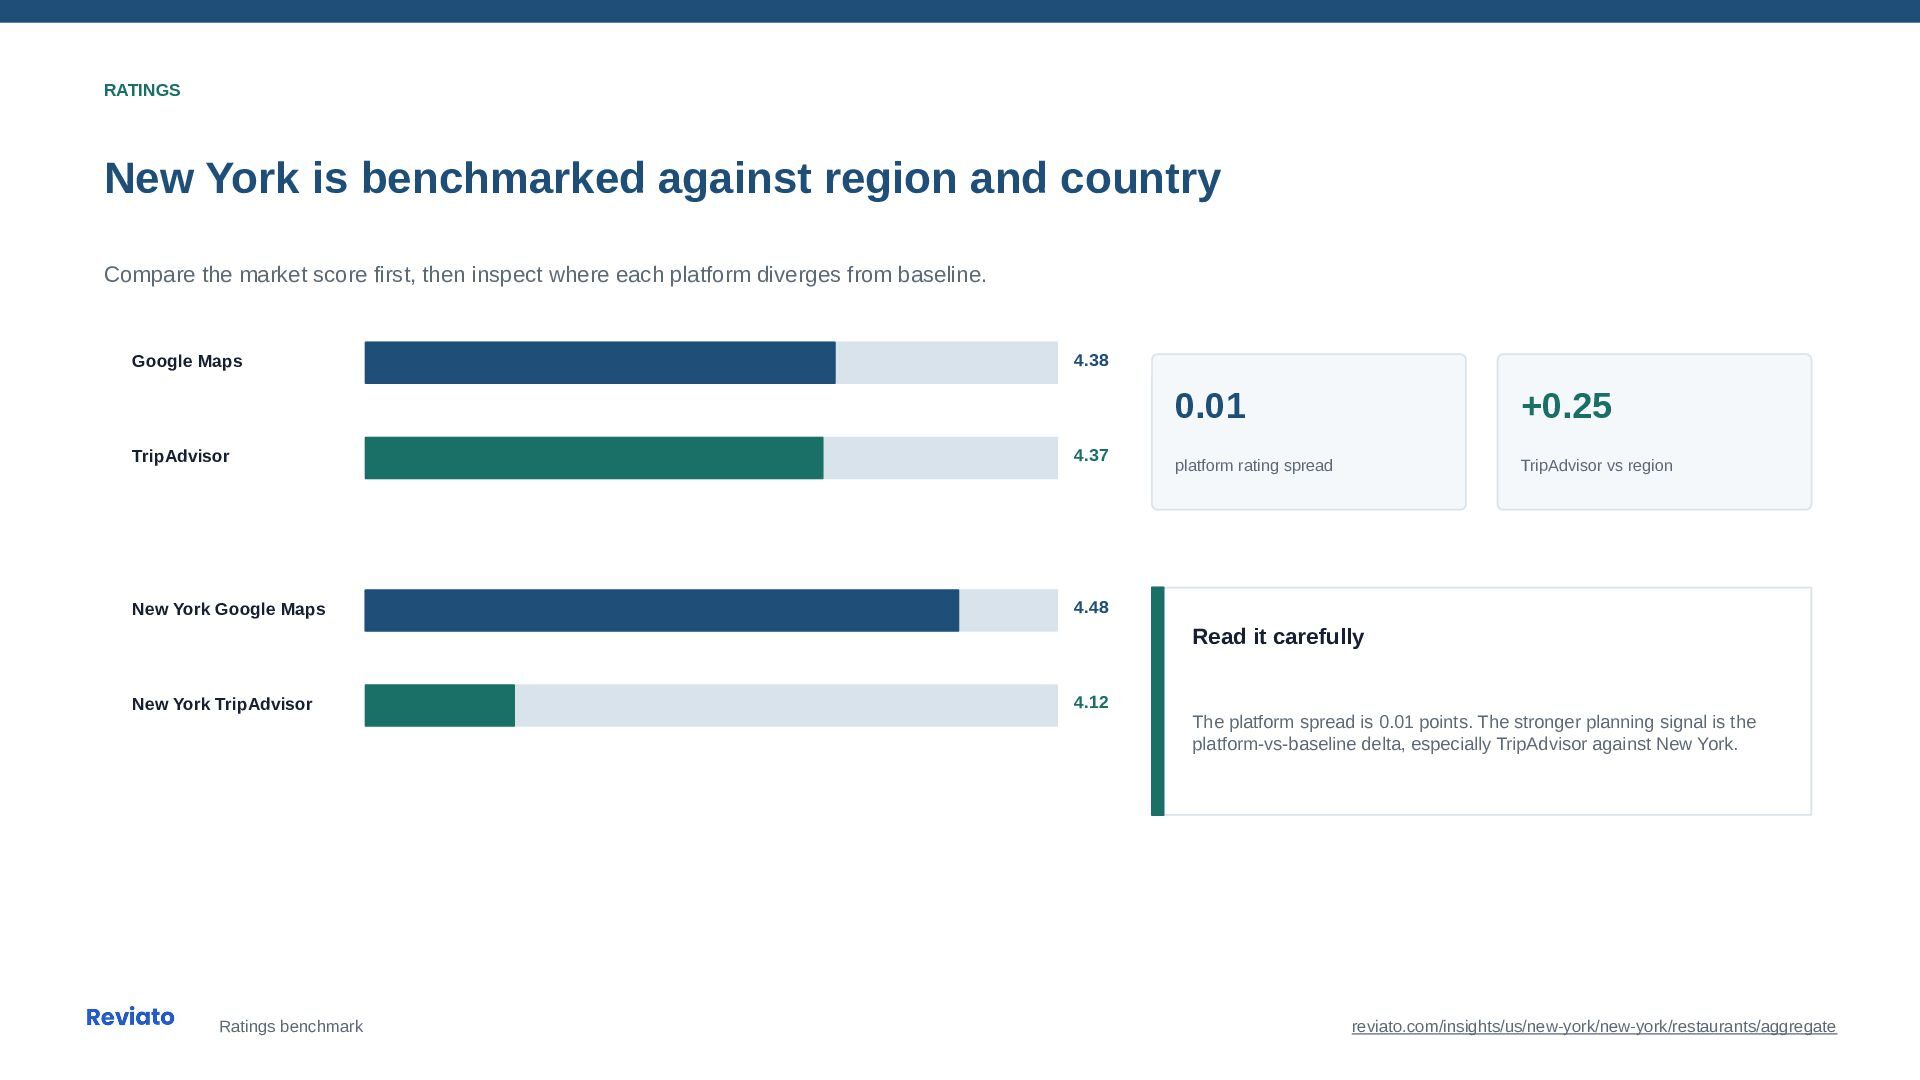
  3. RATINGS New York is benchmarked against region and country Compare

    the market score first, then inspect where each platform diverges from baseline. Google Maps 4.38 TripAdvisor 4.37 New York Google Maps 4.48 New York TripAdvisor 4.12 0.01 platform rating spread +0.25 TripAdvisor vs region Read it carefully The platform spread is 0.01 points. The stronger planning signal is the platform-vs-baseline delta, especially TripAdvisor against New York. Ratings benchmark reviato.com/insights/us/new-york/new-york/restaurants/aggregate
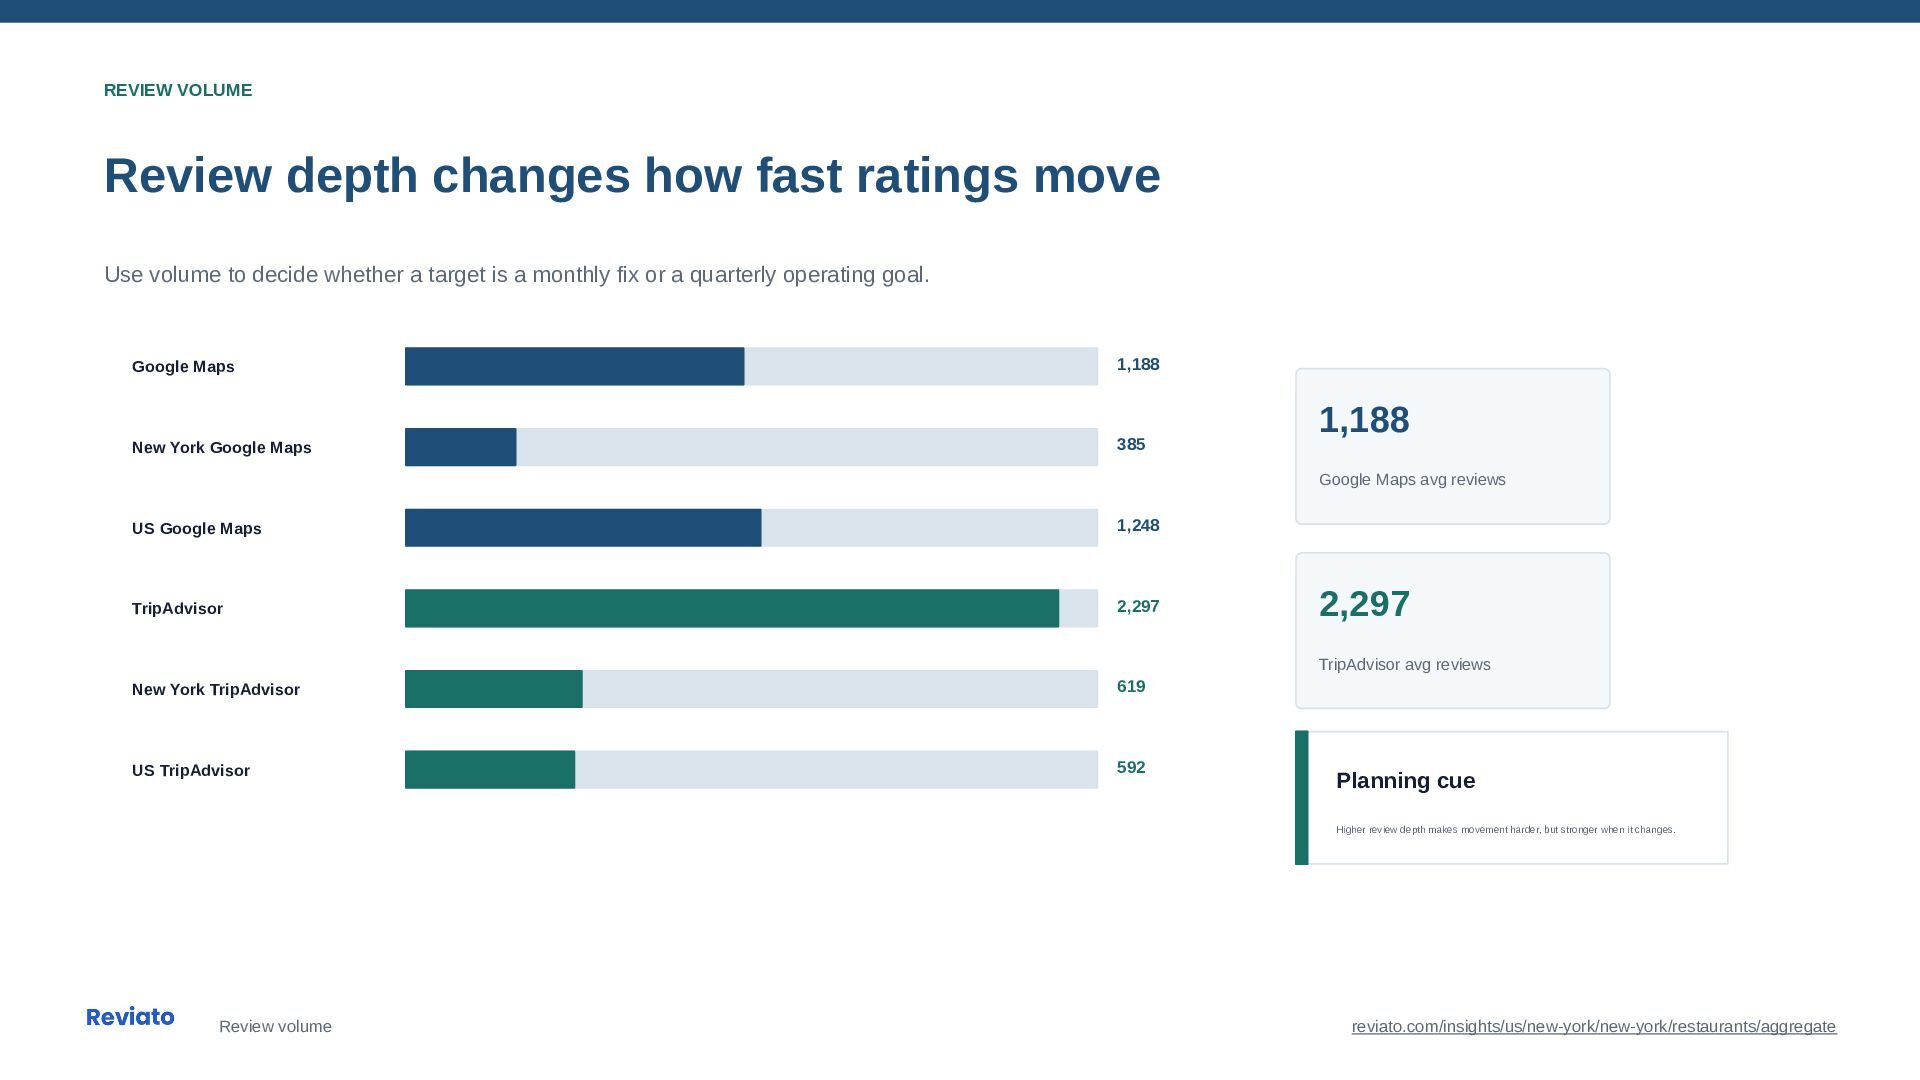
  4. REVIEW VOLUME Review depth changes how fast ratings move Use

    volume to decide whether a target is a monthly fix or a quarterly operating goal. Google Maps 1,188 New York Google Maps 385 US Google Maps 1,248 TripAdvisor 2,297 New York TripAdvisor 619 US TripAdvisor 592 1,188 Google Maps avg reviews 2,297 TripAdvisor avg reviews Planning cue Higher review depth makes movement harder, but stronger when it changes. Review volume reviato.com/insights/us/new-york/new-york/restaurants/aggregate
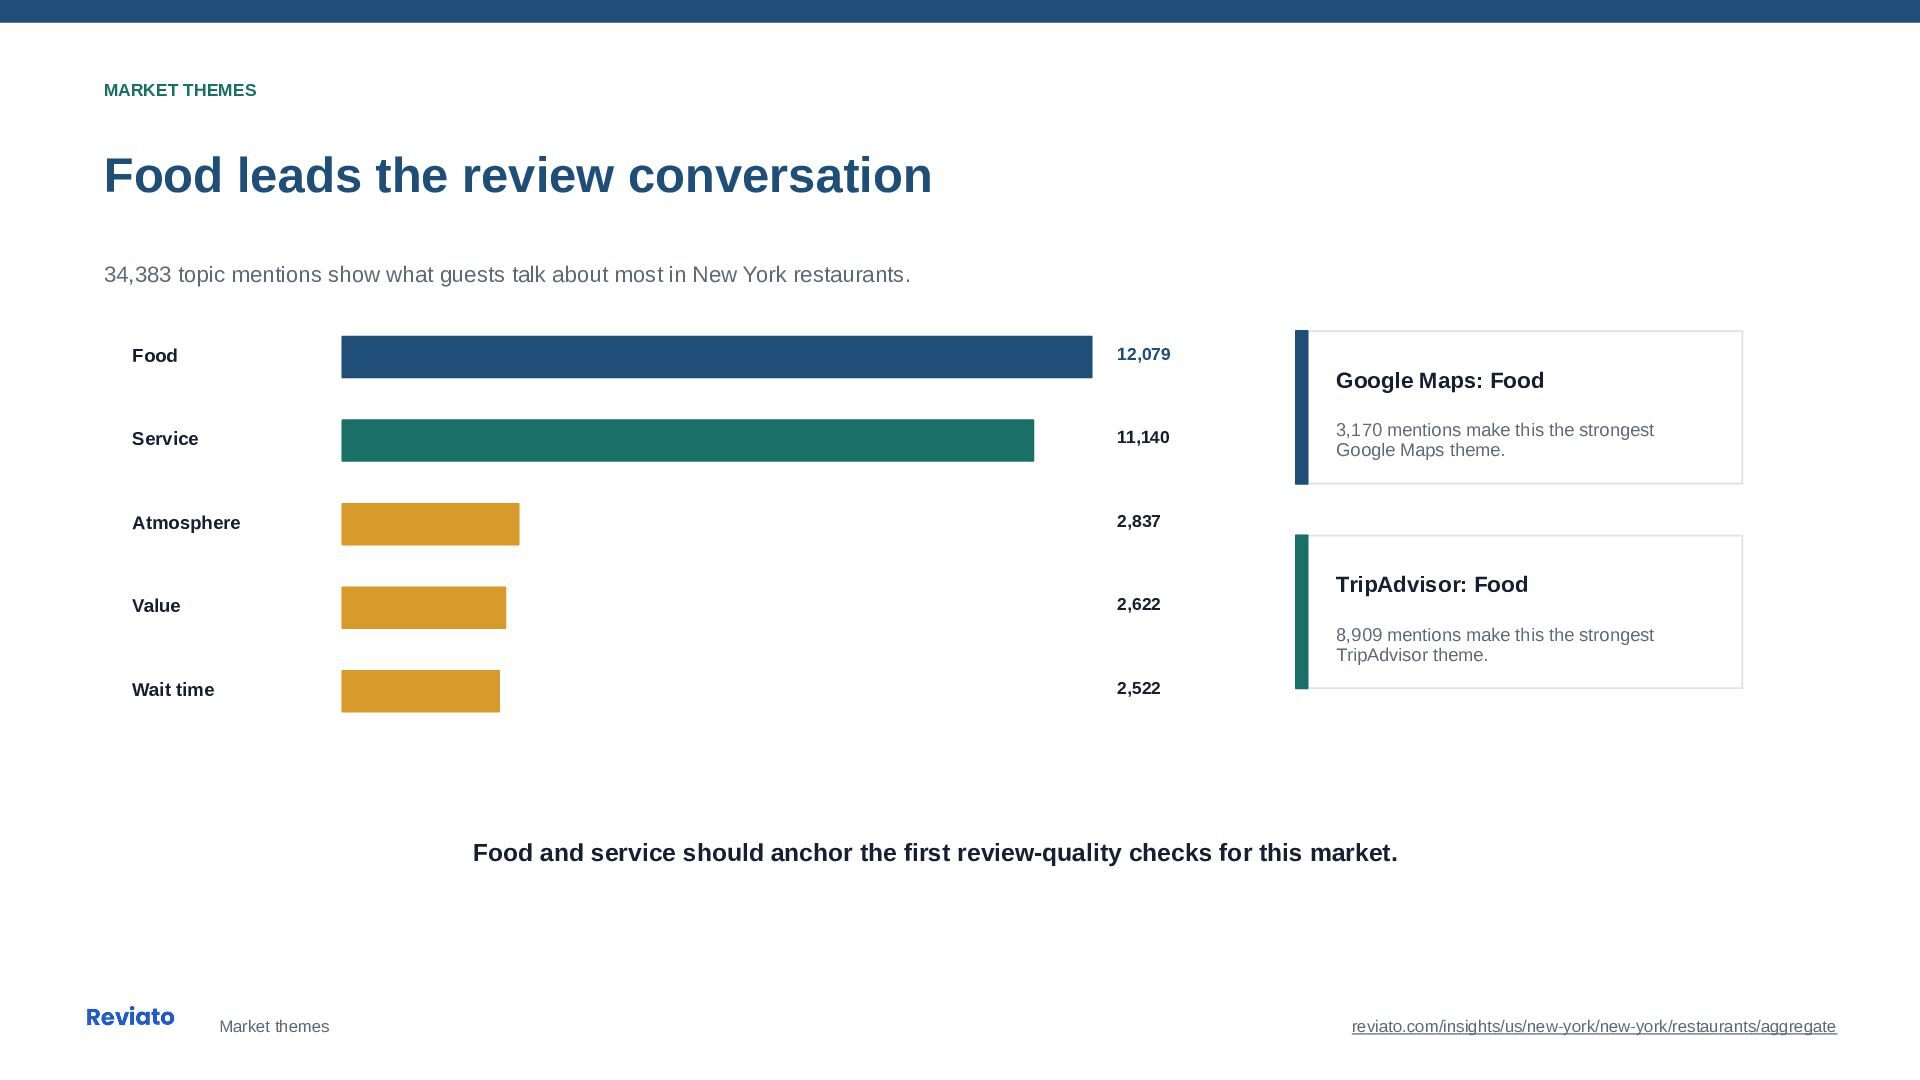
  5. MARKET THEMES Food leads the review conversation 34,383 topic mentions

    show what guests talk about most in New York restaurants. Food 12,079 Service 11,140 Atmosphere 2,837 Value 2,622 Wait time 2,522 Google Maps: Food 3,170 mentions make this the strongest Google Maps theme. TripAdvisor: Food 8,909 mentions make this the strongest TripAdvisor theme. Food and service should anchor the first review-quality checks for this market. Market themes reviato.com/insights/us/new-york/new-york/restaurants/aggregate
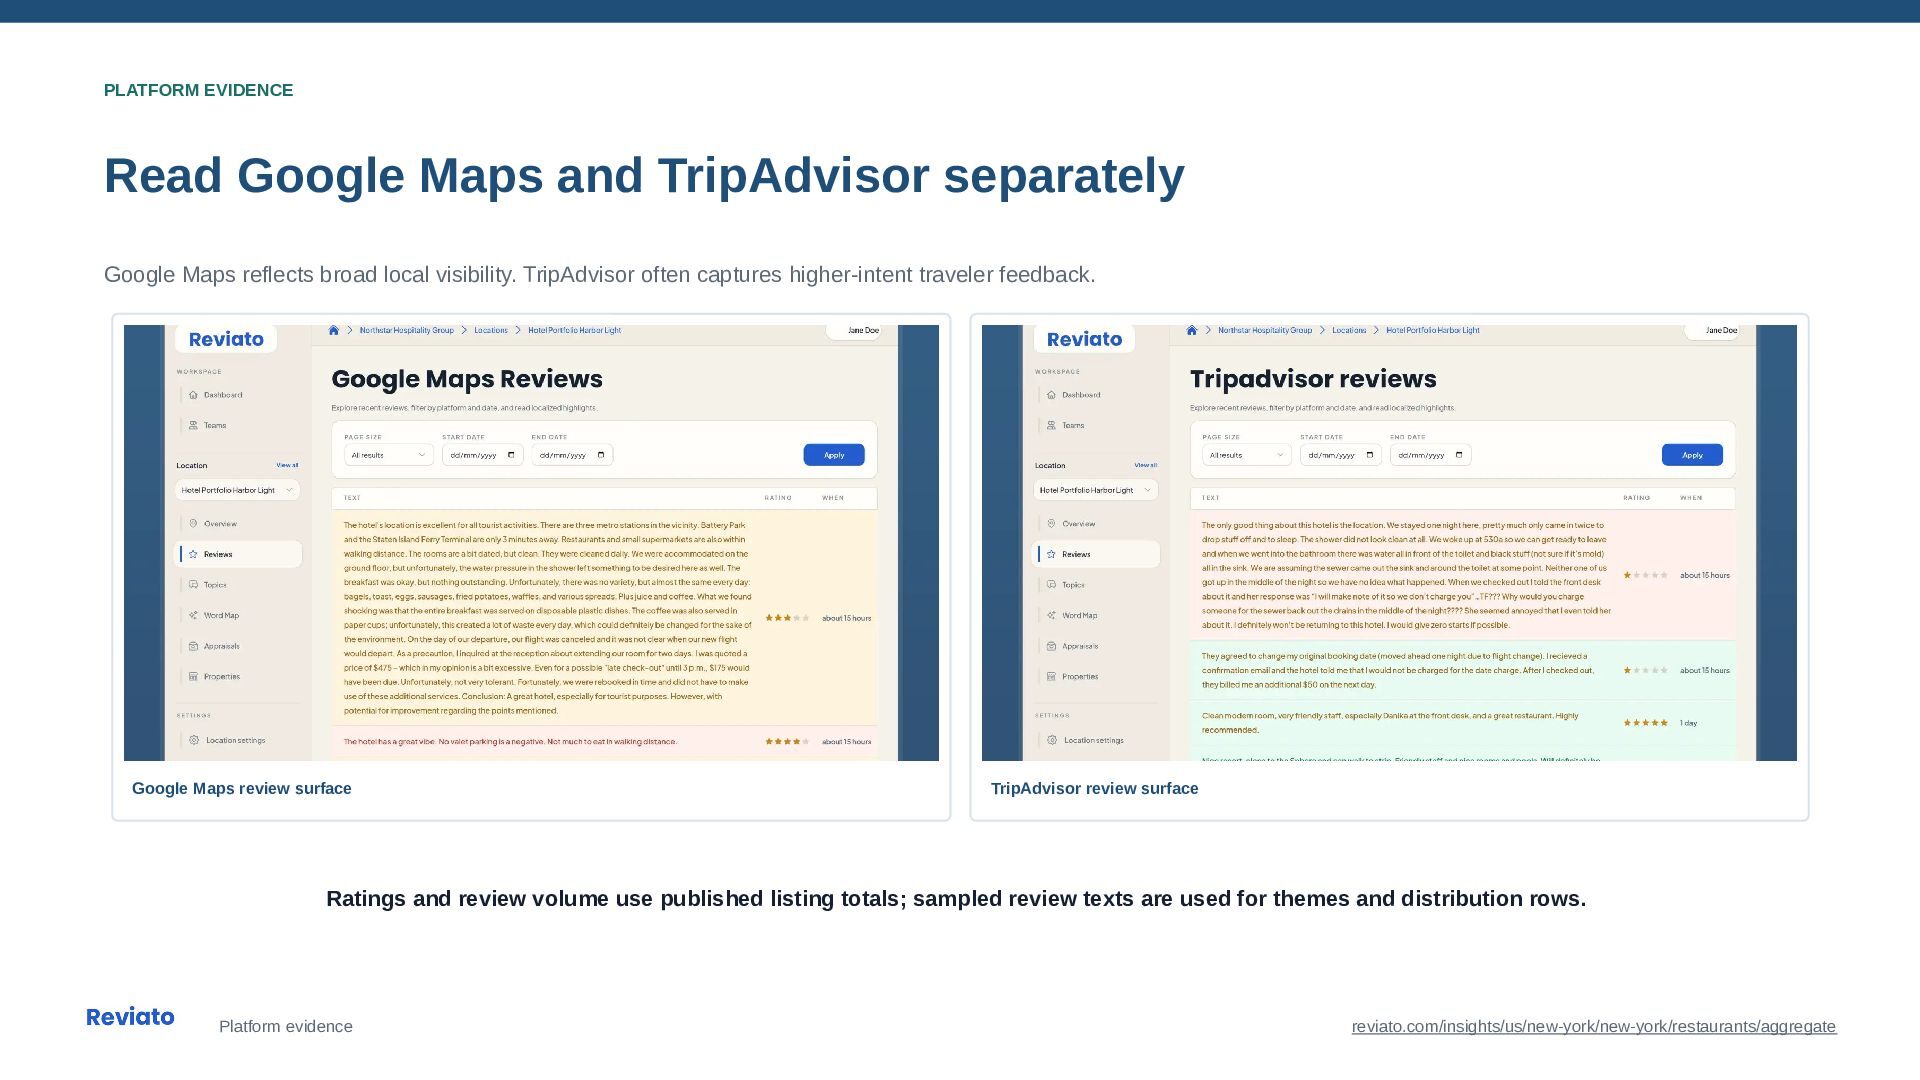
  6. PLATFORM EVIDENCE Read Google Maps and TripAdvisor separately Google Maps

    reflects broad local visibility. TripAdvisor often captures higher-intent traveler feedback. Google Maps review surface TripAdvisor review surface Ratings and review volume use published listing totals; sampled review texts are used for themes and distribution rows. Platform evidence reviato.com/insights/us/new-york/new-york/restaurants/aggregate
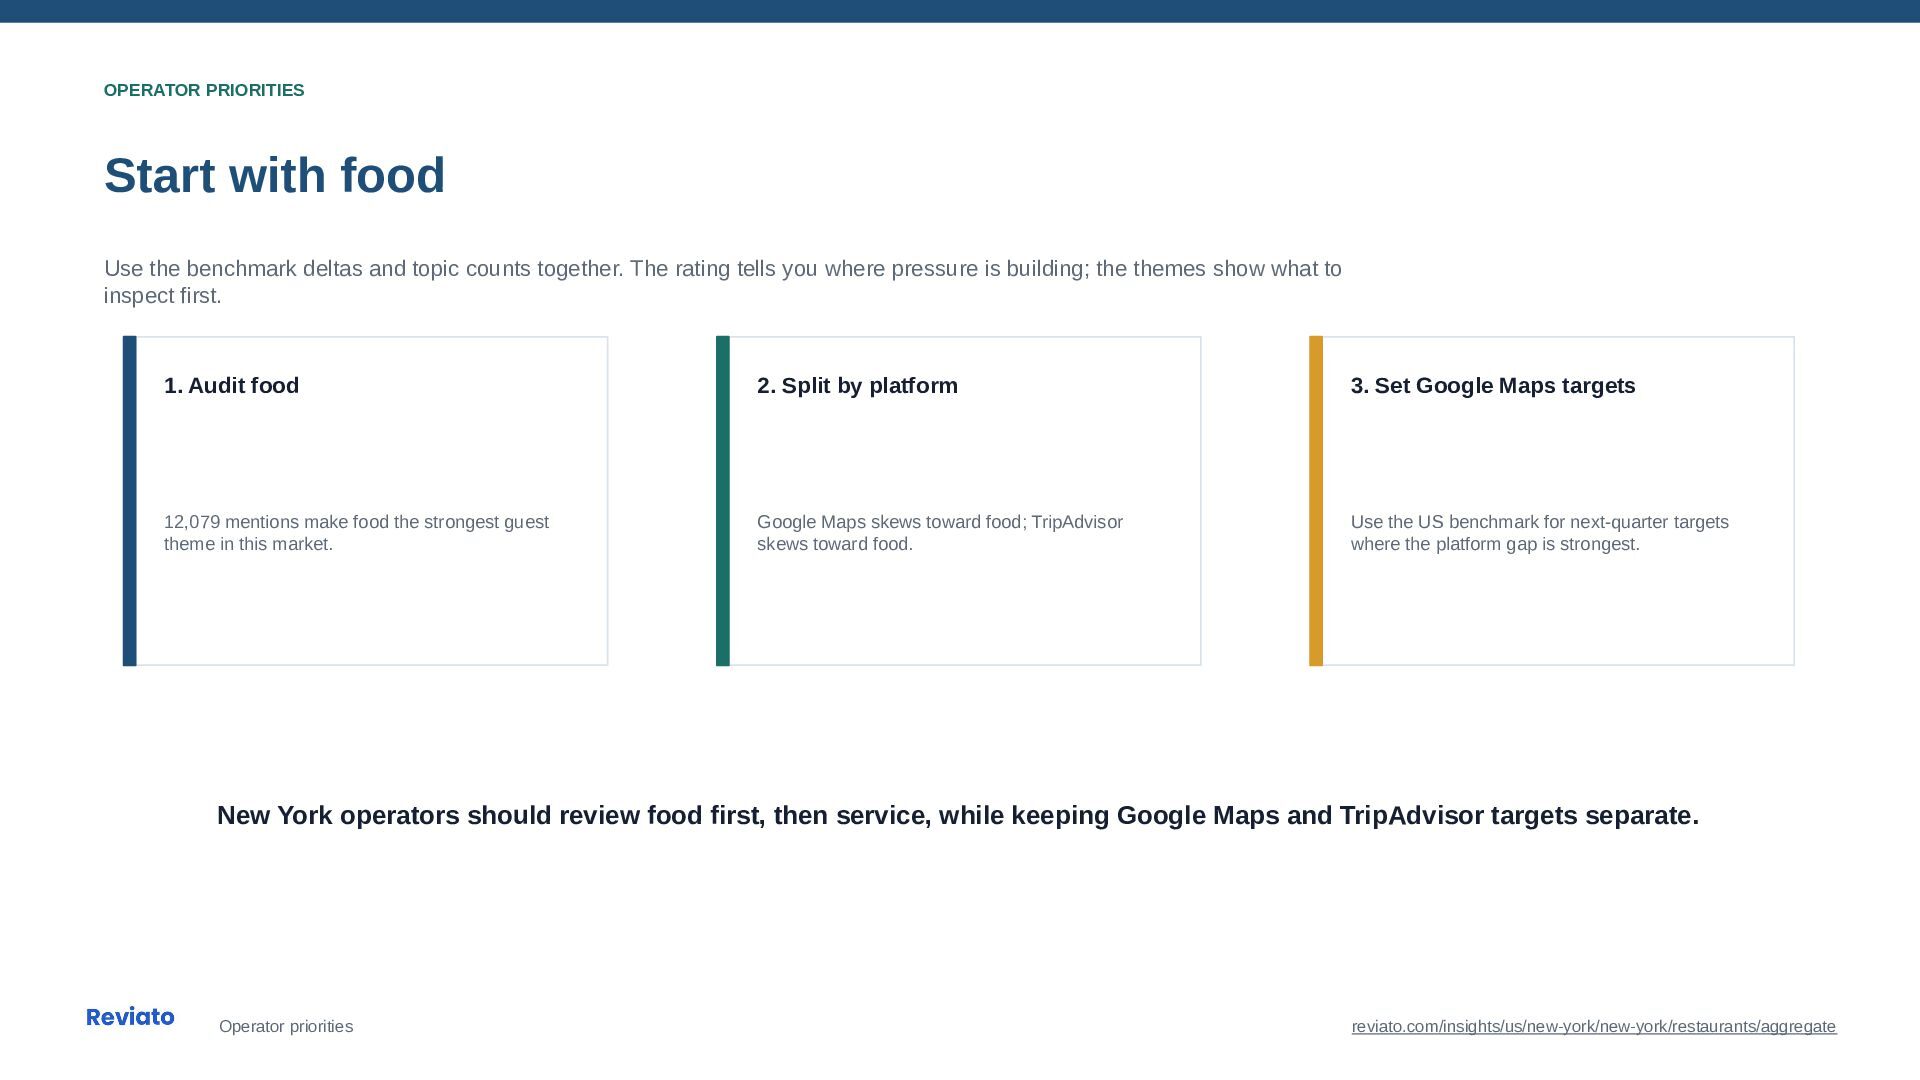
  7. OPERATOR PRIORITIES Start with food Use the benchmark deltas and

    topic counts together. The rating tells you where pressure is building; the themes show what to inspect first. 1. Audit food 12,079 mentions make food the strongest guest theme in this market. 2. Split by platform Google Maps skews toward food; TripAdvisor skews toward food. 3. Set Google Maps targets Use the US benchmark for next-quarter targets where the platform gap is strongest. New York operators should review food first, then service, while keeping Google Maps and TripAdvisor targets separate. Operator priorities reviato.com/insights/us/new-york/new-york/restaurants/aggregate
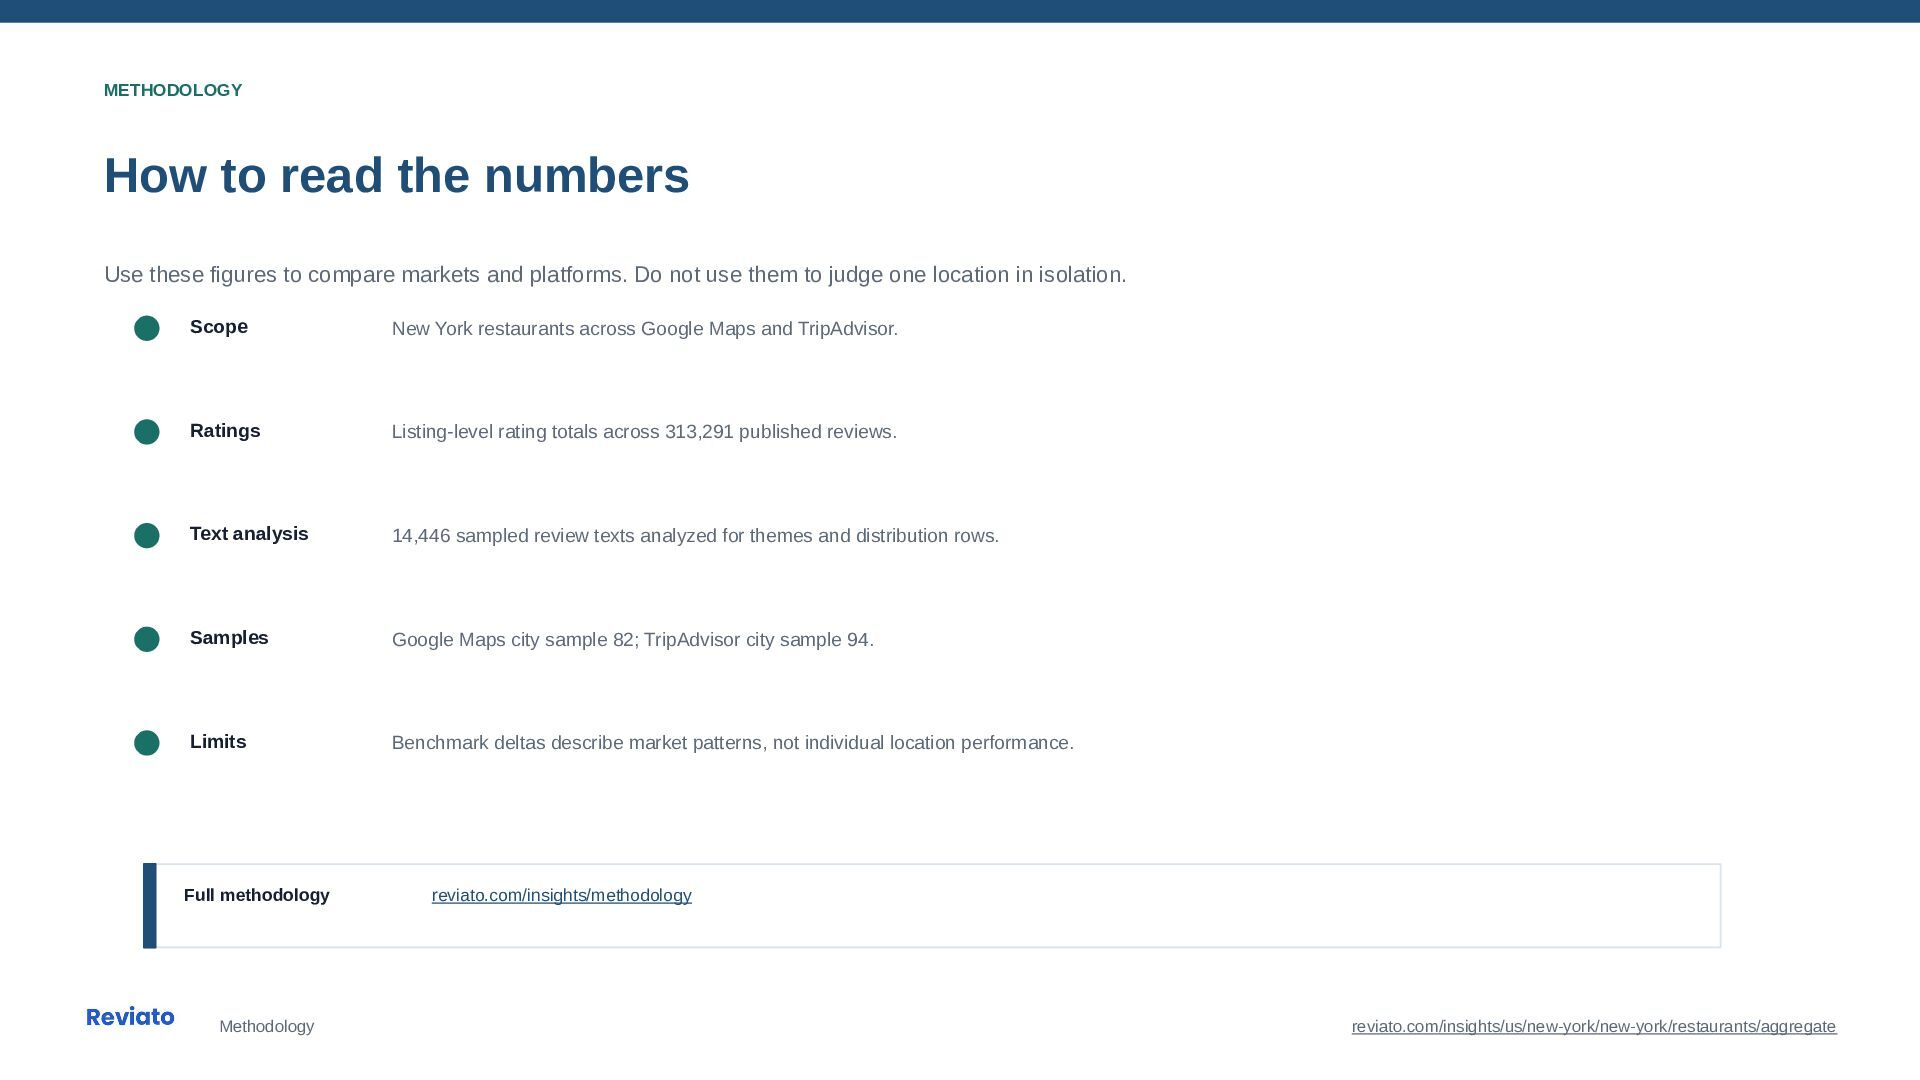
  8. METHODOLOGY How to read the numbers Use these figures to

    compare markets and platforms. Do not use them to judge one location in isolation. Scope New York restaurants across Google Maps and TripAdvisor. Ratings Listing-level rating totals across 313,291 published reviews. Text analysis 14,446 sampled review texts analyzed for themes and distribution rows. Samples Google Maps city sample 82; TripAdvisor city sample 94. Limits Benchmark deltas describe market patterns, not individual location performance. Full methodology reviato.com/insights/methodology Methodology reviato.com/insights/us/new-york/new-york/restaurants/aggregate
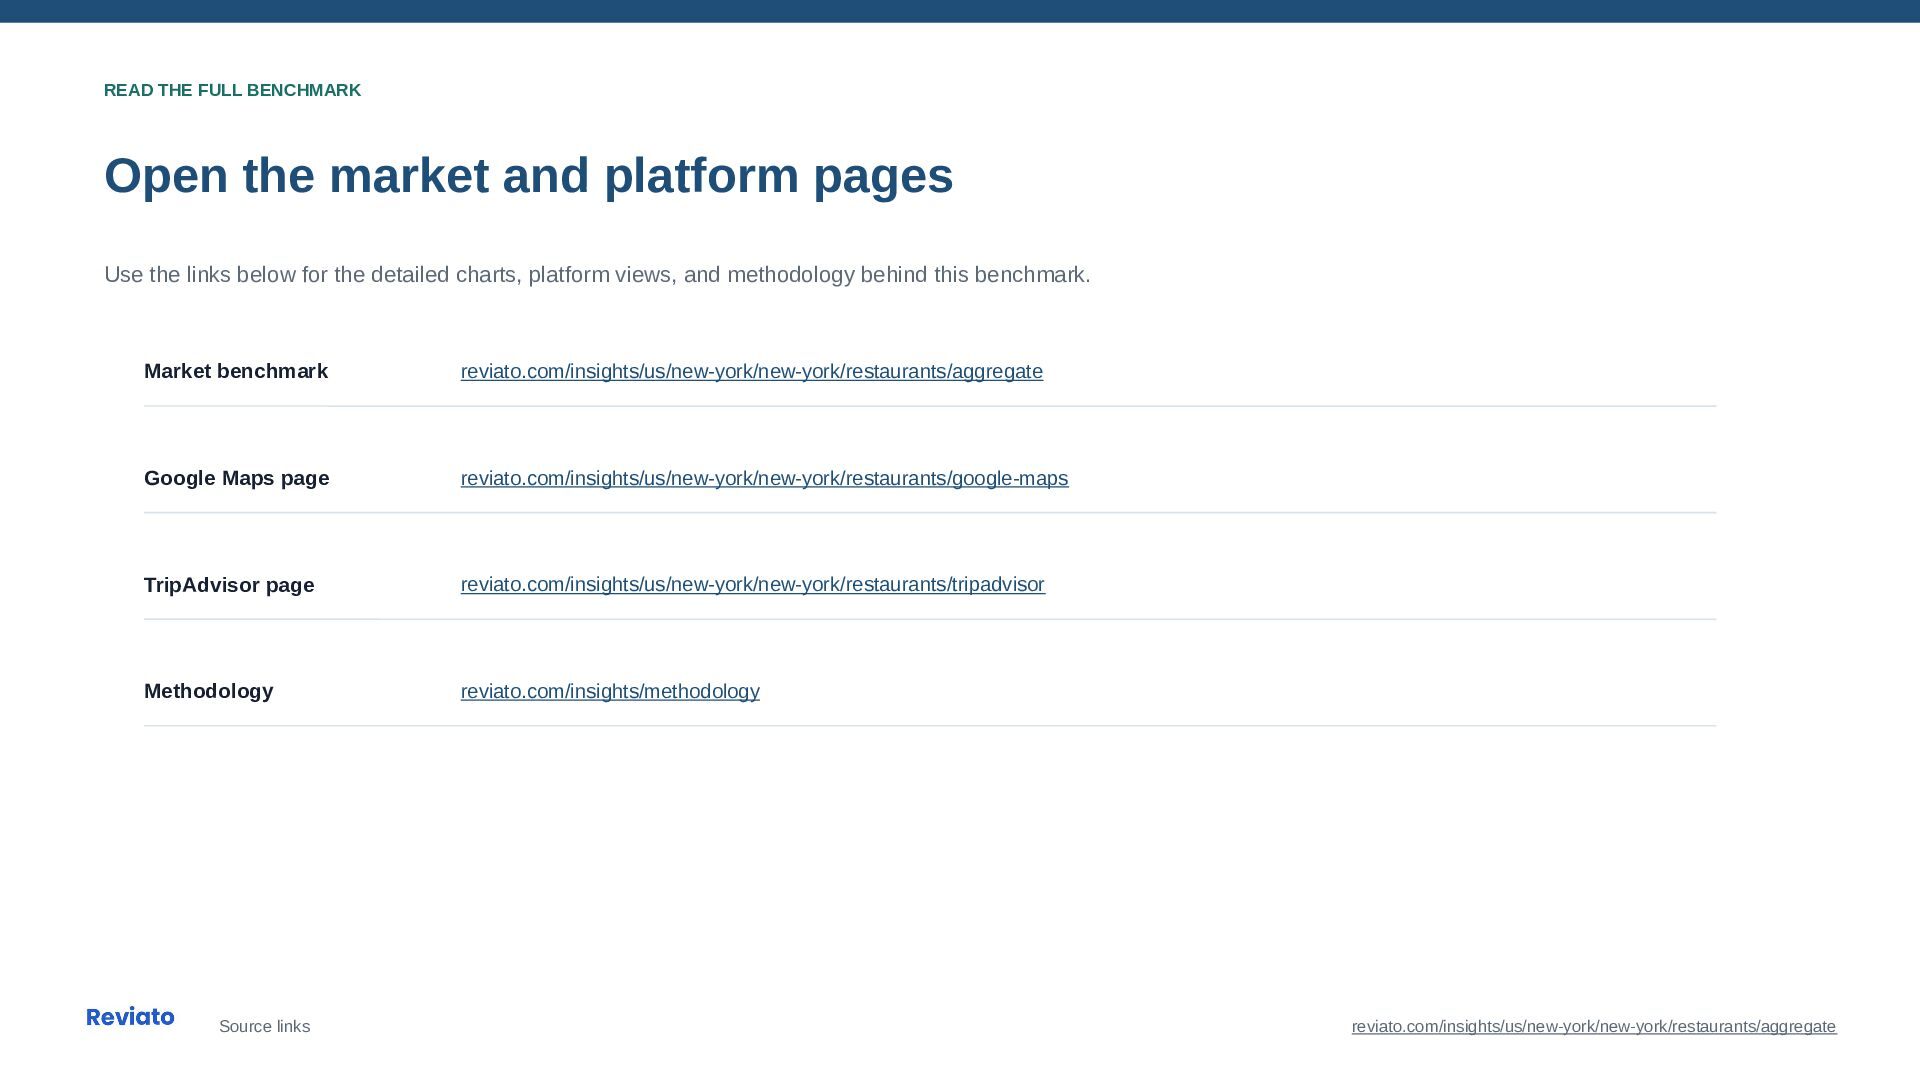
  9. READ THE FULL BENCHMARK Open the market and platform pages

    Use the links below for the detailed charts, platform views, and methodology behind this benchmark. Market benchmark reviato.com/insights/us/new-york/new-york/restaurants/aggregate Google Maps page reviato.com/insights/us/new-york/new-york/restaurants/google-maps TripAdvisor page reviato.com/insights/us/new-york/new-york/restaurants/tripadvisor Methodology reviato.com/insights/methodology Source links reviato.com/insights/us/new-york/new-york/restaurants/aggregate