int y = x / 0; NullPointerException ArrayIndexOutOfBoundsException ArithmeticException Crash! Crash! Crash! nullRef->callMethod(); array[999999] = 42; int y = x / 0;
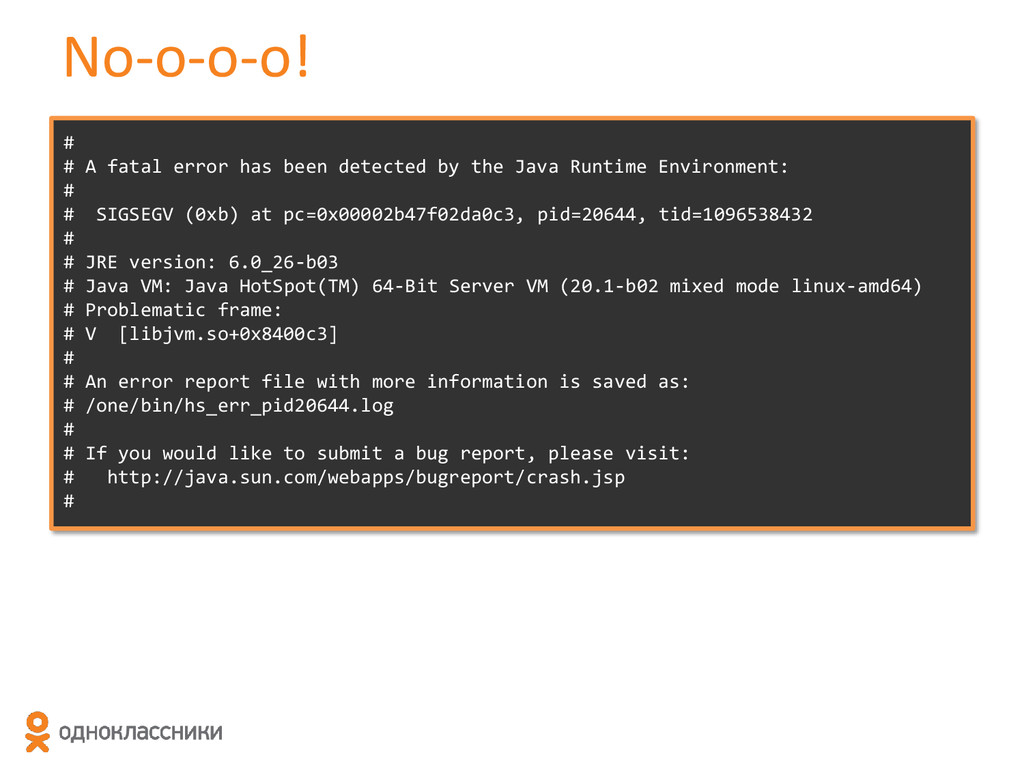
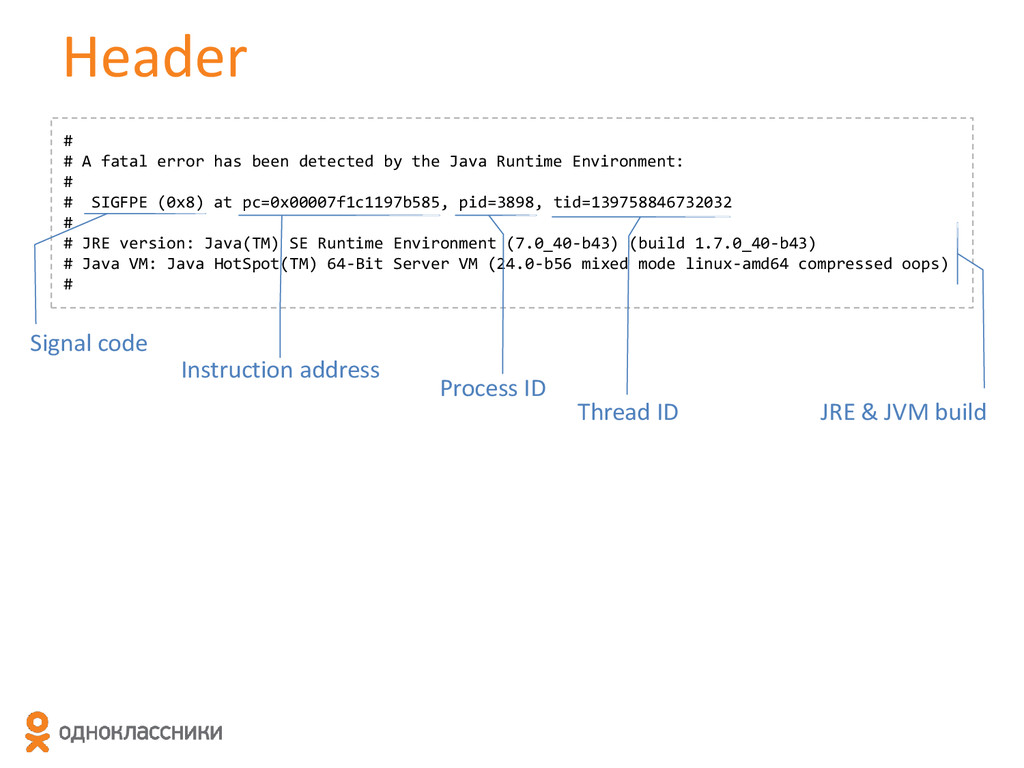
the Java Runtime Environment: # # SIGSEGV (0xb) at pc=0x00002b47f02da0c3, pid=20644, tid=1096538432 # # JRE version: 6.0_26-b03 # Java VM: Java HotSpot(TM) 64-Bit Server VM (20.1-b02 mixed mode linux-amd64) # Problematic frame: # V [libjvm.so+0x8400c3] # # An error report file with more information is saved as: # /one/bin/hs_err_pid20644.log # # If you would like to submit a bug report, please visit: # http://java.sun.com/webapps/bugreport/crash.jsp #
location in the heap RBX=0x00000000bd250ff0 is an oop {method} - klass: {other class} RCX=0x0000000000000000 is an unknown value RDX=0x00000000ffffffff is an unallocated location in the heap RSP=0x00007f1c2469d798 is pointing into the stack for thread: 0x00007f1c1c009800 RBP=0x00007f1c2469d7f0 is pointing into the stack for thread: 0x00007f1c1c009800 RSI=0x00007f1c2469d800 is pointing into the stack for thread: 0x00007f1c1c009800 RDI=0x00007f1c1c0099e8 is an unknown value R8 =0x0000c5448e8f8389 is an unknown value R9 =0x00000850b3941760 is an unknown value R10=0x00007f1c1901270c is at code_begin+620 in an Interpreter codelet method entry point (kind = native) [0x00007f1c190124a0, 0x00007f1c19012d00] 2144 bytes R11=0x00007f1c234de260: <offset 0x8a7260> in libjvm.so at 0x00007f1c22c37000 R12=0x0000000000000000 is an unknown value R13=0x00000000bd250ff0 is an oop {method} - klass: {other class} R14=0x00007f1c2469d818 is pointing into the stack for thread: 0x00007f1c1c009800 R15=0x00007f1c1c009800 is a thread
code, j=interpreted, Vv=VM code, C=native code) C [libdiv.so+0x585] Java_demo1_NativeDiv_div+0x5 j demo1.NativeDiv.access$000(II)I+2 j demo1.NativeDiv$1.run()V+20 j demo1.NativeDiv.runLoop(ILjava/lang/Runnable;)V+8 j demo1.NativeDiv.main([Ljava/lang/String;)V+21 v ~StubRoutines::call_stub V [libjvm.so+0x5f8405] JavaCalls::call_helper()+0x365 V [libjvm.so+0x5f6e68] JavaCalls::call()+0x28 V [libjvm.so+0x62f8d9] jni_invoke_static()+0x219 V [libjvm.so+0x638962] jni_CallStaticVoidMethod+0x162 C [libjli.so+0x36d9] JavaMain+0x7e9 Frame type Decoded address (DLL, symbol + offset) Bytecode index Offset in bytes Stack range Stack pointer
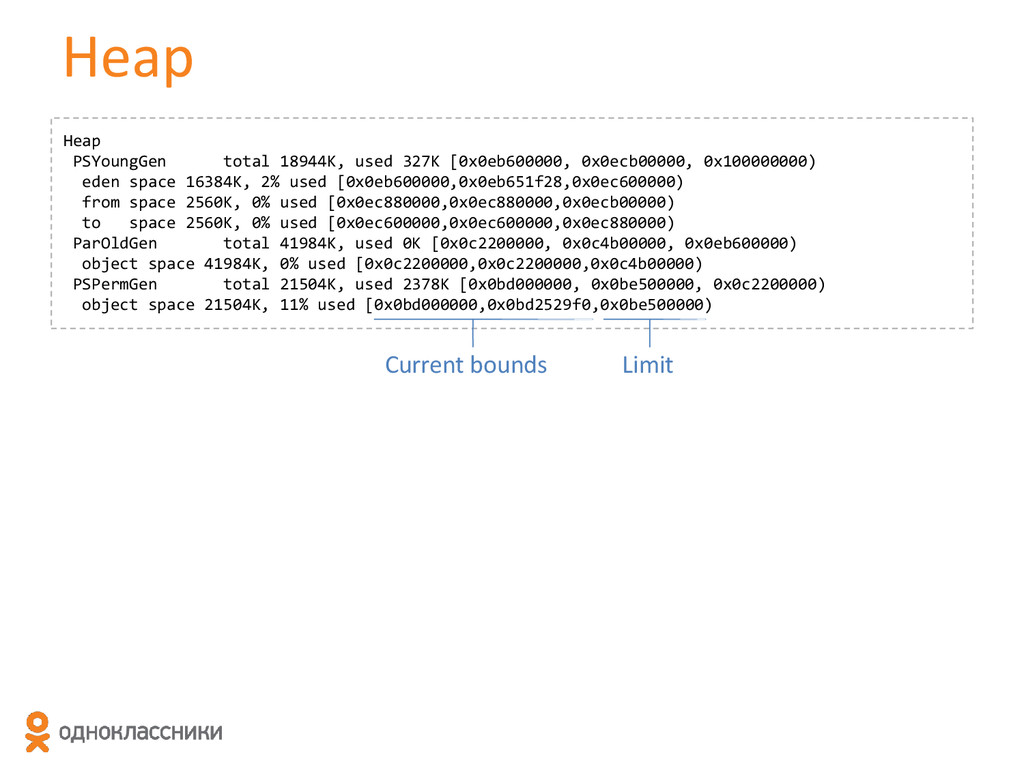
eden space 16384K, 2% used [0x0eb600000,0x0eb651f28,0x0ec600000) from space 2560K, 0% used [0x0ec880000,0x0ec880000,0x0ecb00000) to space 2560K, 0% used [0x0ec600000,0x0ec600000,0x0ec880000) ParOldGen total 41984K, used 0K [0x0c2200000, 0x0c4b00000, 0x0eb600000) object space 41984K, 0% used [0x0c2200000,0x0c2200000,0x0c4b00000) PSPermGen total 21504K, used 2378K [0x0bd000000, 0x0be500000, 0x0c2200000) object space 21504K, 11% used [0x0bd000000,0x0bd2529f0,0x0be500000) Current bounds Limit
![Java vs. C • • • nullRef.callMethod(); array[999999] = 42;](https://files.speakerdeck.com/presentations/2ab977b128df471c97eb9a796c813d02/slide_1.jpg)
![Frame # Problematic frame: # C [libdiv.so+0x585] Java_demo1_NativeDiv_div+0x5 Frame type](https://files.speakerdeck.com/presentations/2ab977b128df471c97eb9a796c813d02/slide_7.jpg)
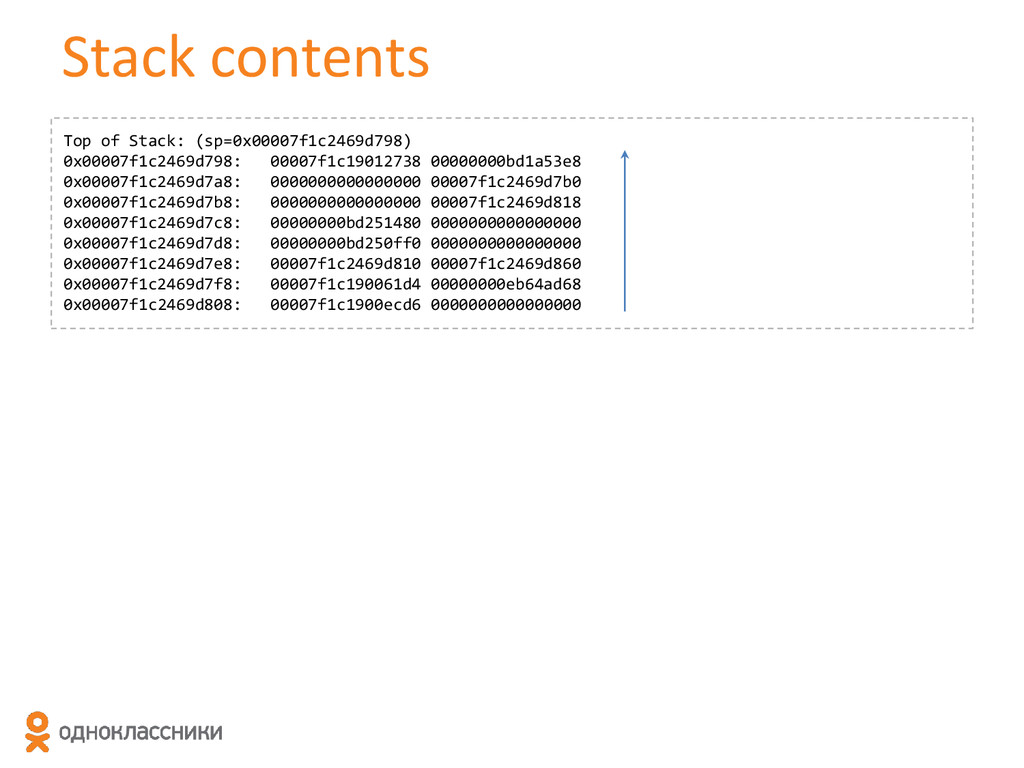
![Stack Stack: [0x7f1c2459e000,0x7f1c2469f000], sp=0x7f1c2469d798, free space=1021k Native frames: (J=compiled Java](https://files.speakerdeck.com/presentations/2ab977b128df471c97eb9a796c813d02/slide_14.jpg)
![Thank you! • Contact – [email protected] • Our blog –](https://files.speakerdeck.com/presentations/2ab977b128df471c97eb9a796c813d02/slide_29.jpg)