Upgrade to Pro
— share decks privately, control downloads, hide ads and more …
Speaker Deck
Features
Speaker Deck
PRO
Sign in
Sign up for free
Search
Search
PyLadies Stockholm Workshop
Search
Sponsored
·
Your Podcast. Everywhere. Effortlessly.
Share. Educate. Inspire. Entertain. You do you. We'll handle the rest.
→
Lynn Root
June 01, 2013
Technology
240
0
Share
PyLadies Stockholm Workshop
Introduction to PyLadies + Intro to Python with Data Visualization
Lynn Root
June 01, 2013
More Decks by Lynn Root
See All by Lynn Root
The Design of Everyday APIs - PyCon 2024
roguelynn
1
3.1k
The Design of Everyday APIs
roguelynn
0
24k
Music Is Just Wiggly Air
roguelynn
0
450
Advanced asyncio: Solving Real-world Production Problems
roguelynn
6
9.3k
asyncio: We Did It Wrong
roguelynn
1
5.7k
Tracing, Fast & Slow: Digging into and improving your web service's performance
roguelynn
0
900
How to spy with Python: So easy, the NSA can do it!
roguelynn
2
2.1k
Spotify's Love/Hate Relationship with DNS
roguelynn
3
1.3k
Diversity: We're Not Done Yet
roguelynn
2
720
Other Decks in Technology
See All in Technology
long-running-tasks
cipepser
2
450
サプライチェーンセキュリティの空白地帯 - 信頼できる”依存性”の未来を考える
rung
PRO
2
510
形式手法特論:公平性制約の位相的特徴づけ #kernelvm / Kernel VM Study Kansai 12th
ytaka23
1
640
AIガバナンス実践 - 生成AIコネクタのデータ漏洩リスクと実務対策
knishioka
0
140
Oracle AI Database@Azure:サービス概要のご紹介
oracle4engineer
PRO
6
1.8k
個人の発見を、組織の知恵に 〜生成AI活用を"探索"から"組織の仕組み"へ〜
kintotechdev
2
190
なぜハノーバーメッセに行くべきなのか 〜初参加だから語れること〜
tanakaseiya
0
180
類似画像検索モデルの開発ノウハウ
lycorptech_jp
PRO
4
1.1k
管理アカウント単一運用からAWS Organizationsに移行するの大変で滅
hiramax
0
330
React、まだ楽しくて草
uhyo
3
470
Databricks 月刊サービスアップデート 2026年05月号
tyosi1212
0
120
string地獄を脱出する
sansantech
PRO
1
110
Featured
See All Featured
Reality Check: Gamification 10 Years Later
codingconduct
0
2.2k
Taking LLMs out of the black box: A practical guide to human-in-the-loop distillation
inesmontani
PRO
3
2.2k
Heart Work Chapter 1 - Part 1
lfama
PRO
7
36k
State of Search Keynote: SEO is Dead Long Live SEO
ryanjones
0
200
A Tale of Four Properties
chriscoyier
163
24k
We Are The Robots
honzajavorek
0
240
Between Models and Reality
mayunak
4
320
Fashionably flexible responsive web design (full day workshop)
malarkey
408
66k
svc-hook: hooking system calls on ARM64 by binary rewriting
retrage
2
280
Exploring the relationship between traditional SERPs and Gen AI search
raygrieselhuber
PRO
2
4k
Sam Torres - BigQuery for SEOs
techseoconnect
PRO
0
280
AI Search: Implications for SEO and How to Move Forward - #ShenzhenSEOConference
aleyda
1
1.3k
Transcript
None
Lynn Root @roguelynn roguelynn.com
[email protected]
Lynn Root Software Engineer at Red Hat PyLadies of San
Francisco Python Software Foundation Board Member
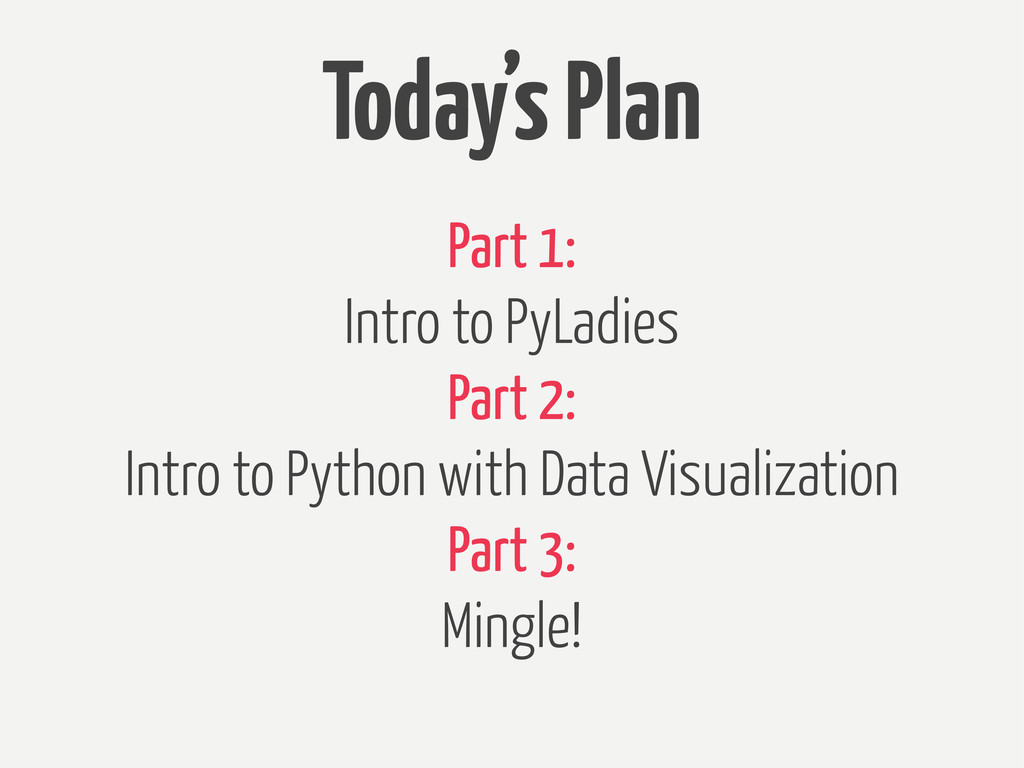
Today’s Plan Part 1: Intro to PyLadies Part 2: Intro
to Python with Data Visualization Part 3: Mingle!
First things first! Thank you to Spotify for initiating this
idea, hosting me, and sponsoring the first PyLadies of Stockholm event!
International mentorship group Women + friends Python + Open Source
community Supported by sponsors, donors, and the PSF
Developers or Aspiring Full time or hobby Just in —
with Python
Workshops Development sprints Speaker series Hack nights
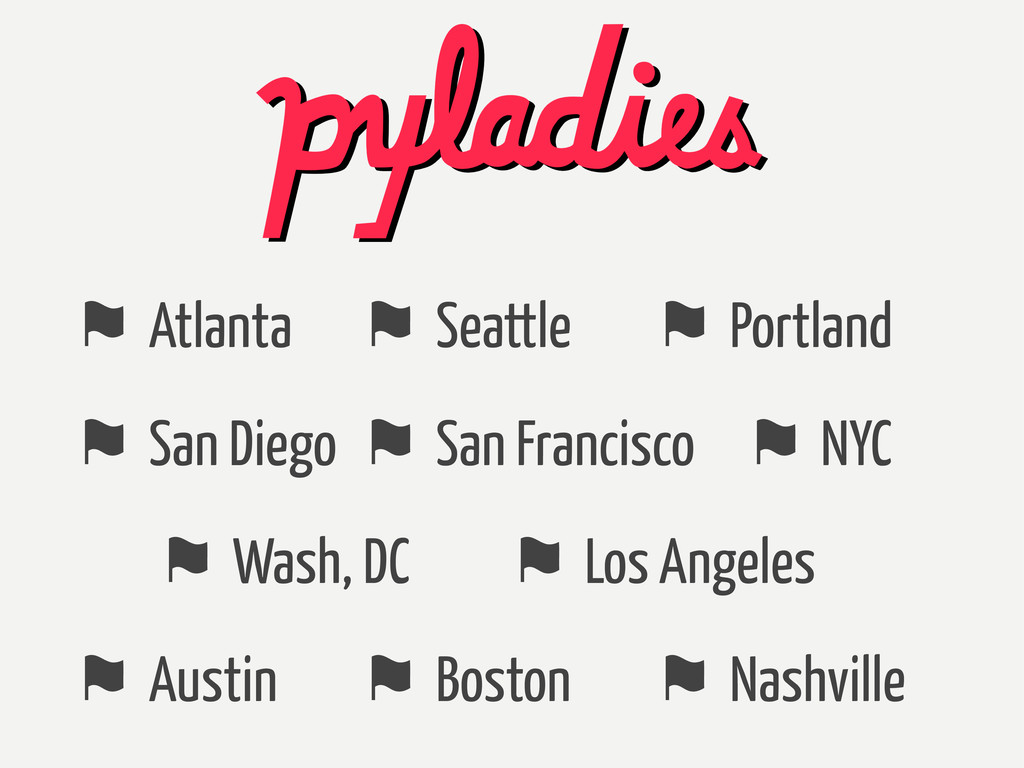
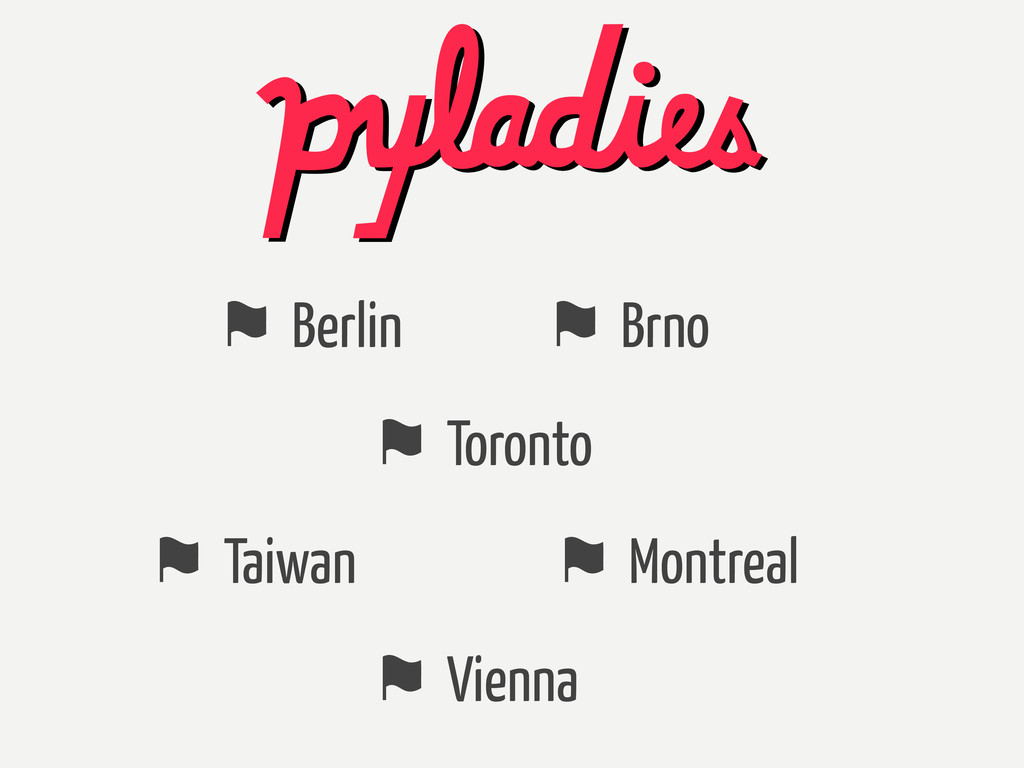
⚑ San Francisco ⚑ Los Angeles ⚑ Wash, DC ⚑
Atlanta ⚑ Seattle ⚑ Portland ⚑ San Diego ⚑ NYC ⚑ Nashville ⚑ Boston ⚑ Austin
⚑ Toronto ⚑ Montreal ⚑ Taiwan ⚑ Berlin ⚑ Brno
⚑ Vienna
And now...
Stockholm!!1! @PyLadiesSthlm
What does it take to lead a PyLadies group?
My story!
Ulterior motive: find an interested PyLady to continue PyLadies of
Stockholm
pyladies.com #pyladies on Freenode github.com/pyladies Questions? Interested folks?
Intro to Python with Data Visualization Adapted from newcoder.io/dataviz
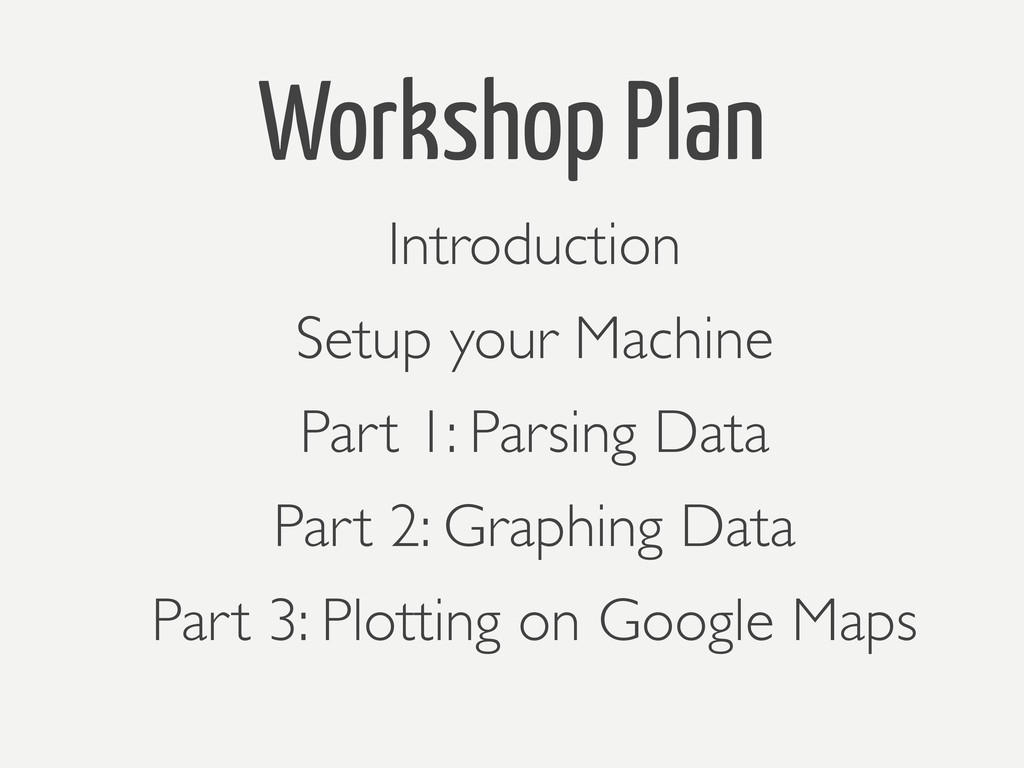
Workshop Plan Introduction Setup your Machine Part 1: Parsing Data
Part 2: Graphing Data Part 3: Plotting on Google Maps
Introduction Project Goals Python Libraries
Project Parse data from a CSV file Create graphs Plot
on Google Maps
Goals Run & import a Python file Python’s data structures
Make simple graphs + maps
Python Libraries NumPy & matplotlib xml + Google Mapping
Follow along: http://newcoder.io/pdf
Setup your Machine Python git C compiler pip + virtualenv
virtualenvwrapper (Mac/Linux) Text Editor
Part 0: Setup Setup for Data Visualization
Setup the Project 1. Make project directory 2. Clone my
repository 3. Install dependencies
Break time
Part 1: parse.py Parsing our sample data
Part 1: parse.py 1. Module Setup 2. Attacking the Parse
Function 3. Using the Parse Function 4. Putting it into Action 5. Explore it further
Part 1.1: Module Setup 1. import 2. global variables
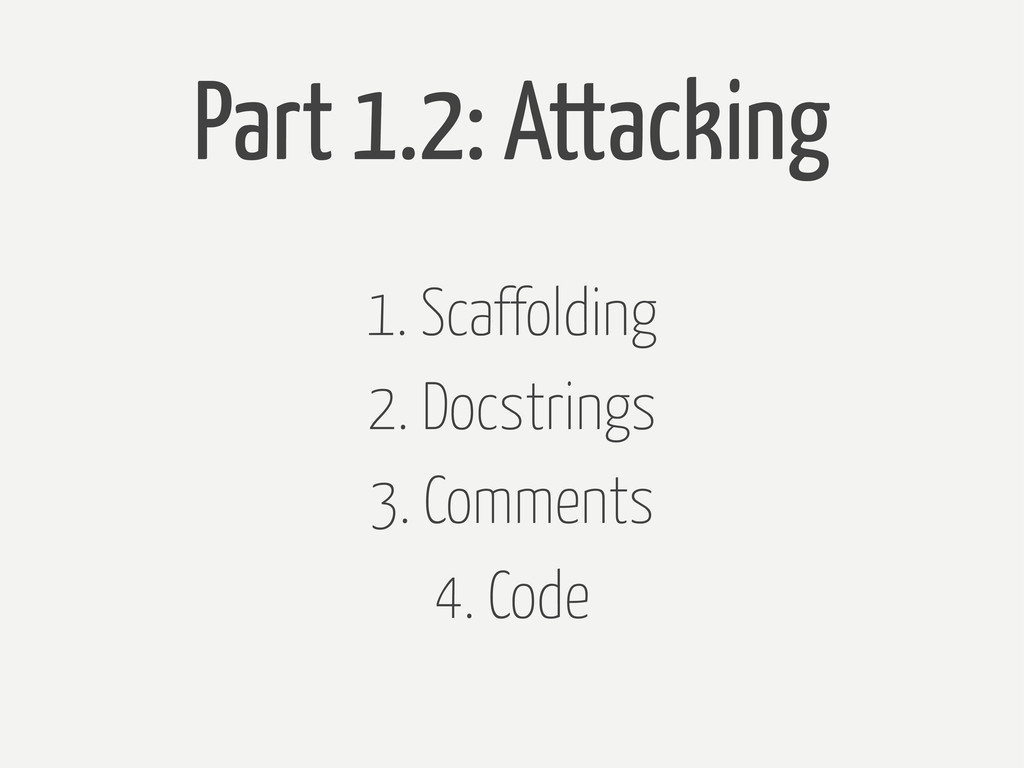
Part 1.2: Attacking 1. Scaffolding 2. Docstrings 3. Comments 4.
Code
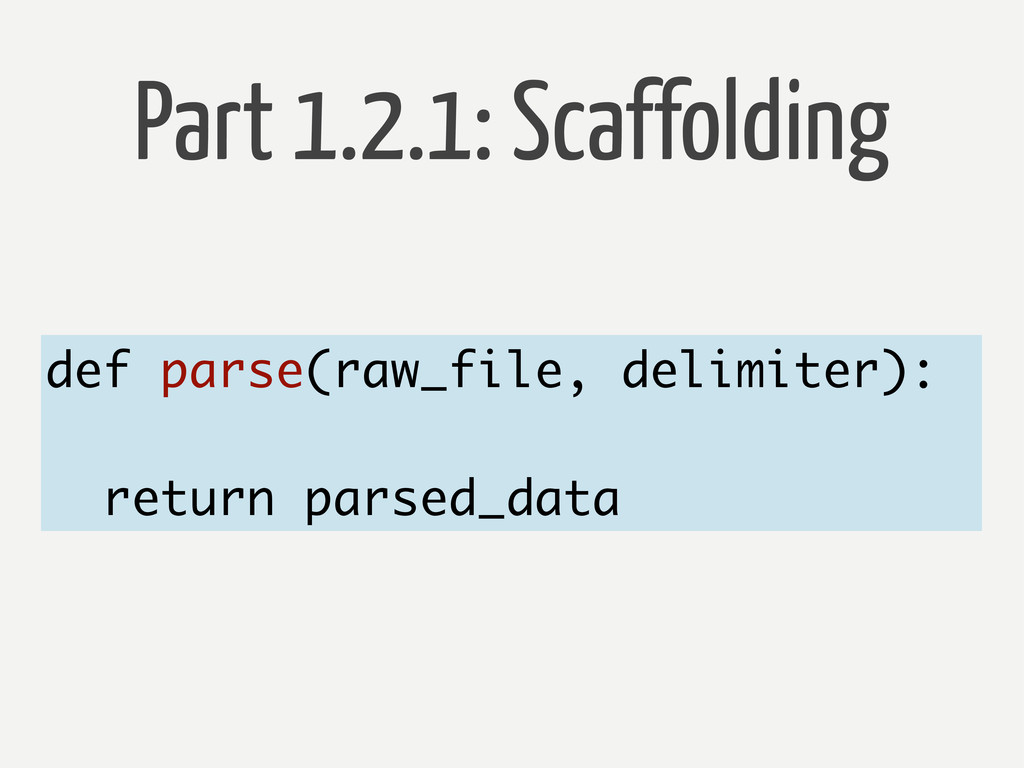
Part 1.2.1: Scaffolding def parse(raw_file, delimiter): return parsed_data
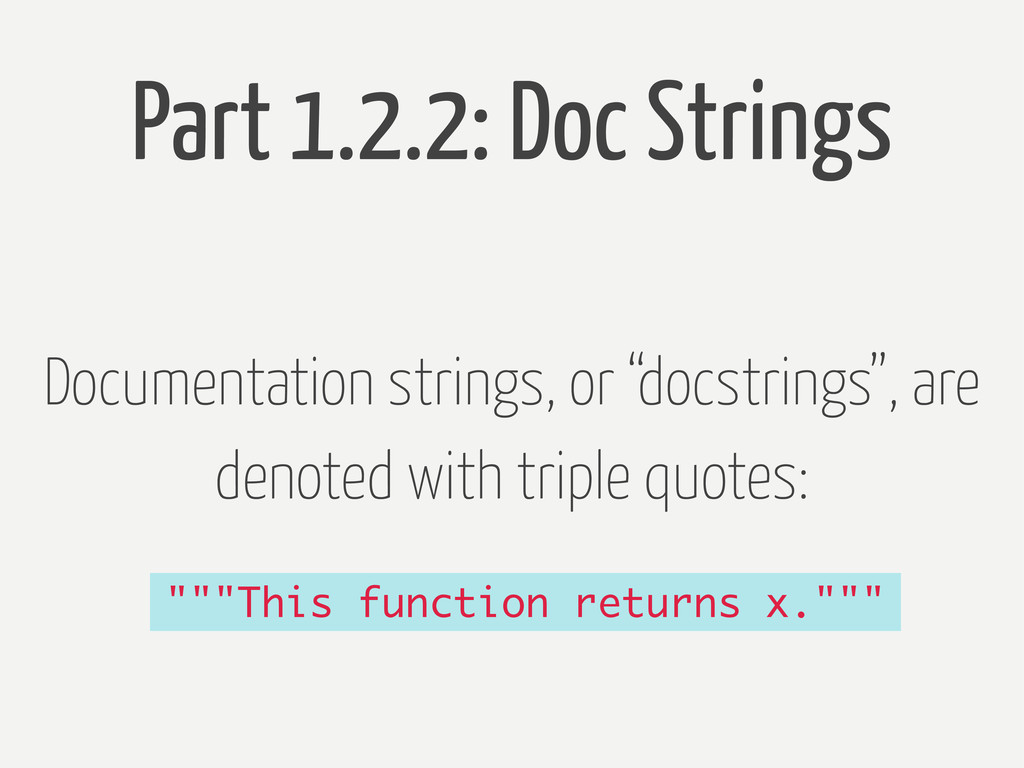
Part 1.2.2: Doc Strings Documentation strings, or “docstrings”, are denoted
with triple quotes: """This function returns x."""
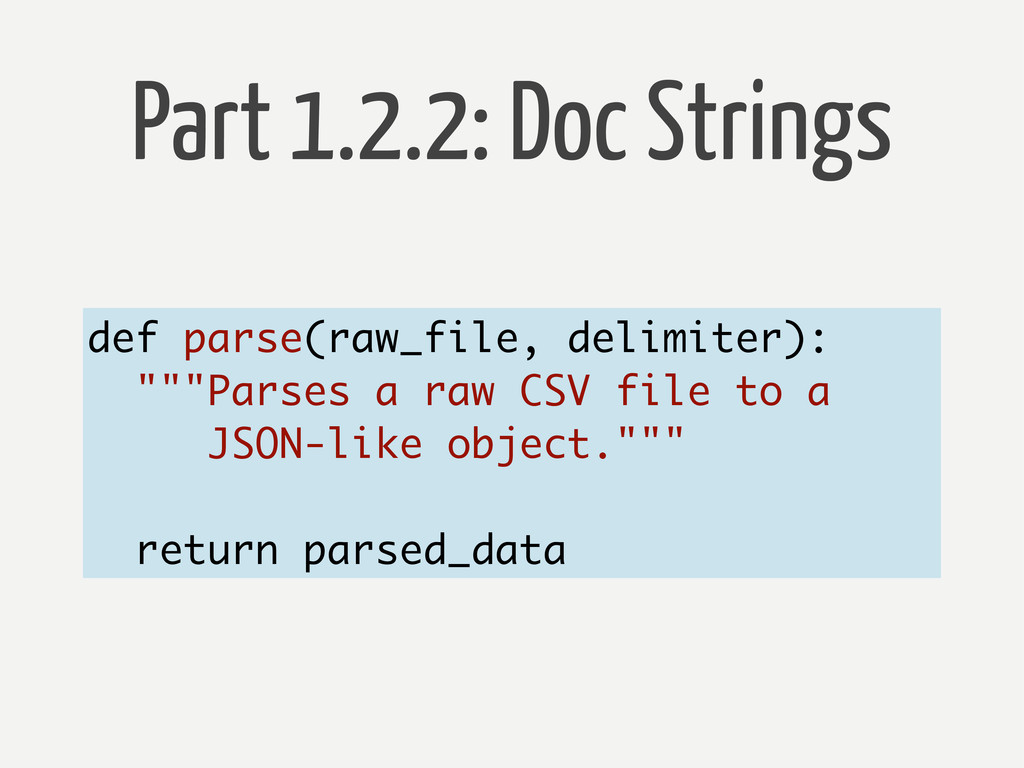
Part 1.2.2: Doc Strings def parse(raw_file, delimiter): """Parses a raw
CSV file to a JSON-like object.""" return parsed_data
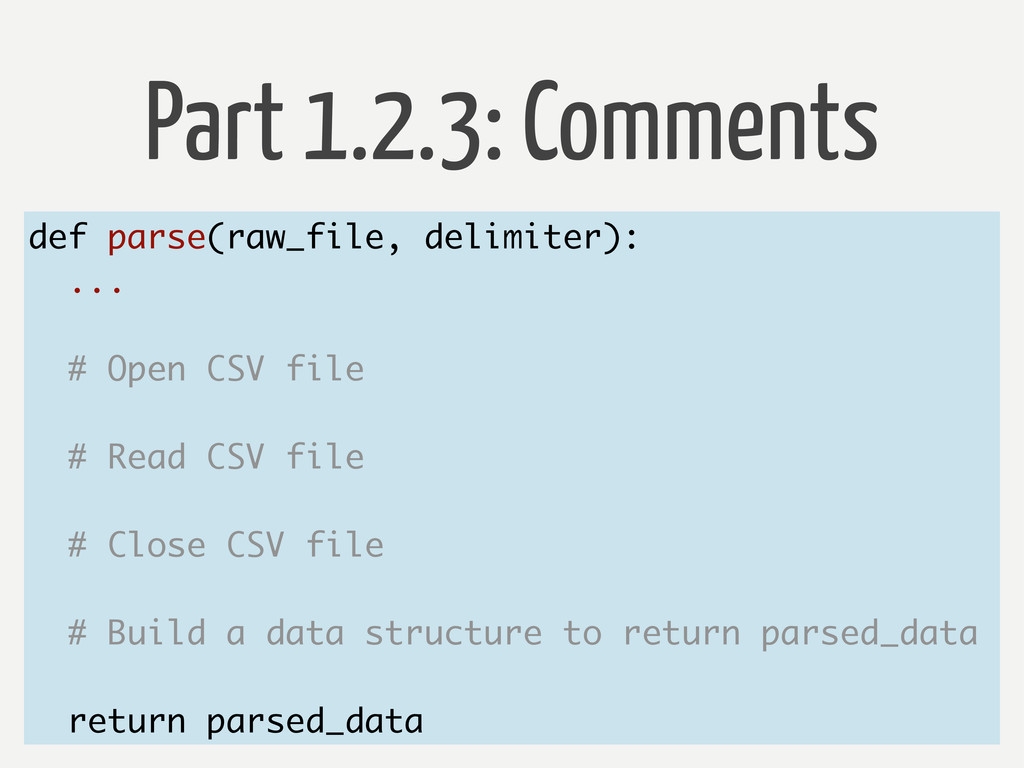
Part 1.2.3: Comments def parse(raw_file, delimiter): ... # Open CSV
file # Read CSV file # Close CSV file # Build a data structure to return parsed_data return parsed_data
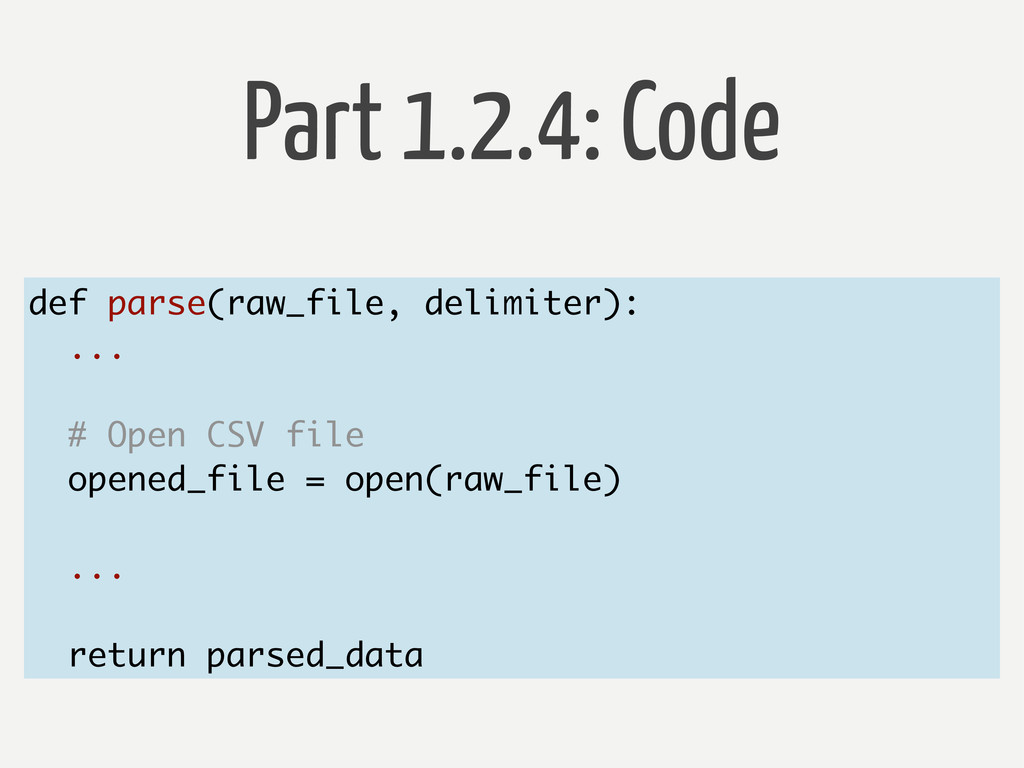
Part 1.2.4: Code def parse(raw_file, delimiter): ... # Open CSV
file opened_file = open(raw_file) ... return parsed_data
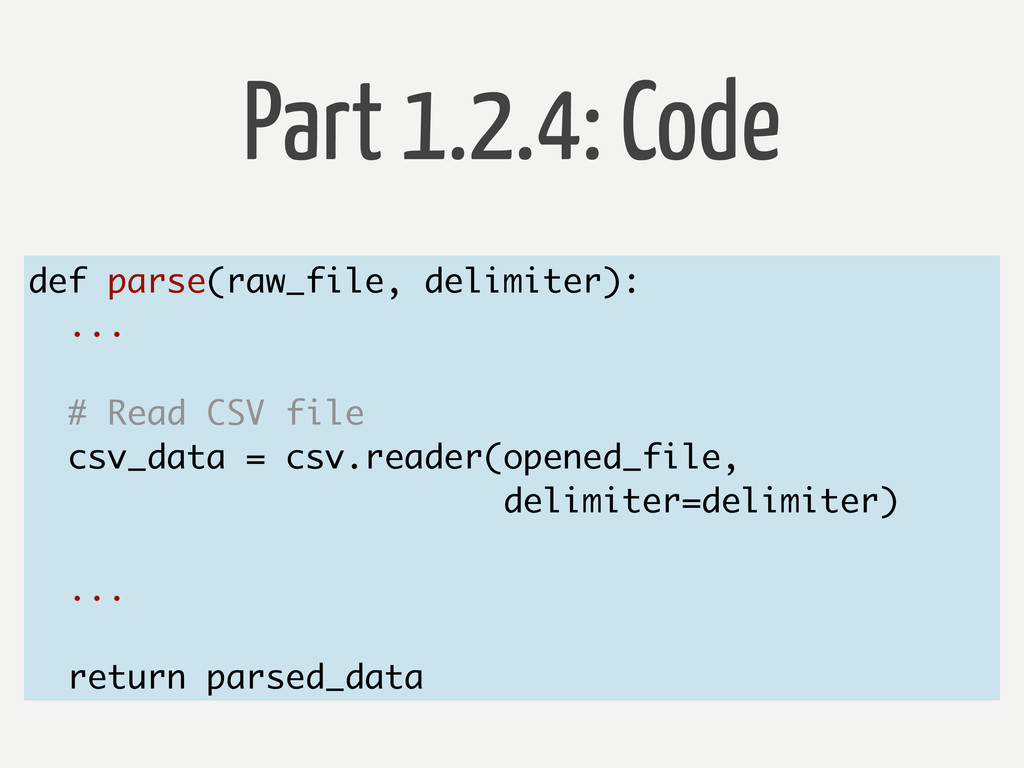
Part 1.2.4: Code def parse(raw_file, delimiter): ... # Read CSV
file csv_data = csv.reader(opened_file, delimiter=delimiter) ... return parsed_data
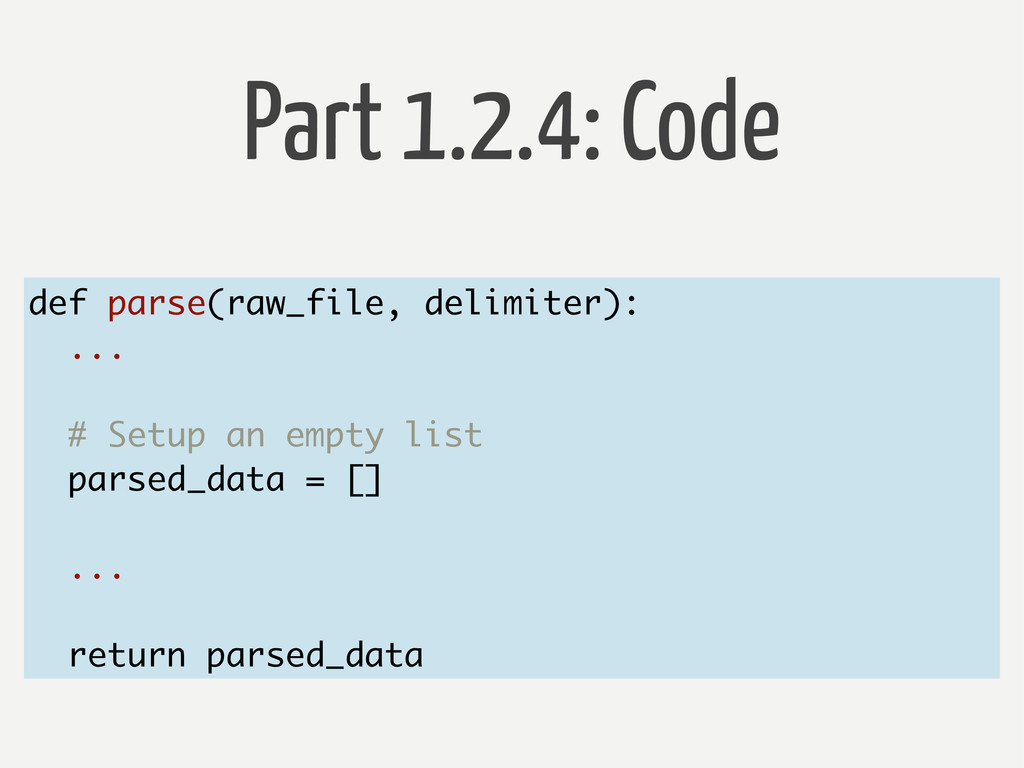
Part 1.2.4: Code def parse(raw_file, delimiter): ... # Setup an
empty list parsed_data = [] ... return parsed_data
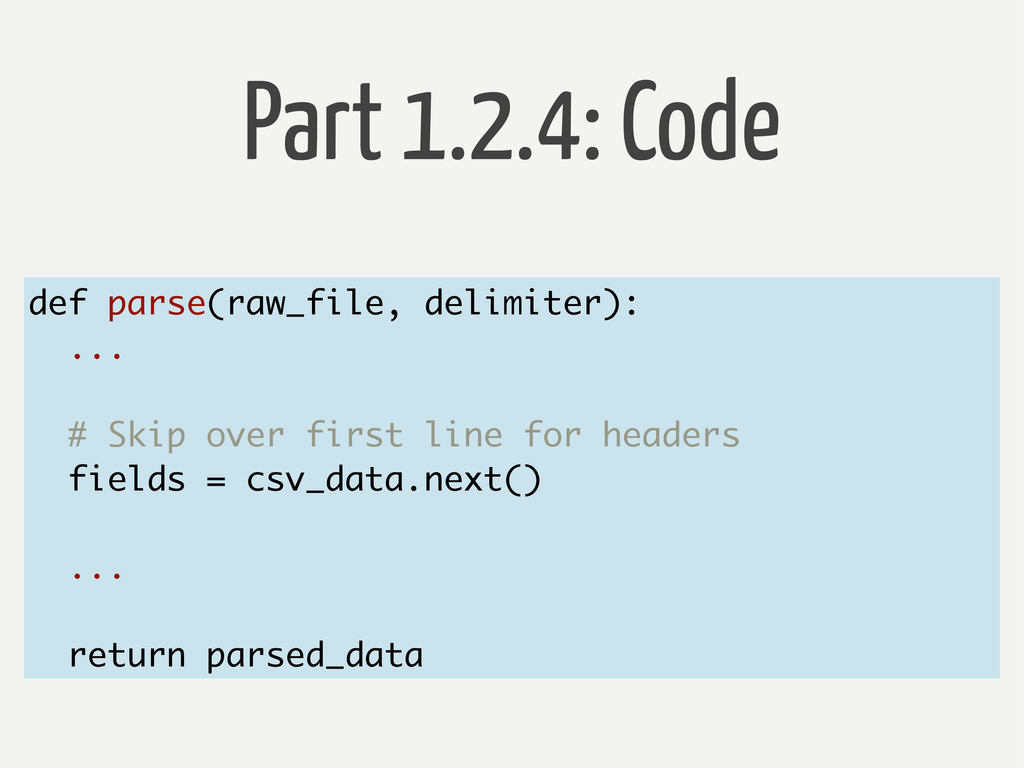
Part 1.2.4: Code def parse(raw_file, delimiter): ... # Skip over
first line for headers fields = csv_data.next() ... return parsed_data
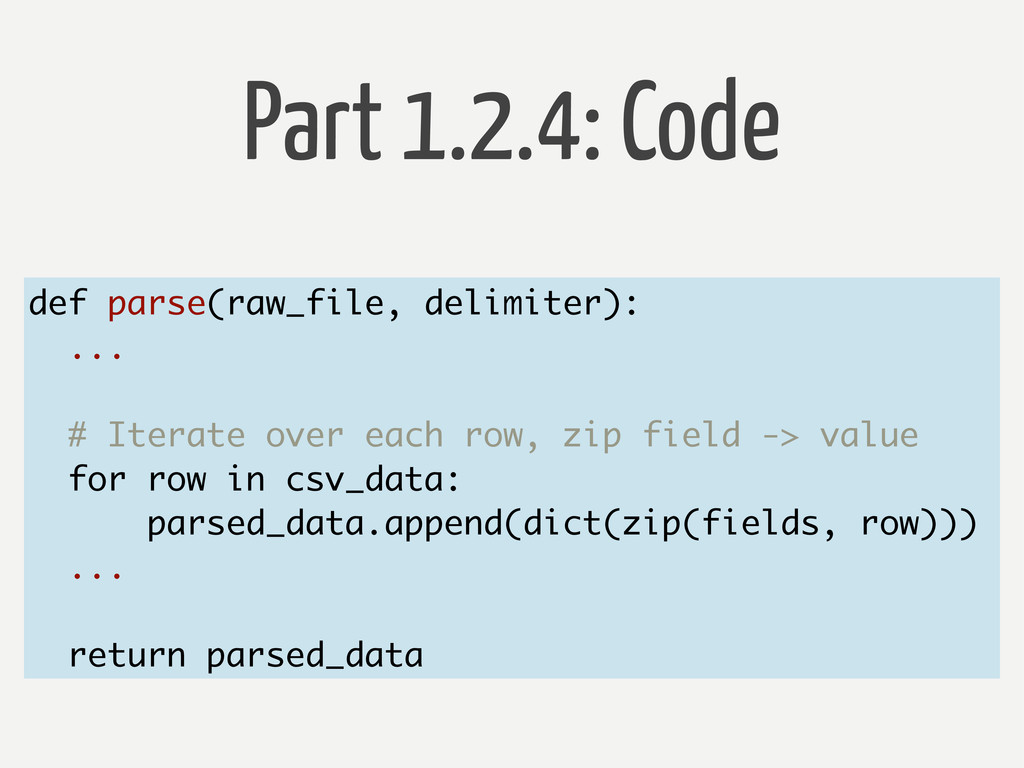
Part 1.2.4: Code def parse(raw_file, delimiter): ... # Iterate over
each row, zip field -> value for row in csv_data: parsed_data.append(dict(zip(fields, row))) ... return parsed_data
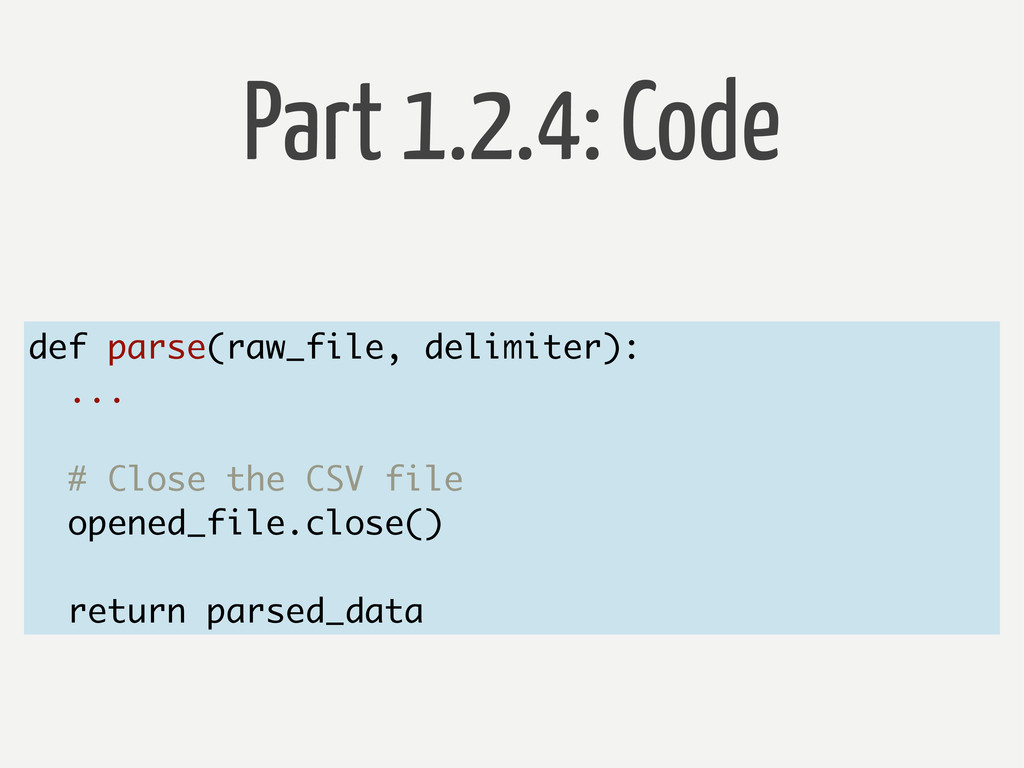
Part 1.2.4: Code def parse(raw_file, delimiter): ... # Close the
CSV file opened_file.close() return parsed_data
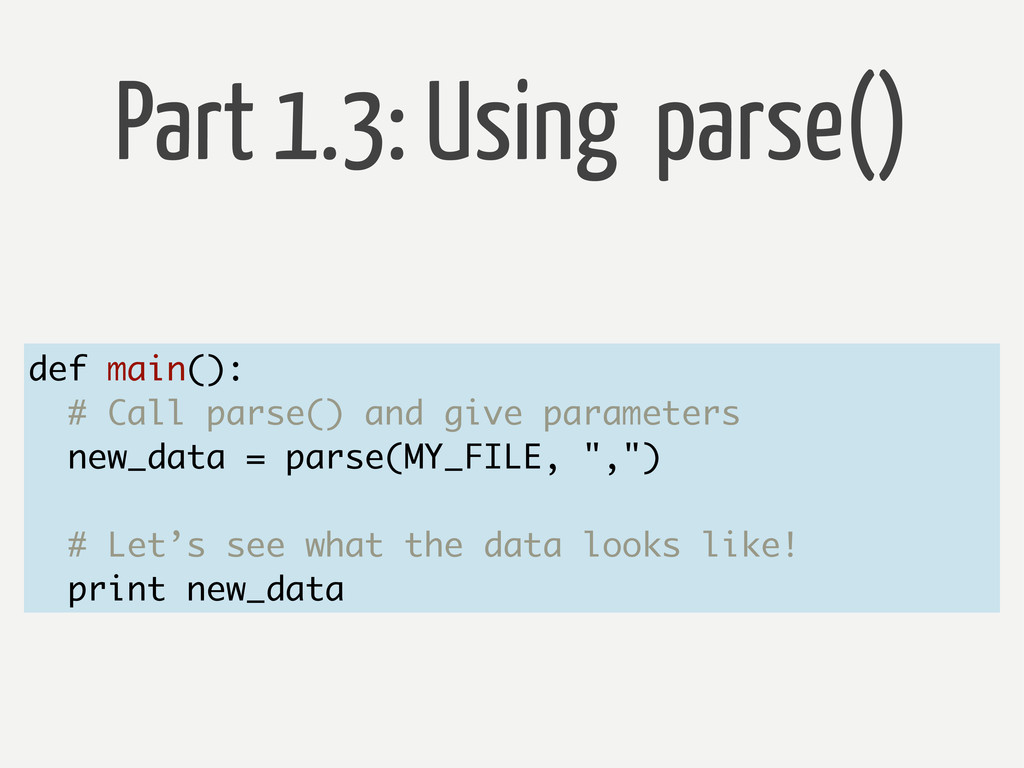
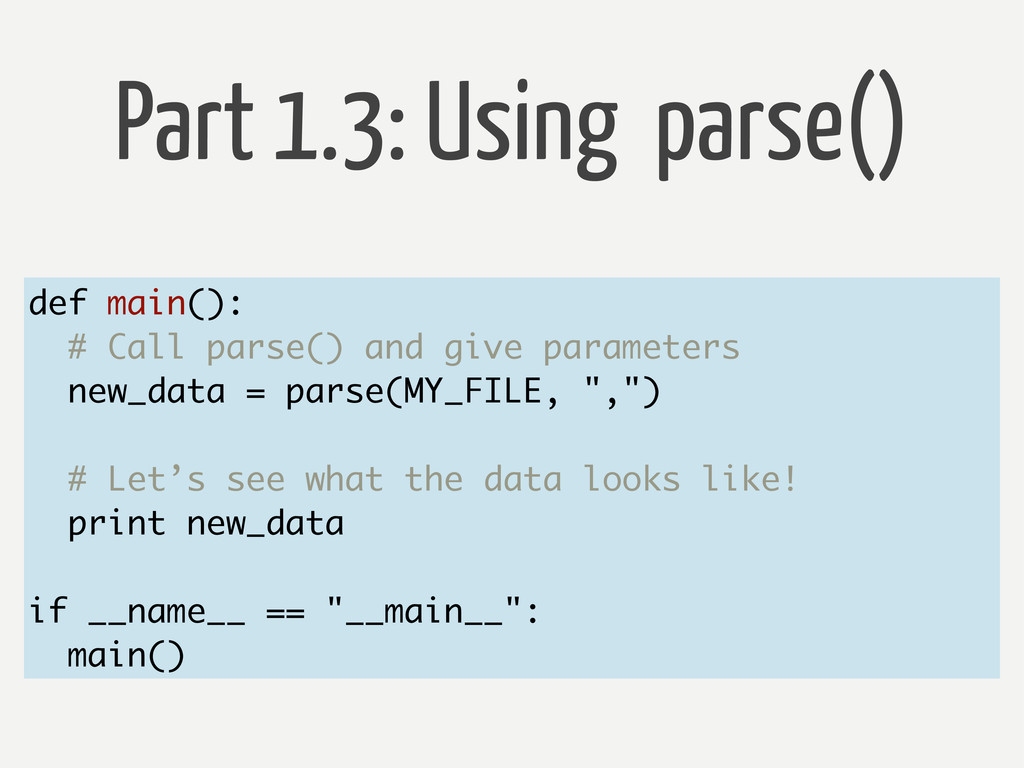
Part 1.3: Using parse() def main(): # Call parse() and
give parameters new_data = parse(MY_FILE, ",") # Let’s see what the data looks like! print new_data
Part 1.3: Using parse() def main(): # Call parse() and
give parameters new_data = parse(MY_FILE, ",") # Let’s see what the data looks like! print new_data if __name__ == "__main__": main()
Part 1.4: Action Follow along with me in my terminal
Part 1.5: Explore Follow along with me in my terminal
Break time
Part 2: graph.py Graphing our sample data
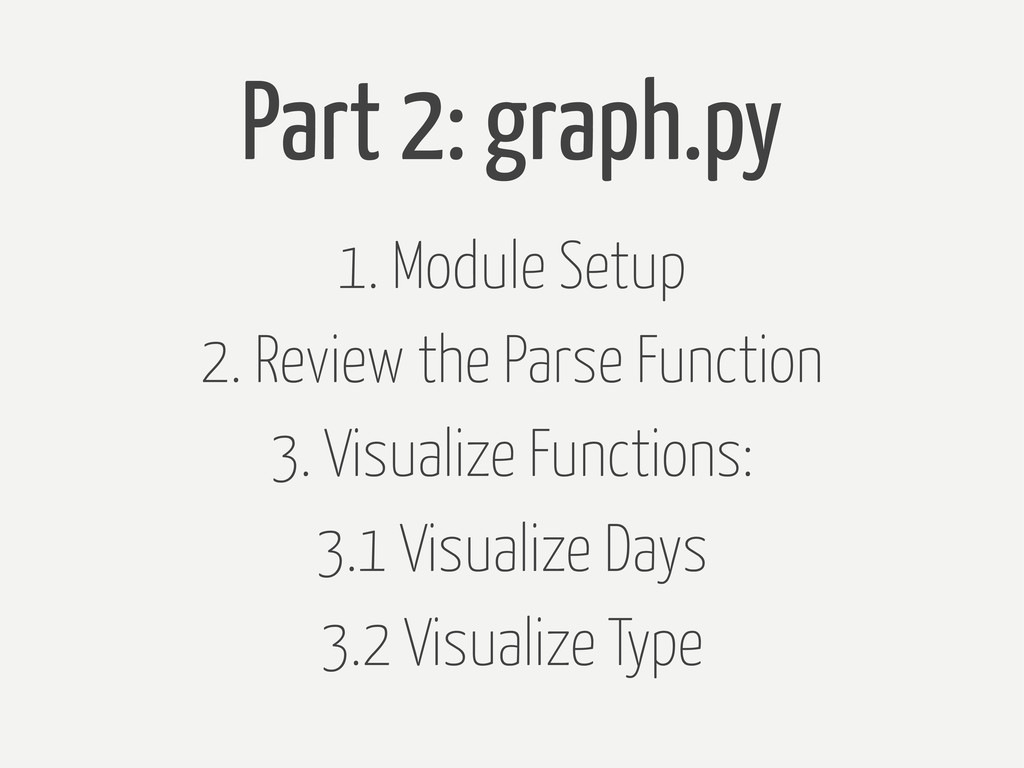
Part 2: graph.py 1. Module Setup 2. Review the Parse
Function 3. Visualize Functions: 3.1 Visualize Days 3.2 Visualize Type
Part 2.1: Module Setup 1. order of import statements 2.
global variables
Part 2.2: Review parse() 1. Copying over parse function 2.
Same MY_FILE variable 3. Remove comments - still readable (python FTW!!1!)
Part 2.3: Visualize 1. Visualize Days 2. Visualize Type
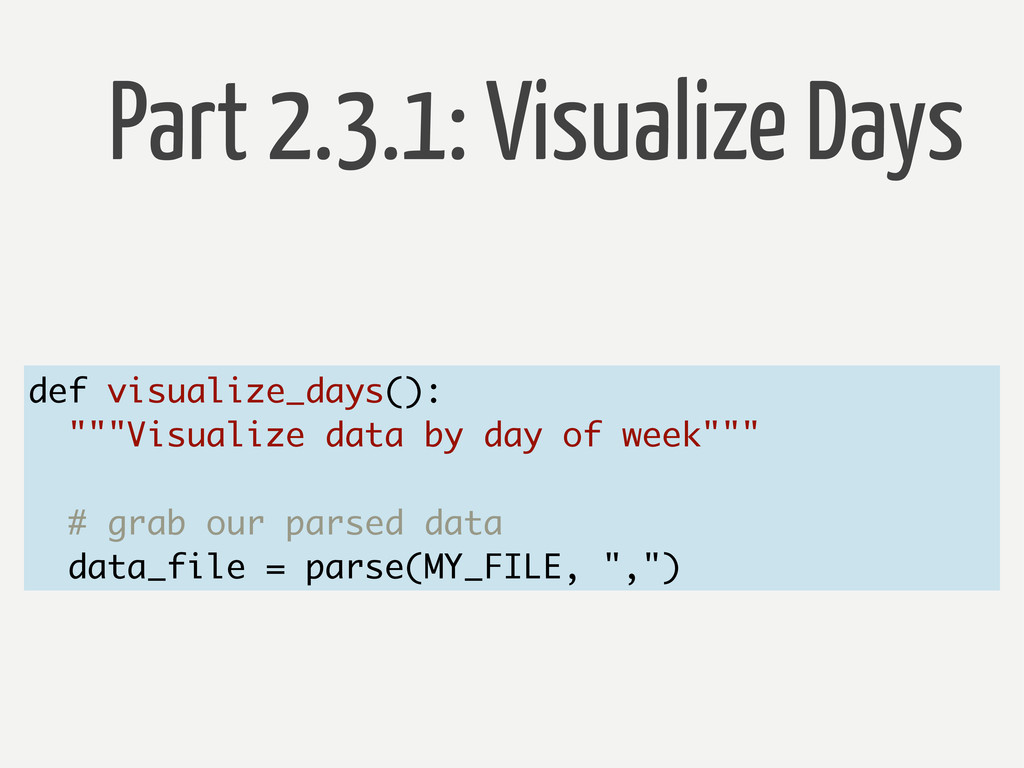
Part 2.3.1: Visualize Days def visualize_days(): """Visualize data by day
of week""" # grab our parsed data data_file = parse(MY_FILE, ",")
Part 2.3.1: Visualize Days def visualize_days(): ... # create counter
counter = Counter(item["DayOfWeek"] for item in data_file) ...
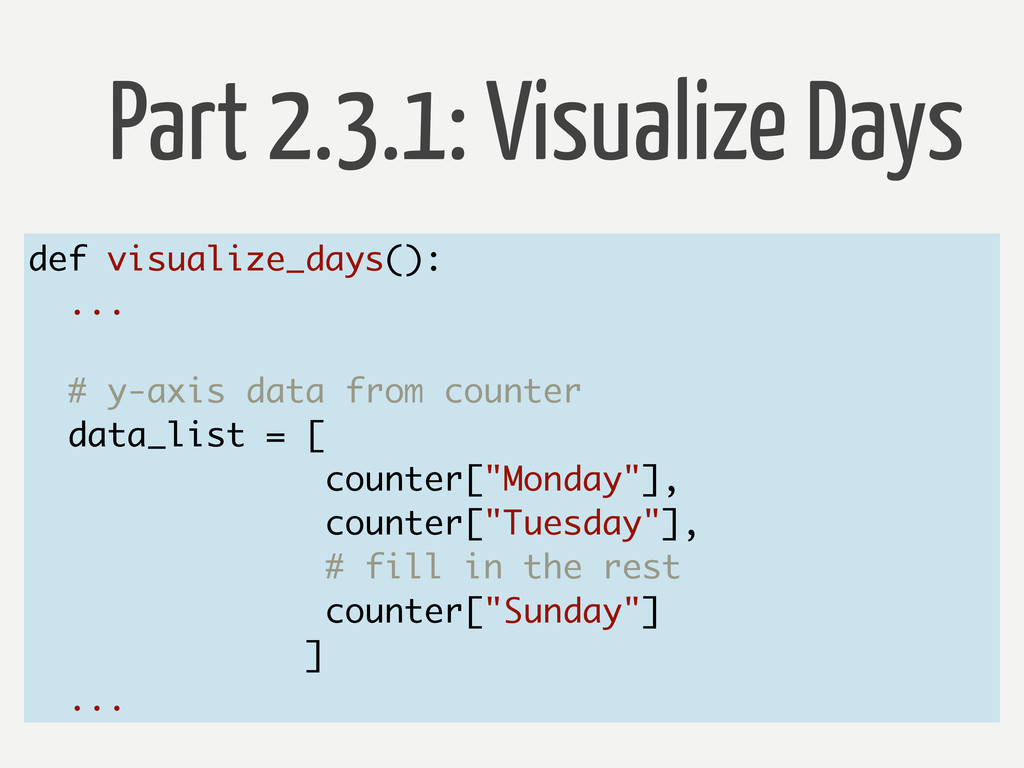
Part 2.3.1: Visualize Days def visualize_days(): ... # y-axis data
from counter data_list = [ counter["Monday"], counter["Tuesday"], # fill in the rest counter["Sunday"] ] ...
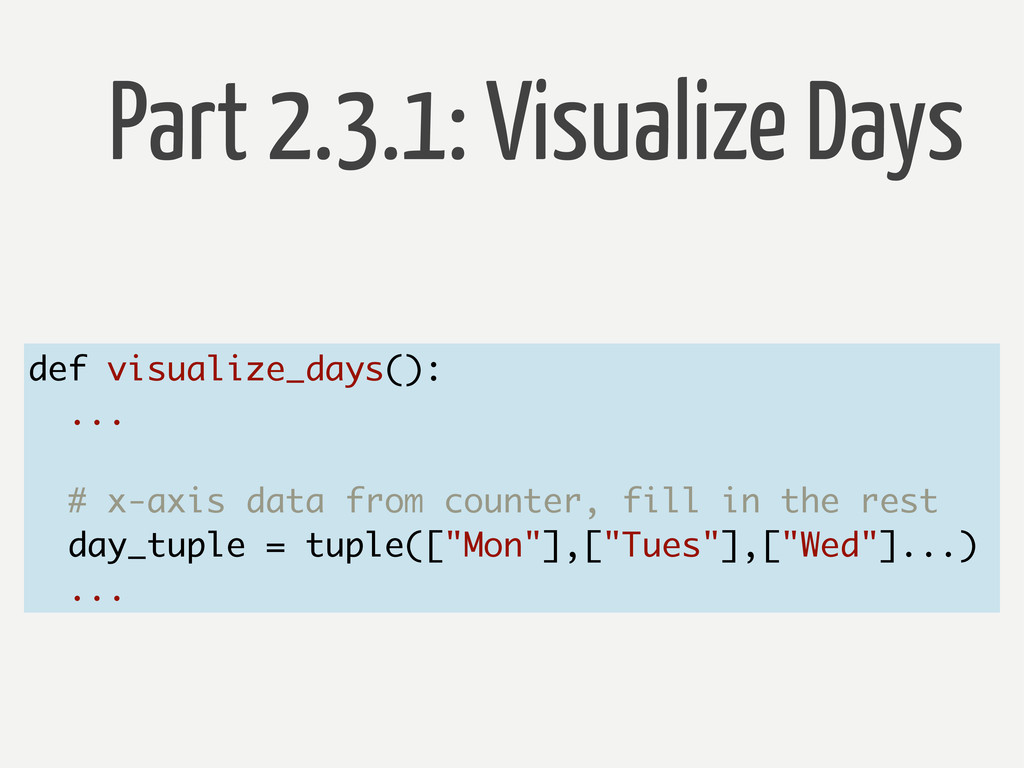
Part 2.3.1: Visualize Days def visualize_days(): ... # x-axis data
from counter, fill in the rest day_tuple = tuple(["Mon"],["Tues"],["Wed"]...) ...
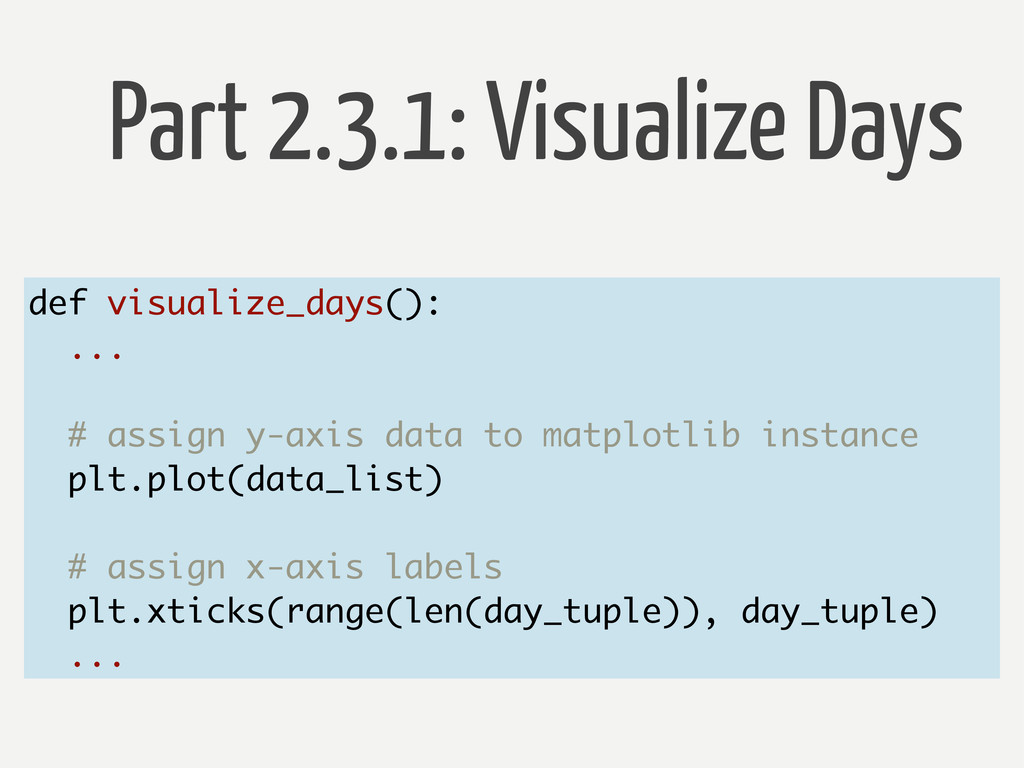
Part 2.3.1: Visualize Days def visualize_days(): ... # assign y-axis
data to matplotlib instance plt.plot(data_list) # assign x-axis labels plt.xticks(range(len(day_tuple)), day_tuple) ...
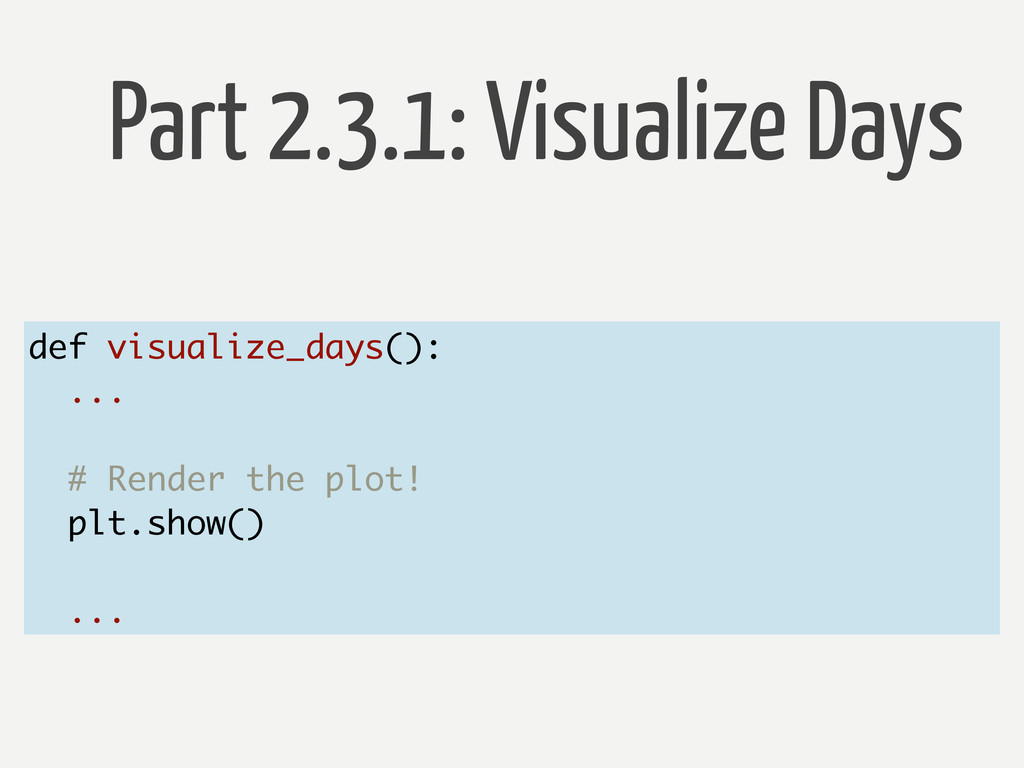
Part 2.3.1: Visualize Days def visualize_days(): ... # Render the
plot! plt.show() ...
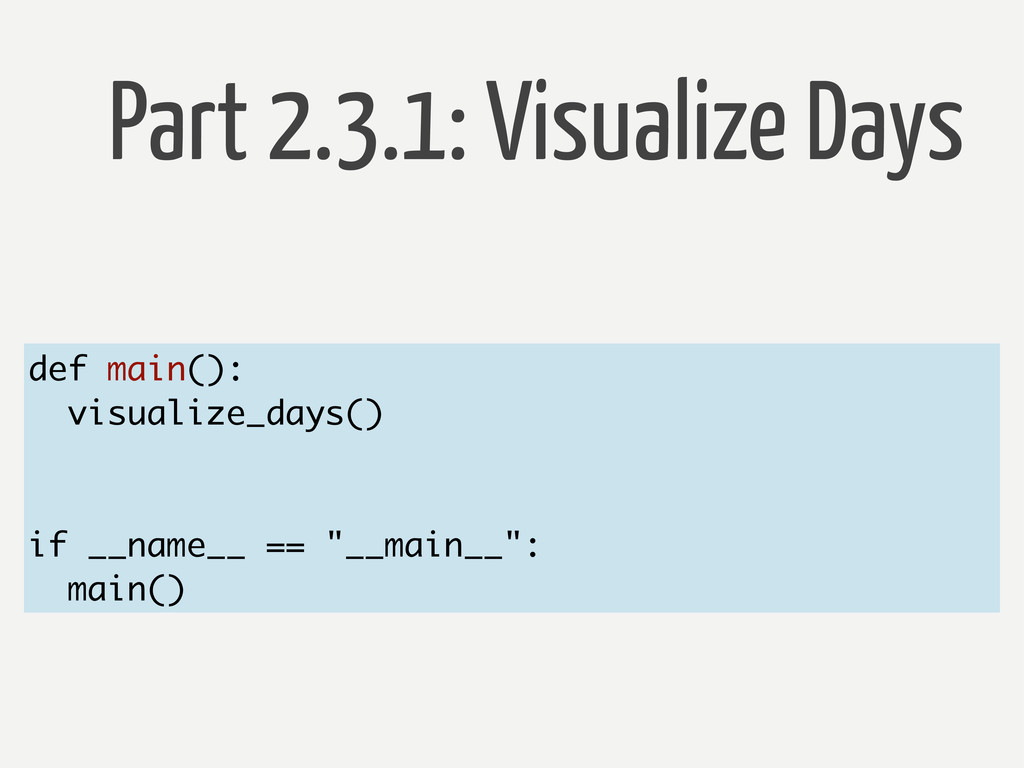
Part 2.3.1: Visualize Days def main(): visualize_days() if __name__ ==
"__main__": main()
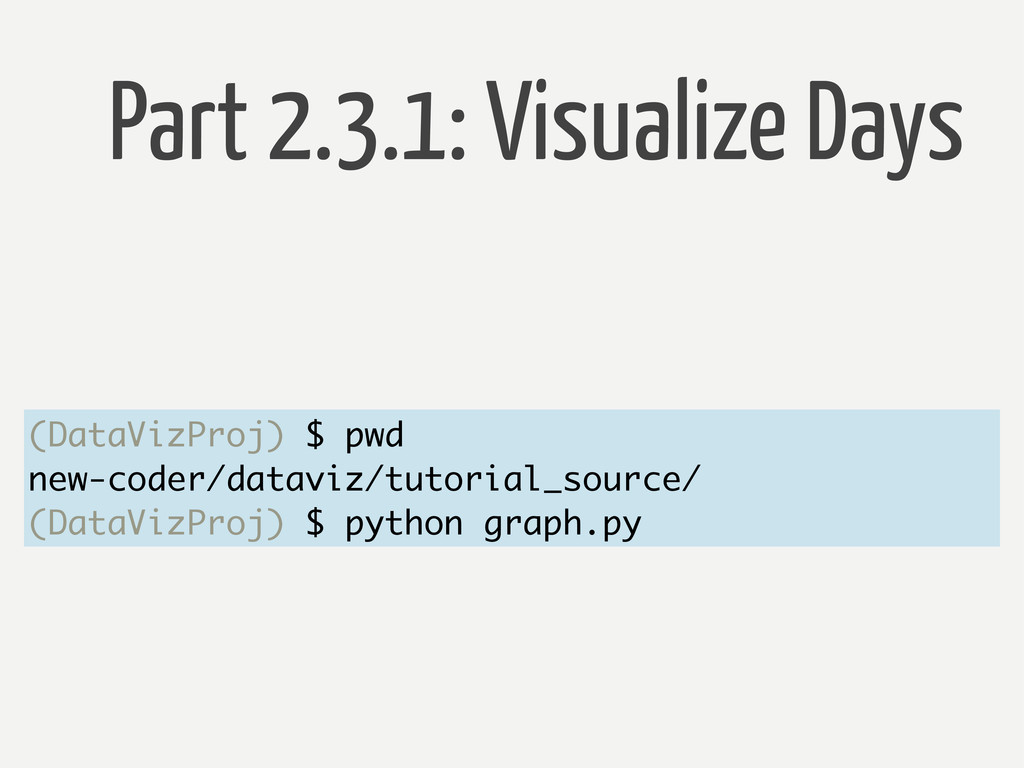
Part 2.3.1: Visualize Days (DataVizProj) $ pwd new-coder/dataviz/tutorial_source/ (DataVizProj) $
python graph.py
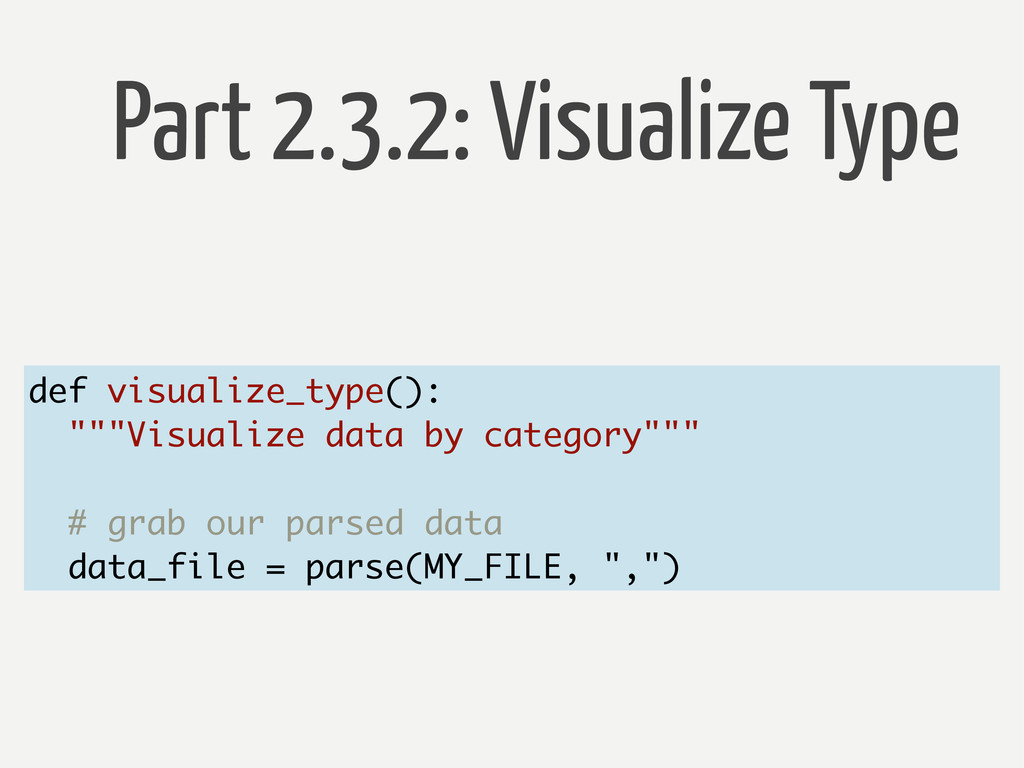
Part 2.3.2: Visualize Type def visualize_type(): """Visualize data by category"""
# grab our parsed data data_file = parse(MY_FILE, ",")
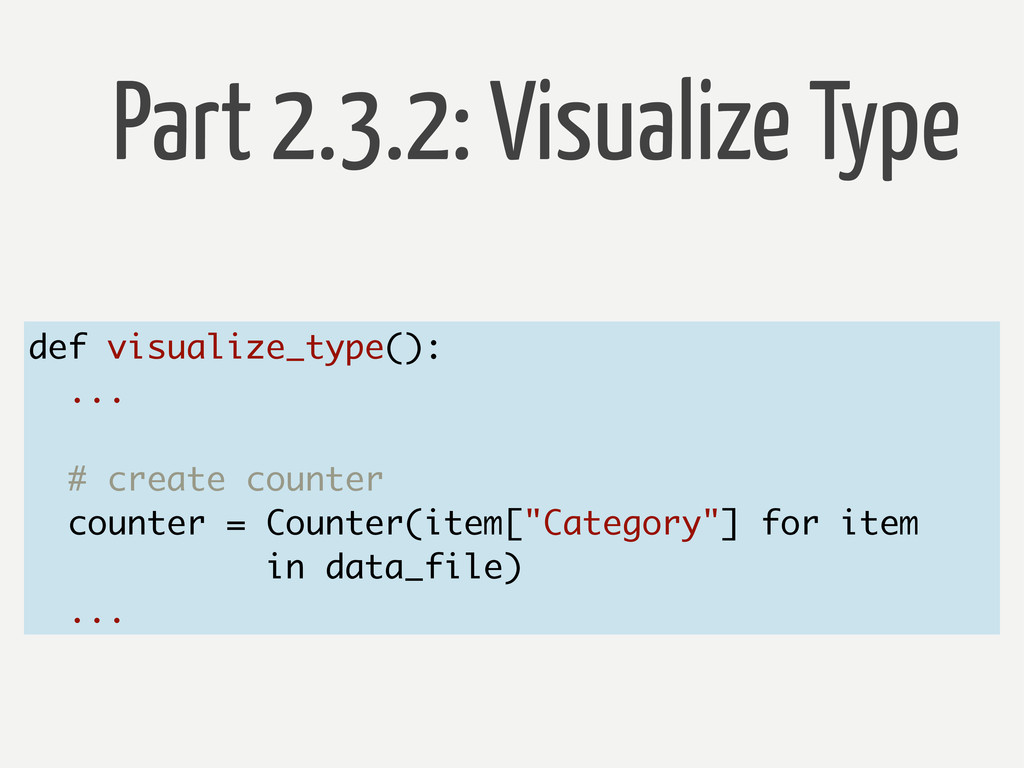
Part 2.3.2: Visualize Type def visualize_type(): ... # create counter
counter = Counter(item["Category"] for item in data_file) ...
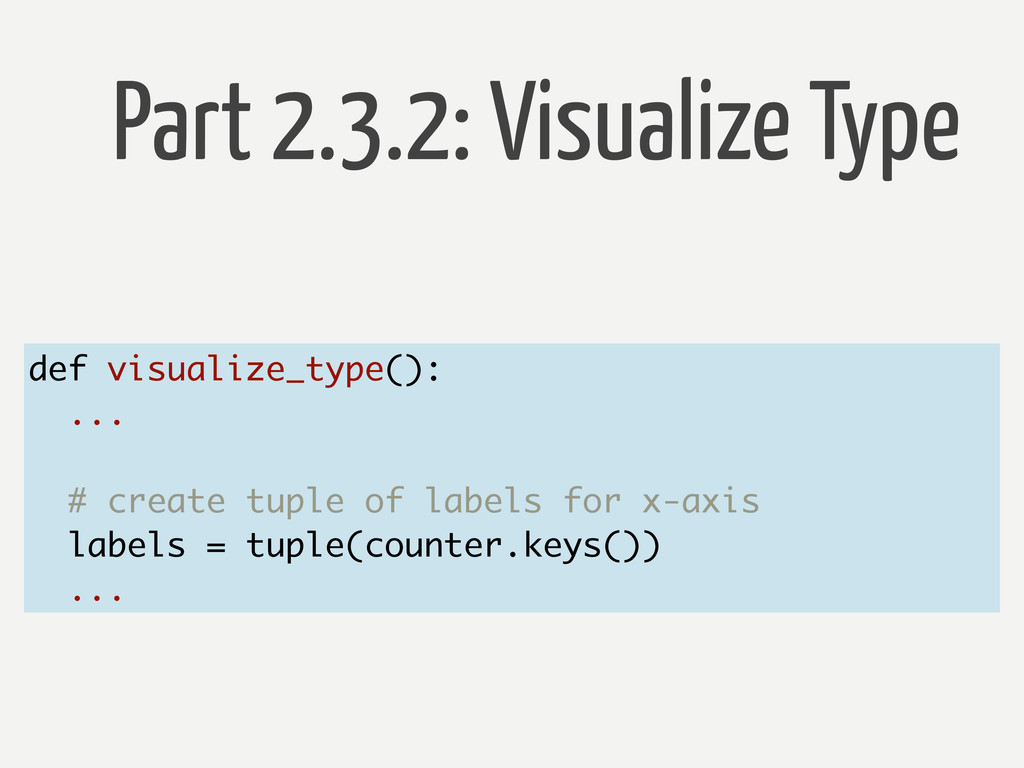
Part 2.3.2: Visualize Type def visualize_type(): ... # create tuple
of labels for x-axis labels = tuple(counter.keys()) ...
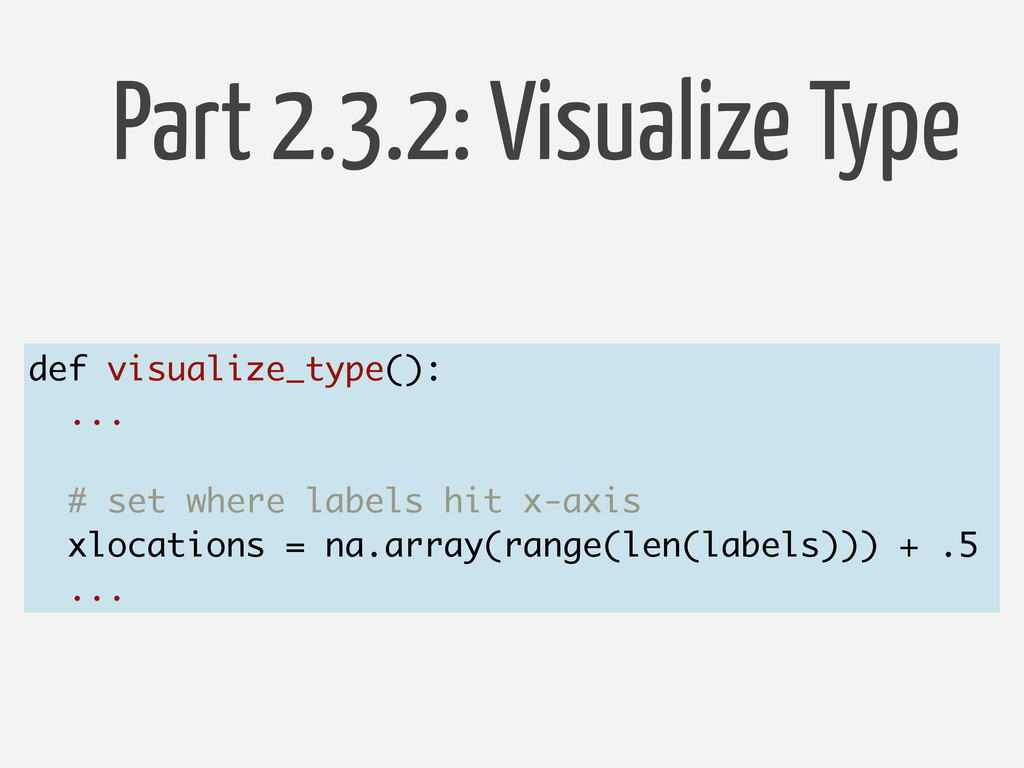
Part 2.3.2: Visualize Type def visualize_type(): ... # set where
labels hit x-axis xlocations = na.array(range(len(labels))) + .5 ...
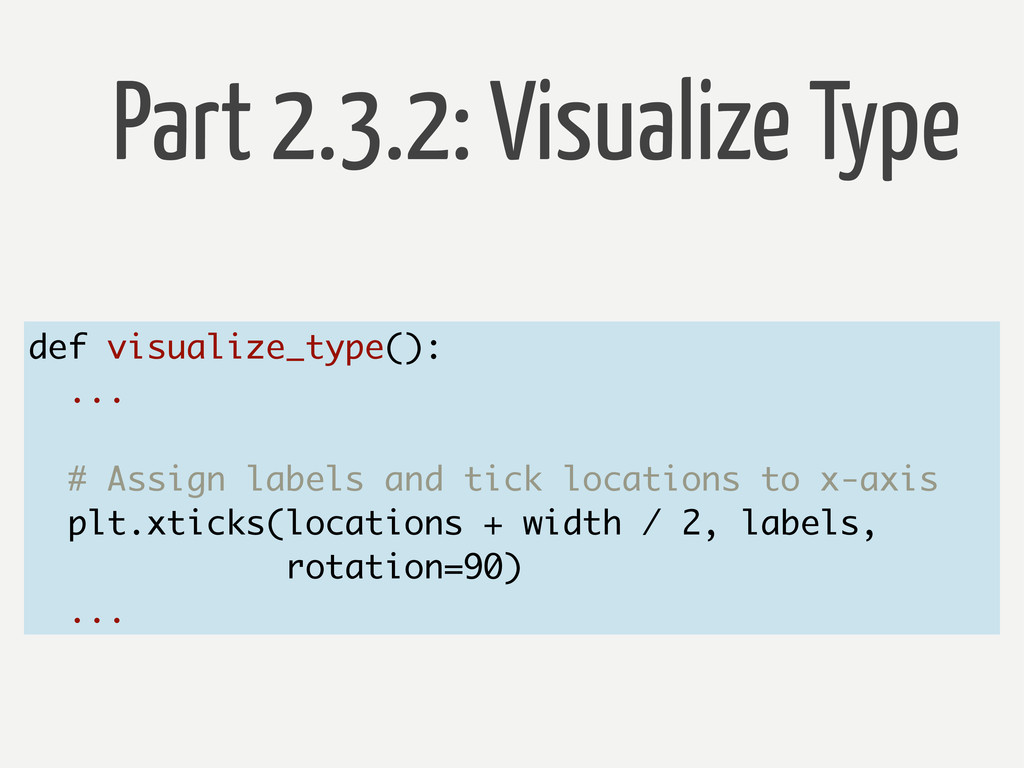
Part 2.3.2: Visualize Type def visualize_type(): ... # Assign labels
and tick locations to x-axis plt.xticks(locations + width / 2, labels, rotation=90) ...
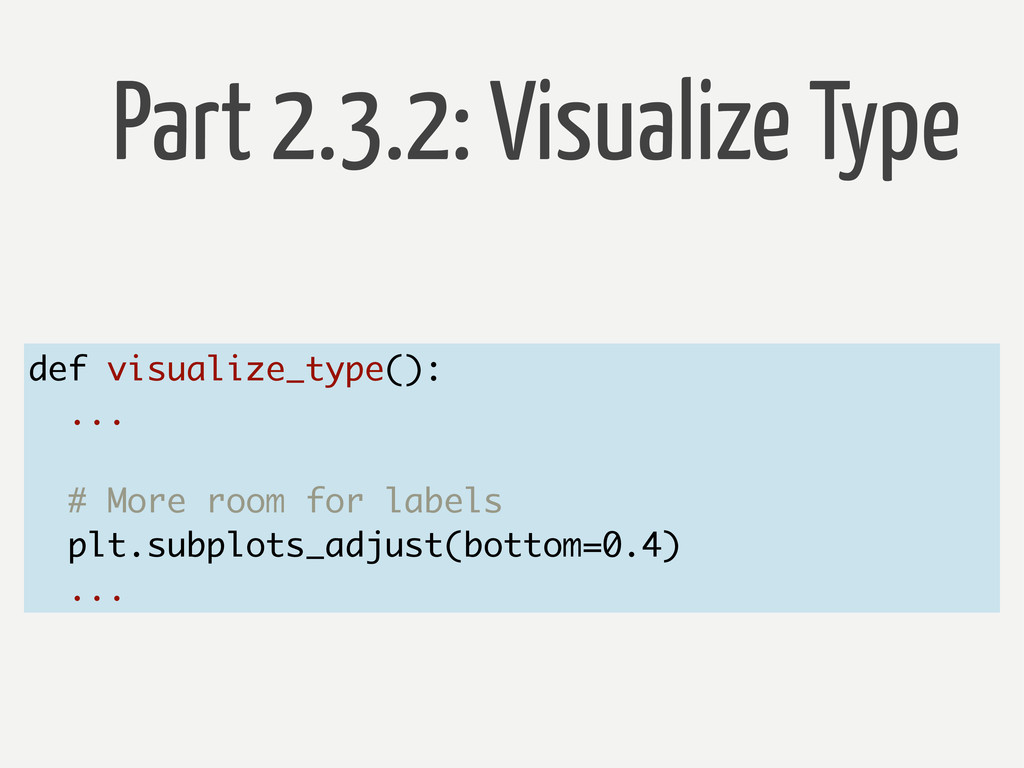
Part 2.3.2: Visualize Type def visualize_type(): ... # More room
for labels plt.subplots_adjust(bottom=0.4) ...
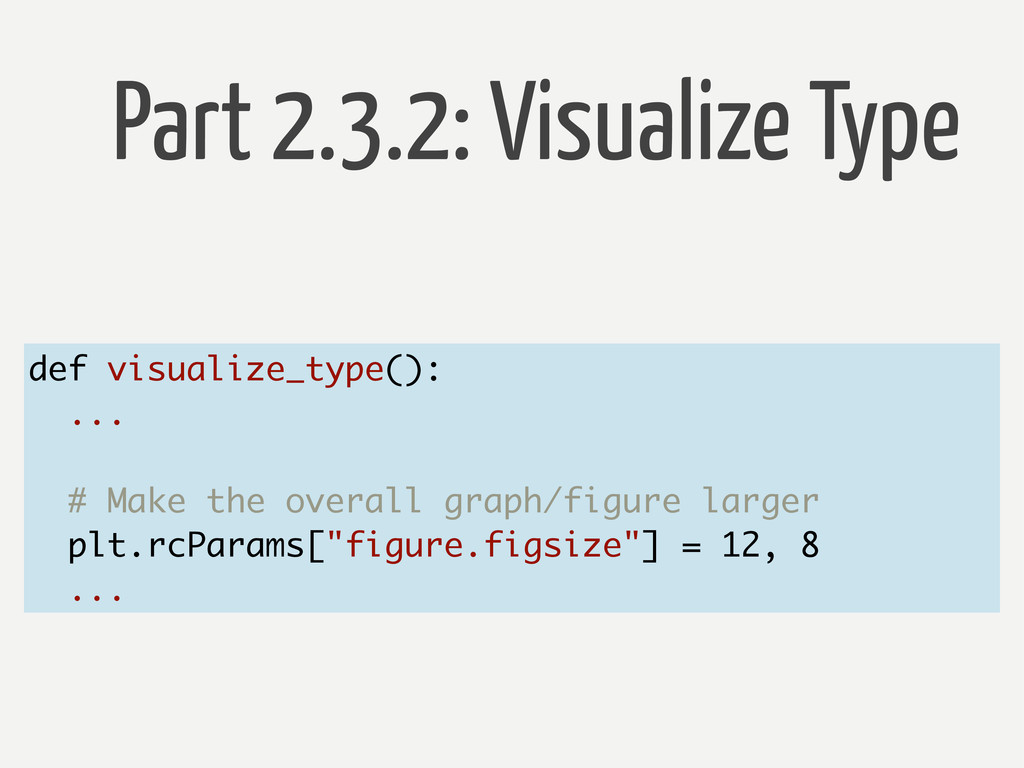
Part 2.3.2: Visualize Type def visualize_type(): ... # Make the
overall graph/figure larger plt.rcParams["figure.figsize"] = 12, 8 ...
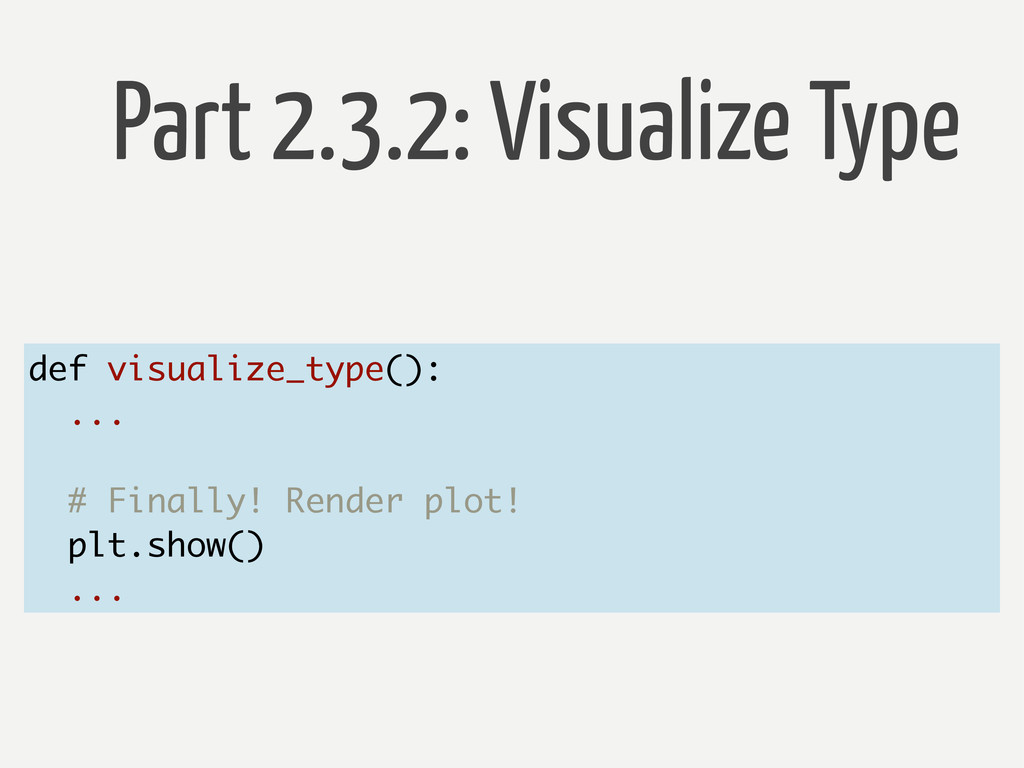
Part 2.3.2: Visualize Type def visualize_type(): ... # Finally! Render
plot! plt.show() ...
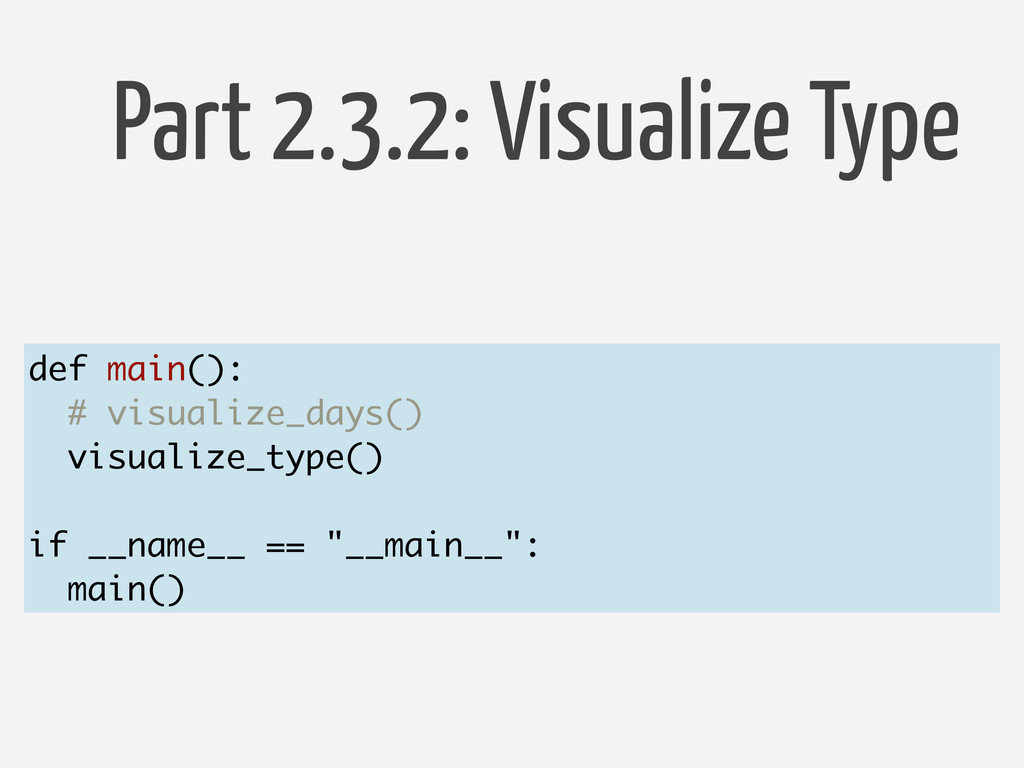
Part 2.3.2: Visualize Type def visualize_type(): ... # Finally! Render
plot! plt.show() ... def main(): # visualize_days() visualize_type() if __name__ == "__main__": main()
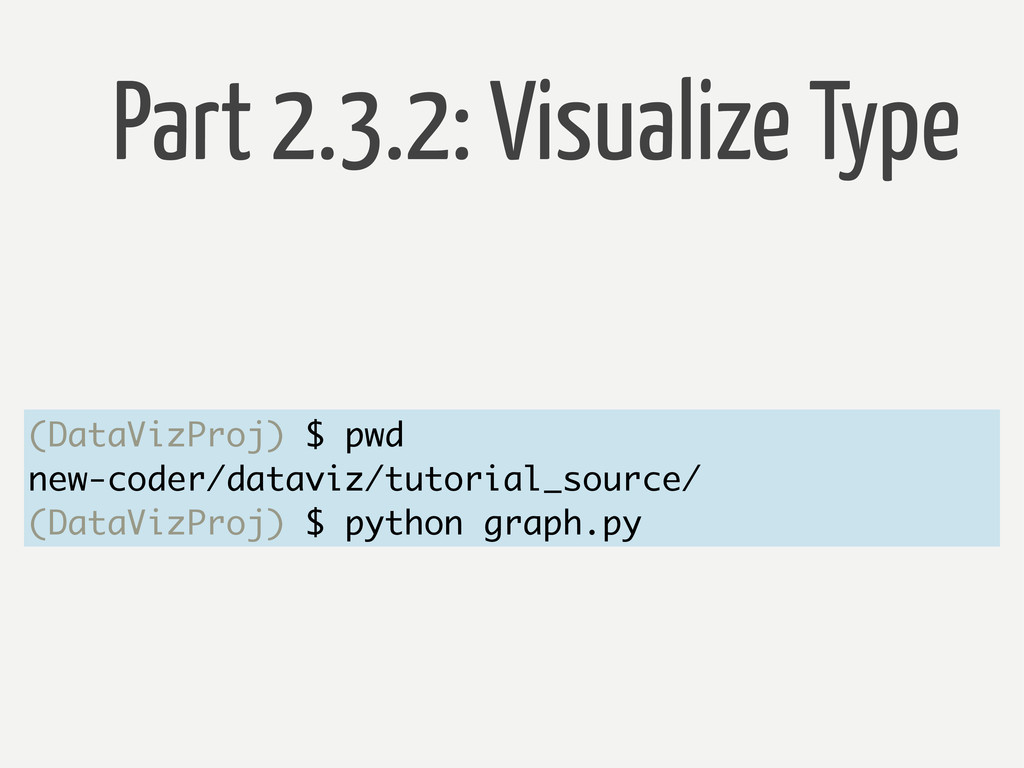
Part 2.3.2: Visualize Type (DataVizProj) $ pwd new-coder/dataviz/tutorial_source/ (DataVizProj) $
python graph.py
Break time
Part 3: map.py Plotting our sample data on Google Maps
Part 3: map.py 1. Module Setup 2. Helper Functions 3.
Create G-Map
Part 3.1: Module Setup MOAR import statements
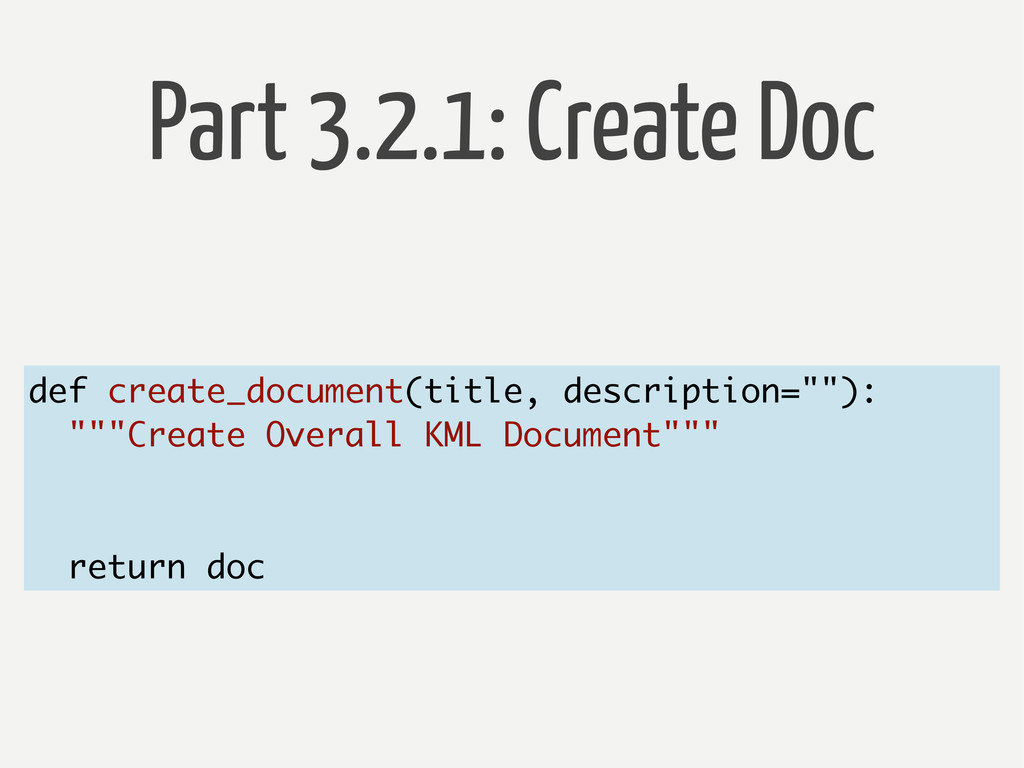
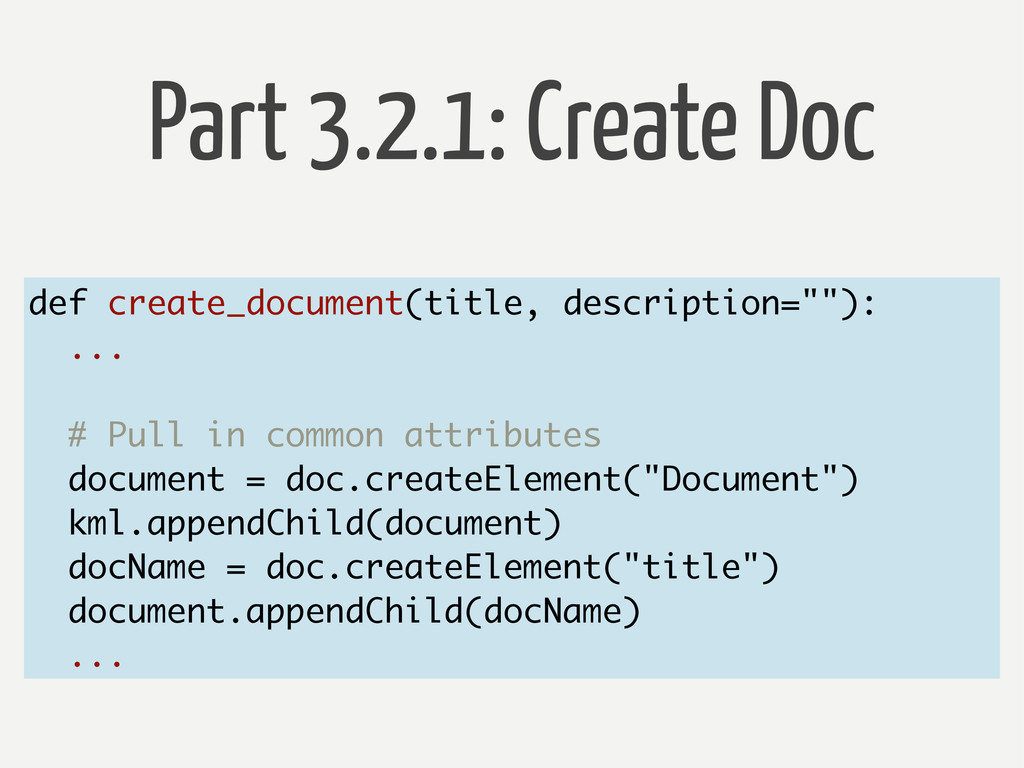
Part 3.2.1: Create Doc def create_document(title, description=""): """Create Overall KML
Document""" return doc
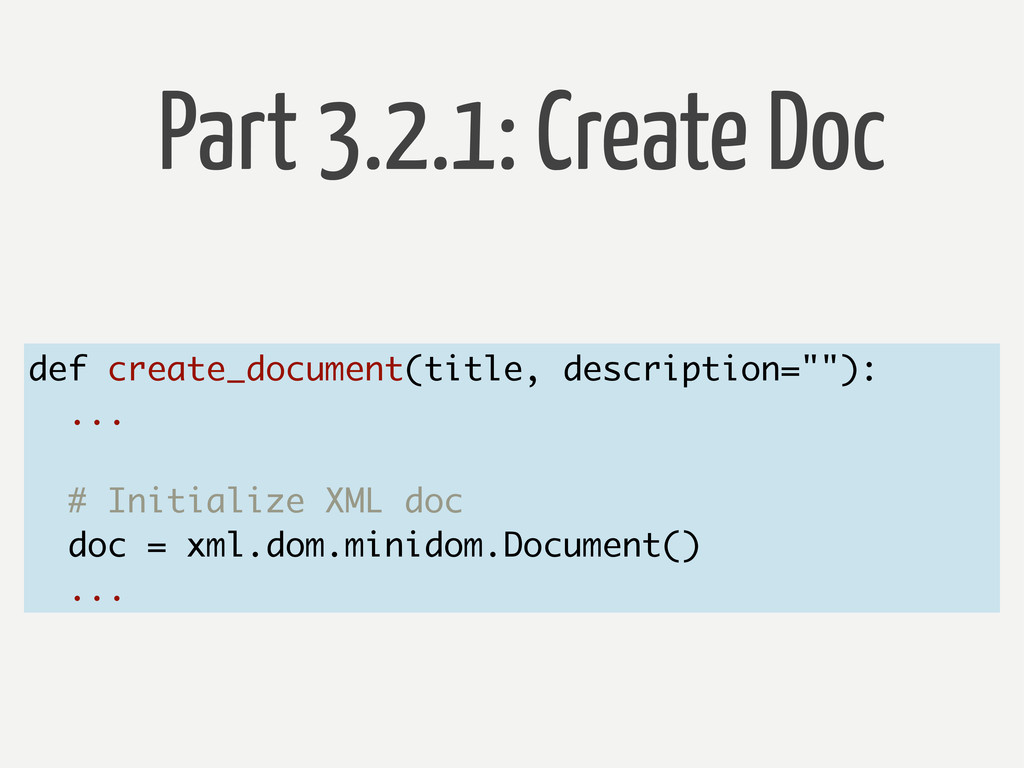
def create_document(title, description=""): ... # Initialize XML doc doc =
xml.dom.minidom.Document() ... Part 3.2.1: Create Doc
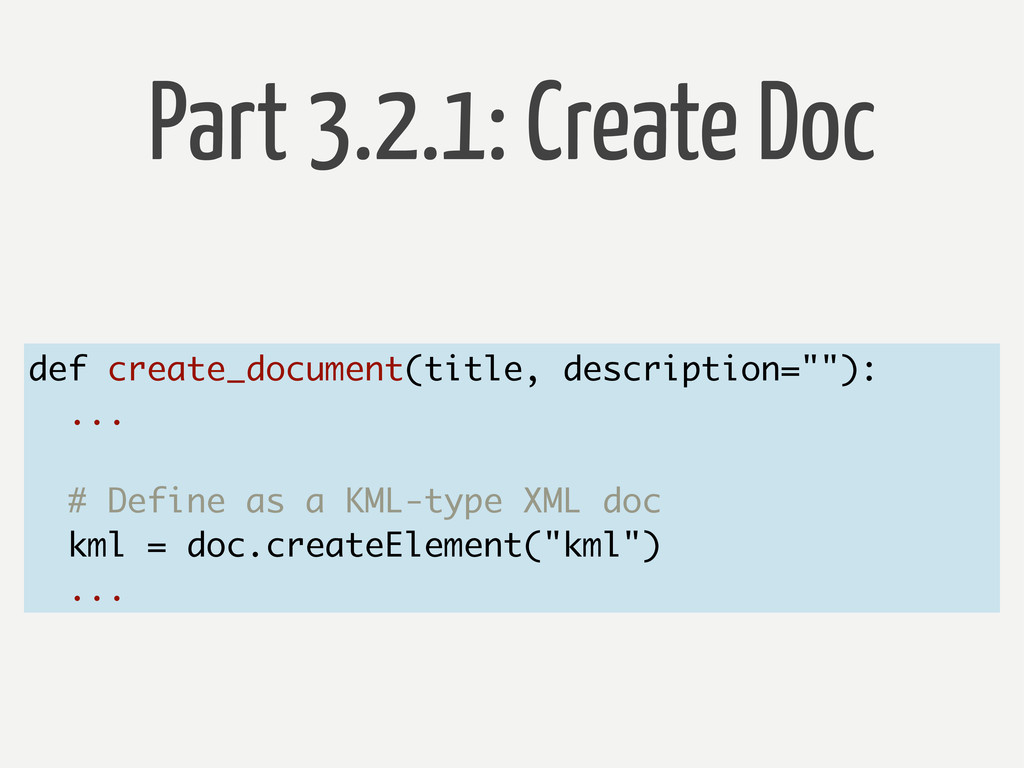
def create_document(title, description=""): ... # Define as a KML-type XML
doc kml = doc.createElement("kml") ... Part 3.2.1: Create Doc
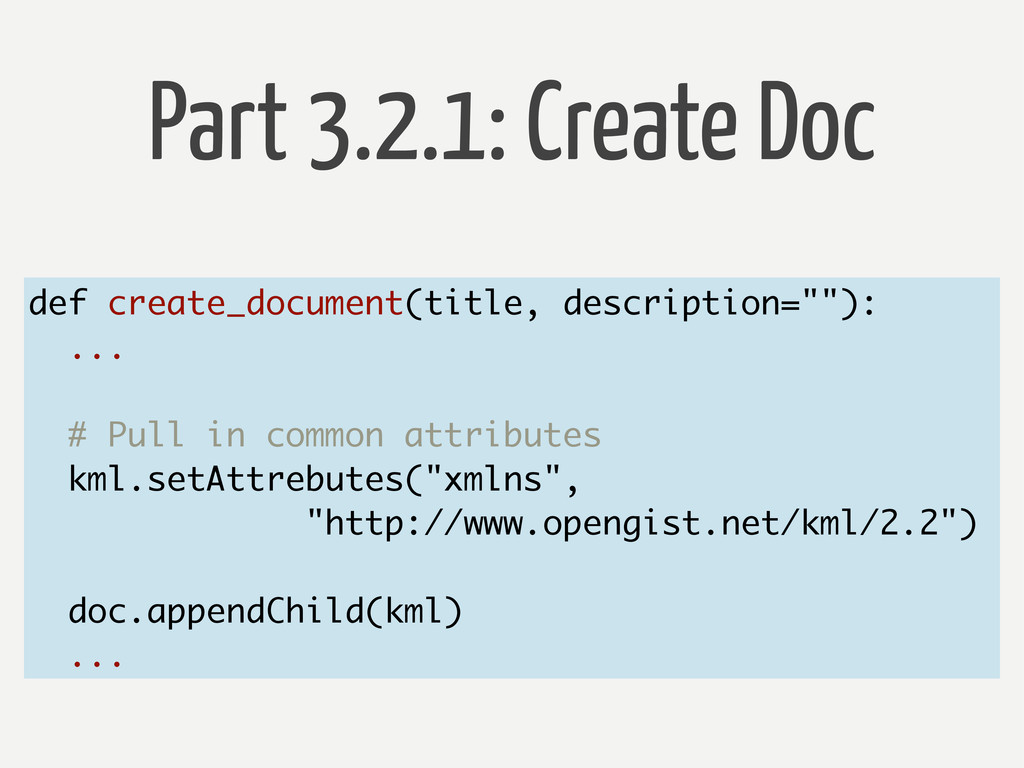
def create_document(title, description=""): ... # Pull in common attributes kml.setAttrebutes("xmlns",
"http://www.opengist.net/kml/2.2") doc.appendChild(kml) ... Part 3.2.1: Create Doc
def create_document(title, description=""): ... # Pull in common attributes document
= doc.createElement("Document") kml.appendChild(document) docName = doc.createElement("title") document.appendChild(docName) ... Part 3.2.1: Create Doc
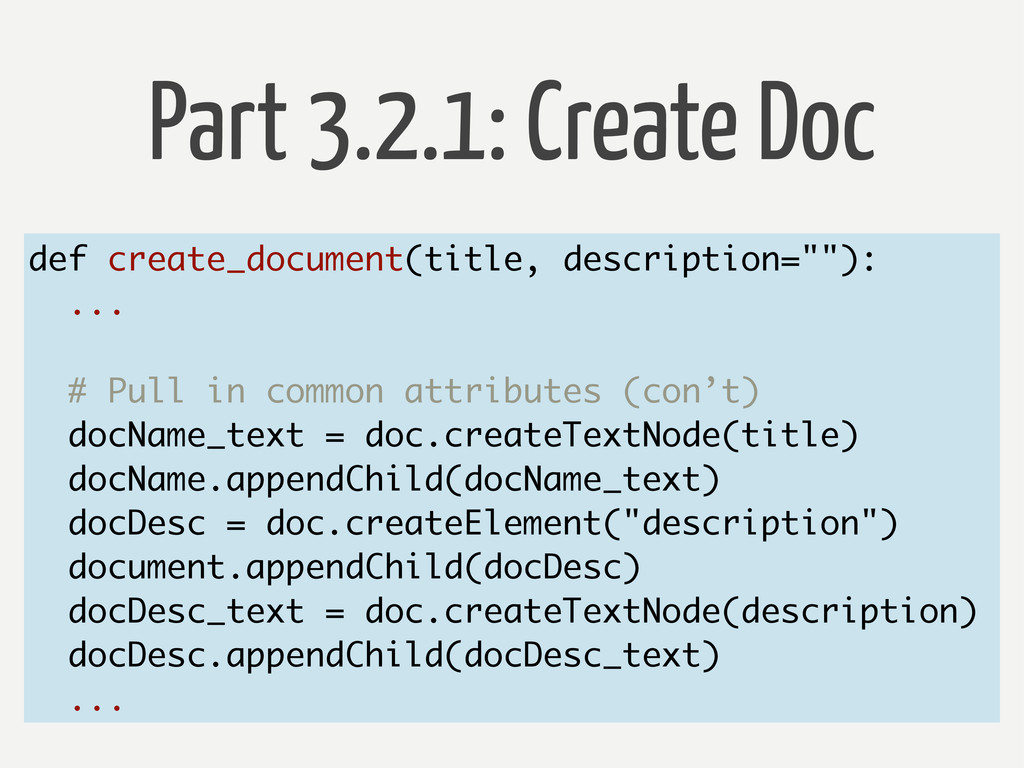
def create_document(title, description=""): ... # Pull in common attributes (con’t)
docName_text = doc.createTextNode(title) docName.appendChild(docName_text) docDesc = doc.createElement("description") document.appendChild(docDesc) docDesc_text = doc.createTextNode(description) docDesc.appendChild(docDesc_text) ... Part 3.2.1: Create Doc
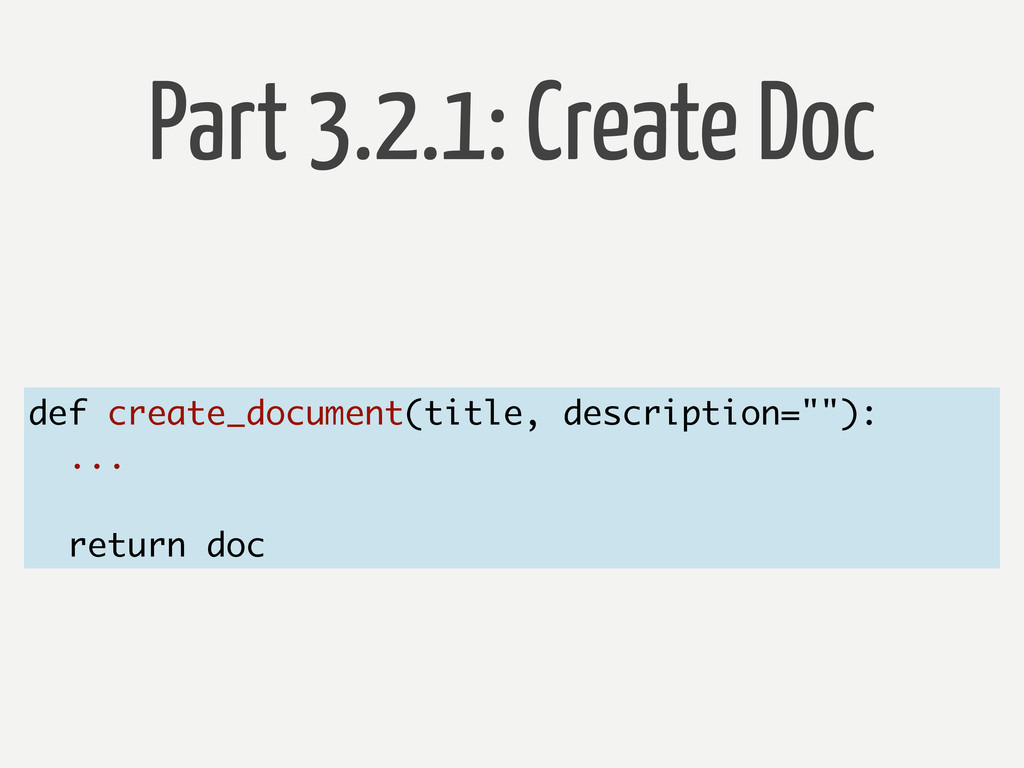
def create_document(title, description=""): ... return doc Part 3.2.1: Create Doc
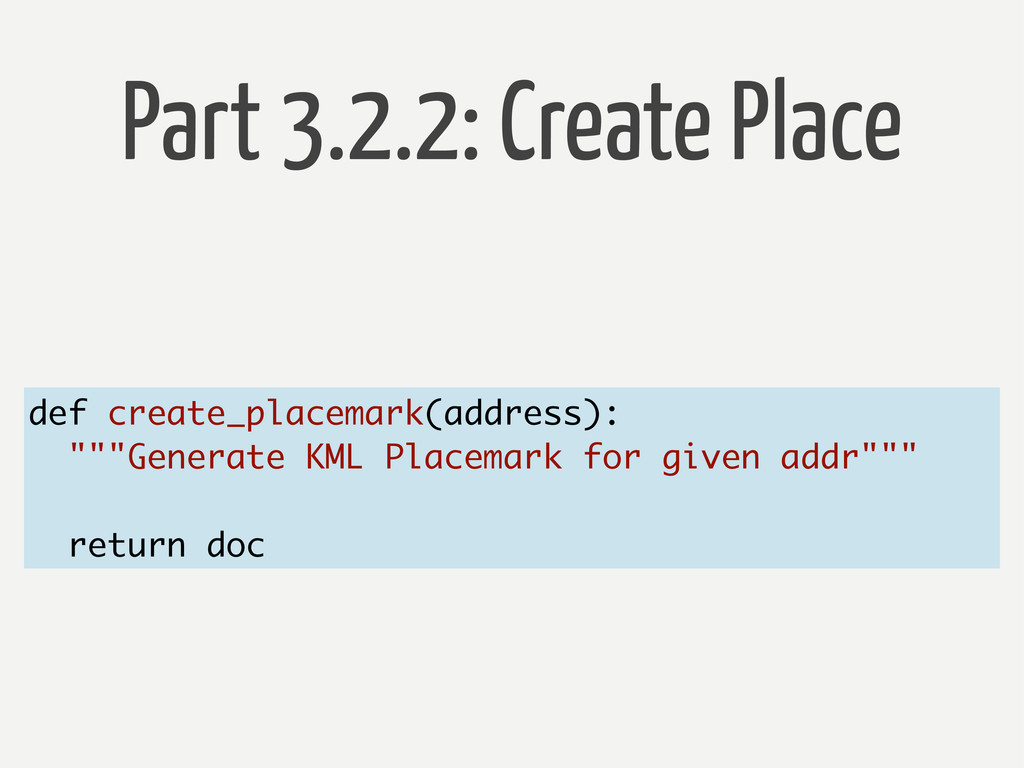
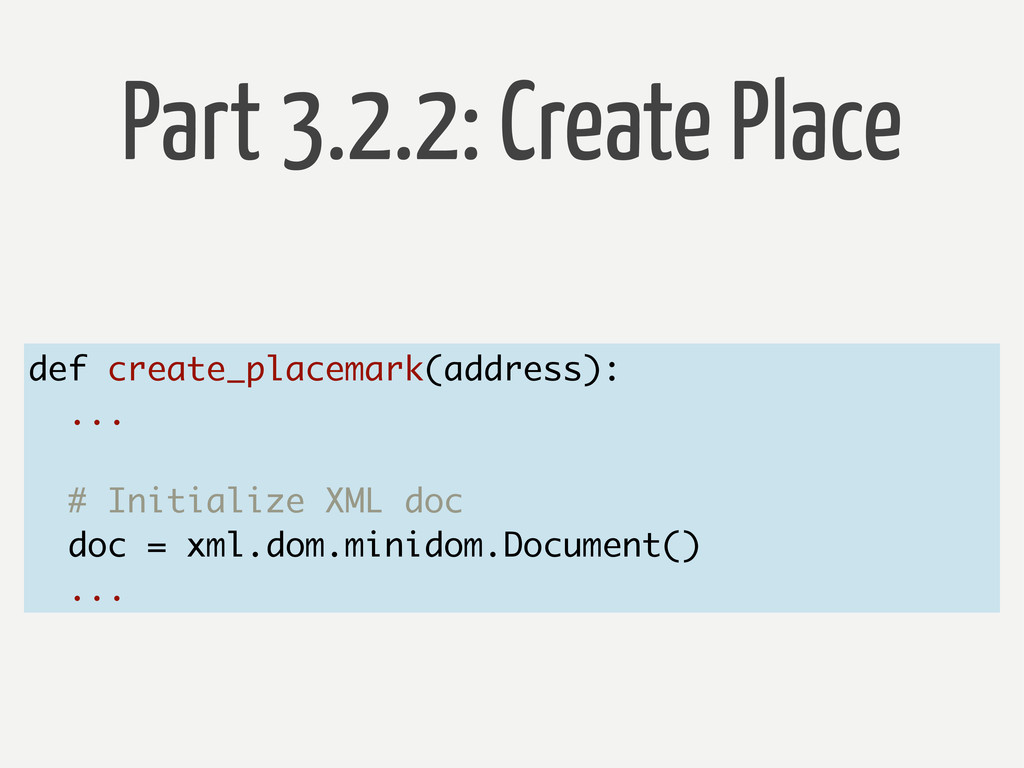
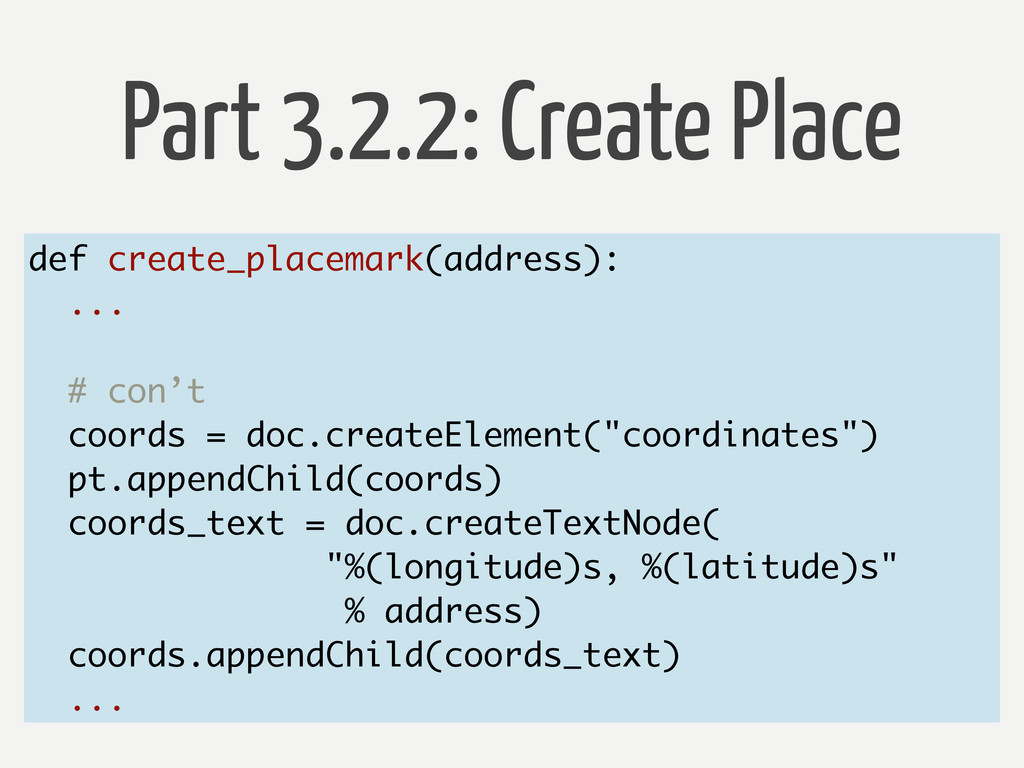
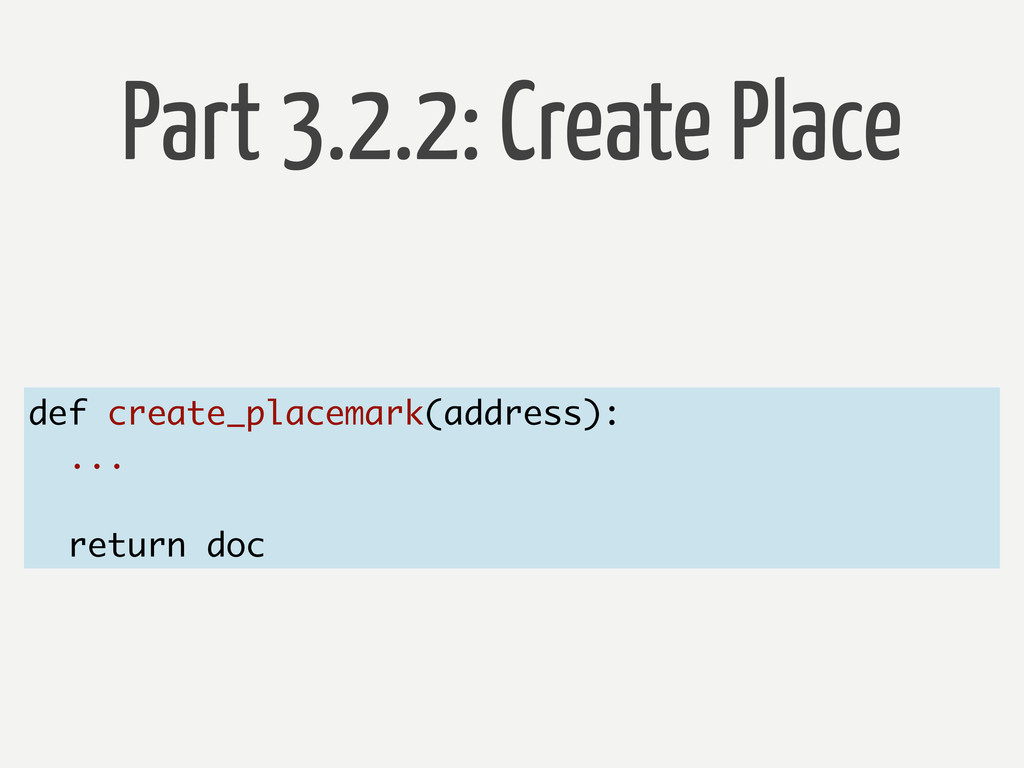
Part 3.2.2: Create Place def create_placemark(address): """Generate KML Placemark for
given addr""" return doc
def create_placemark(address): ... # Initialize XML doc doc = xml.dom.minidom.Document()
... Part 3.2.2: Create Place
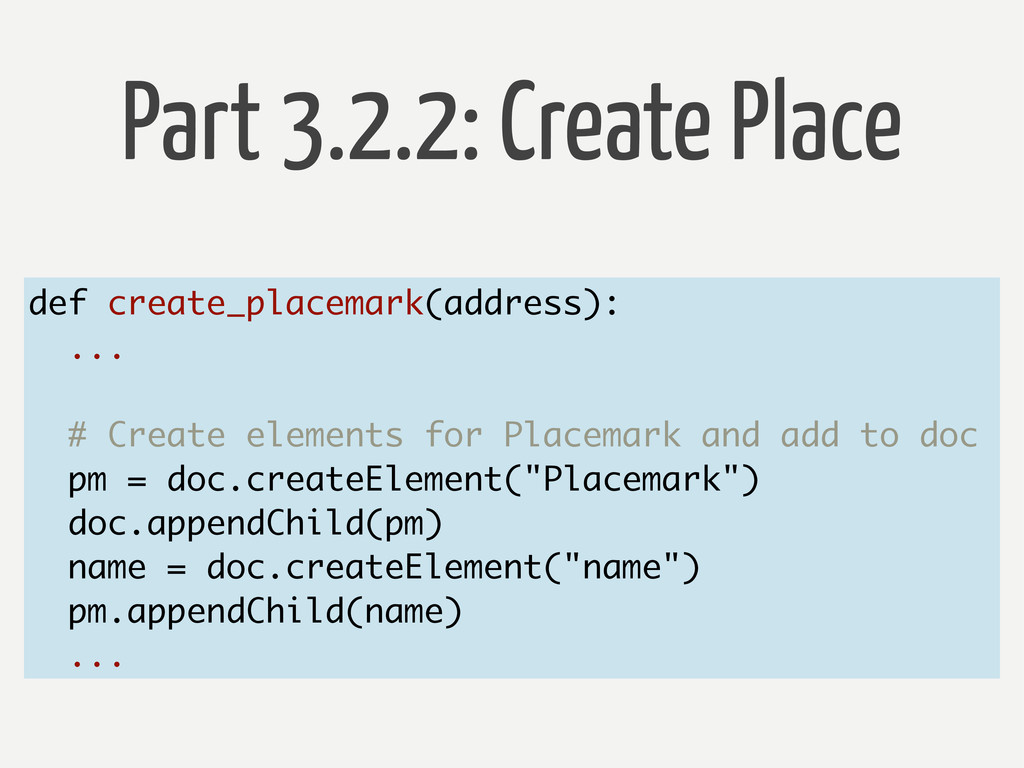
def create_placemark(address): ... # Create elements for Placemark and add
to doc pm = doc.createElement("Placemark") doc.appendChild(pm) name = doc.createElement("name") pm.appendChild(name) ... Part 3.2.2: Create Place
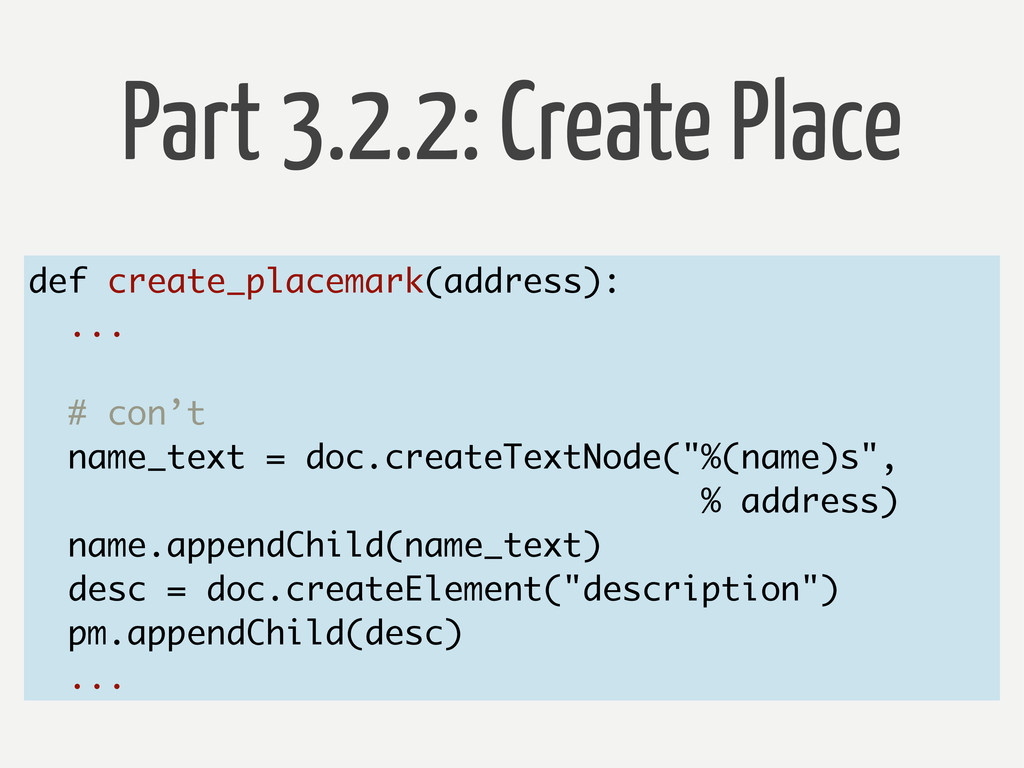
def create_placemark(address): ... # con’t name_text = doc.createTextNode("%(name)s", % address)
name.appendChild(name_text) desc = doc.createElement("description") pm.appendChild(desc) ... Part 3.2.2: Create Place
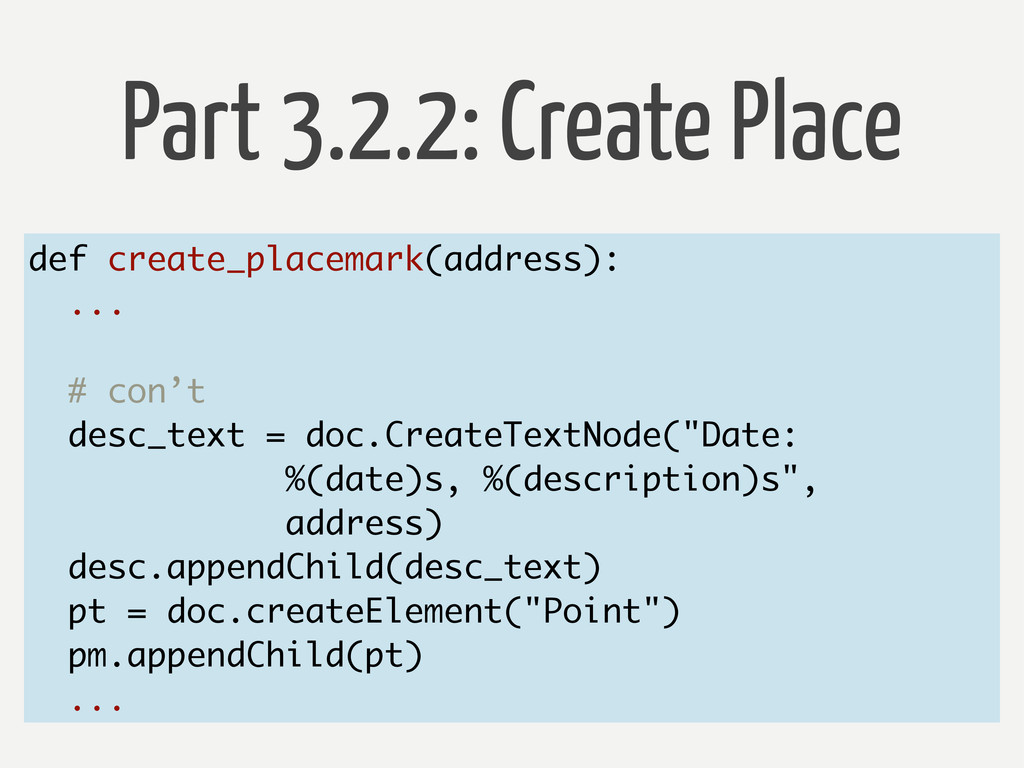
def create_placemark(address): ... # con’t desc_text = doc.CreateTextNode("Date: %(date)s, %(description)s",
address) desc.appendChild(desc_text) pt = doc.createElement("Point") pm.appendChild(pt) ... Part 3.2.2: Create Place
def create_placemark(address): ... # con’t coords = doc.createElement("coordinates") pt.appendChild(coords) coords_text
= doc.createTextNode( "%(longitude)s, %(latitude)s" % address) coords.appendChild(coords_text) ... Part 3.2.2: Create Place
def create_placemark(address): ... return doc Part 3.2.2: Create Place
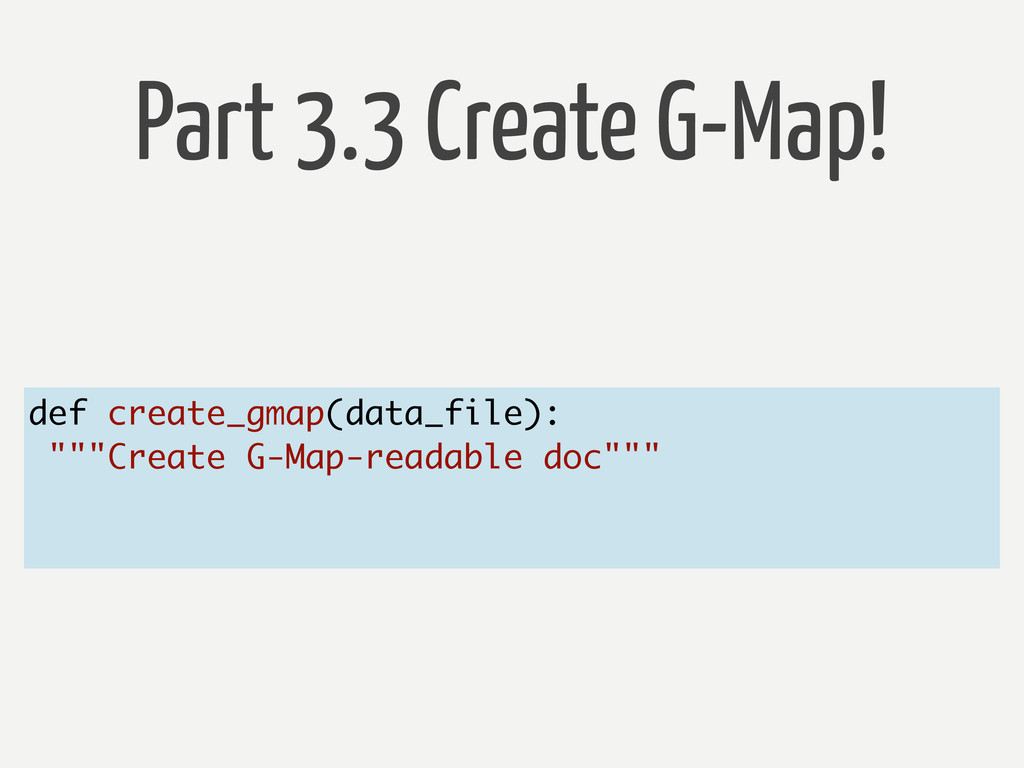
Part 3.3 Create G-Map! def create_gmap(data_file): """Create G-Map-readable doc"""
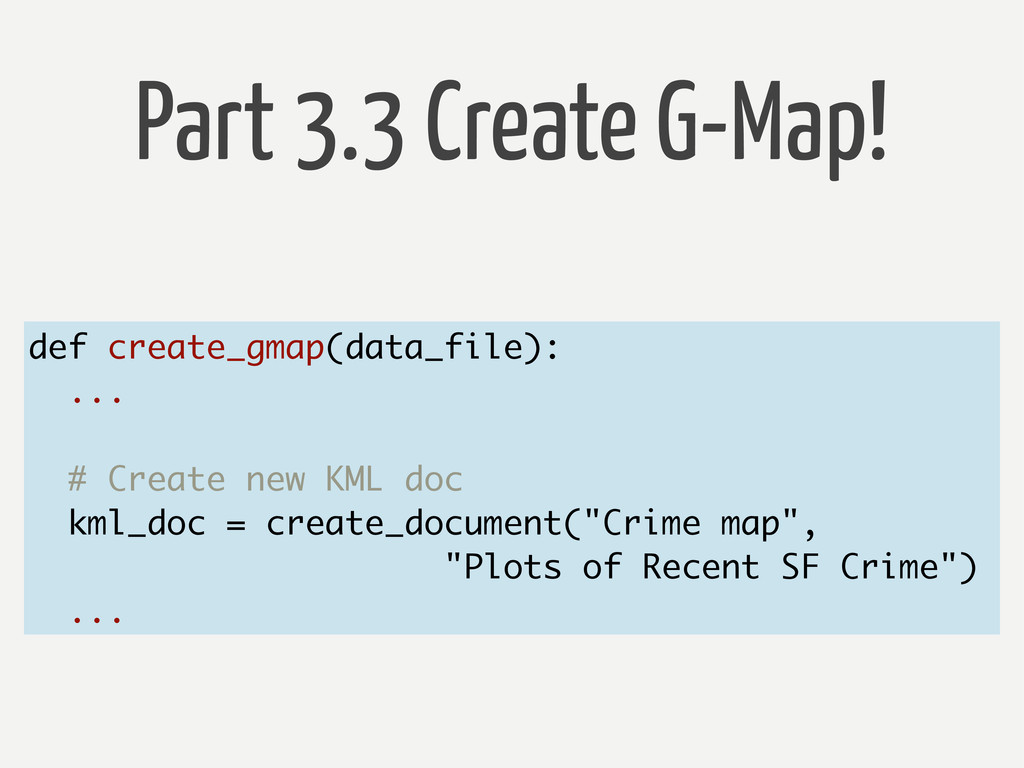
Part 3.3 Create G-Map! def create_gmap(data_file): ... # Create new
KML doc kml_doc = create_document("Crime map", "Plots of Recent SF Crime") ...
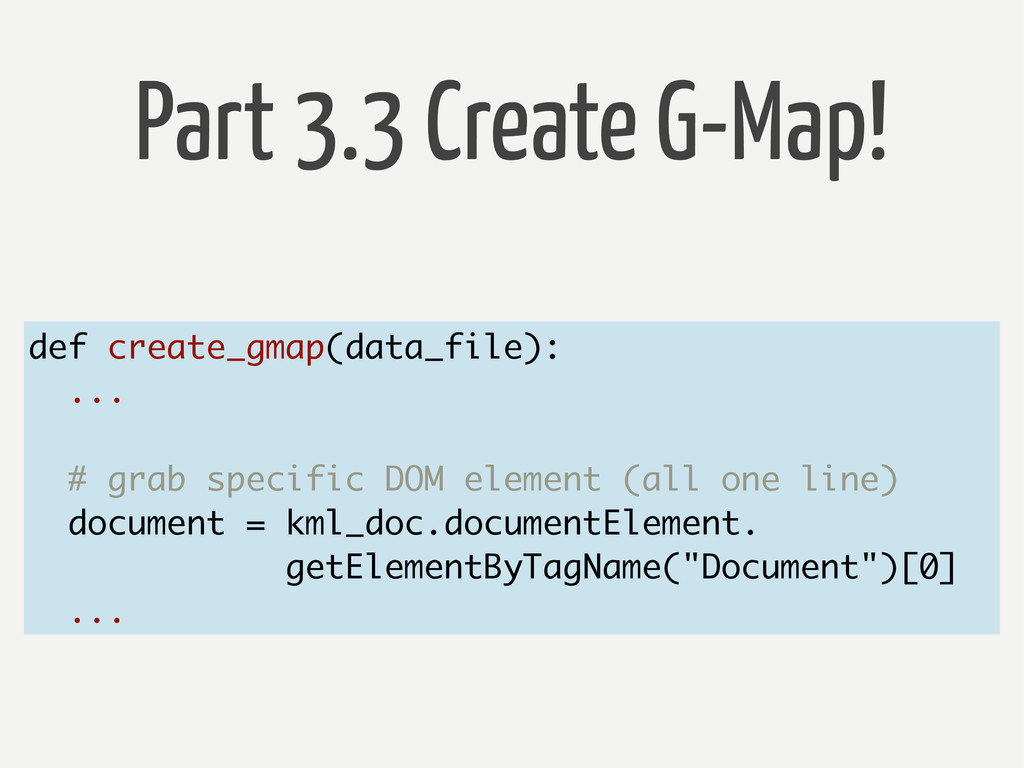
Part 3.3 Create G-Map! def create_gmap(data_file): ... # grab specific
DOM element (all one line) document = kml_doc.documentElement. getElementByTagName("Document")[0] ...
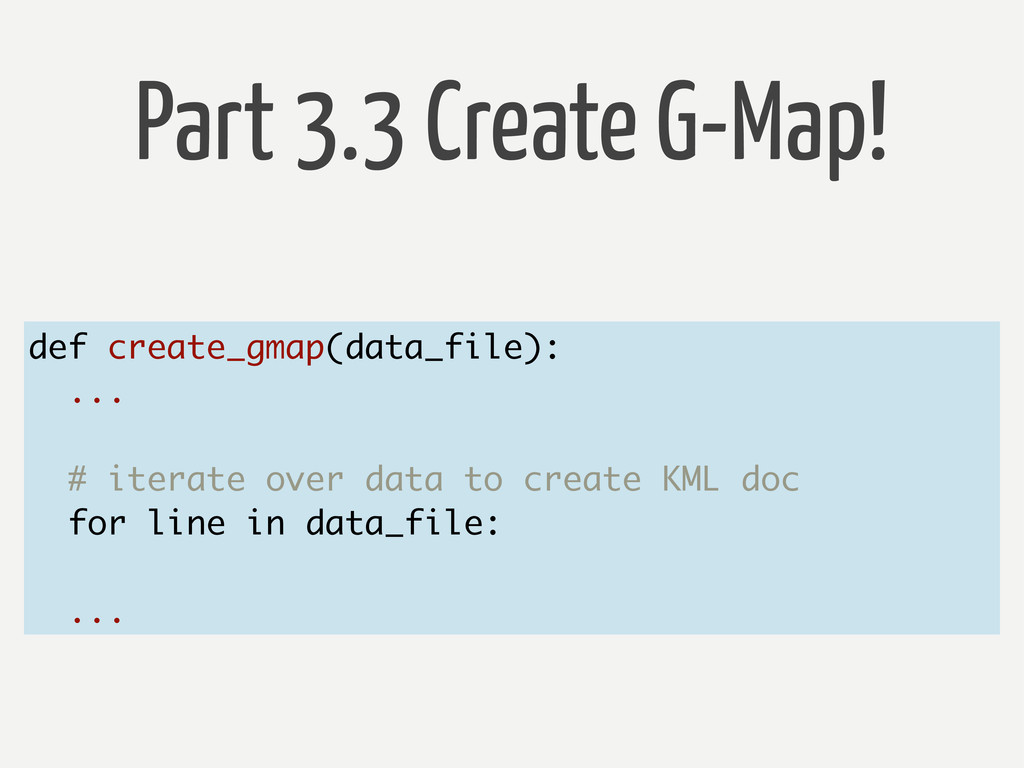
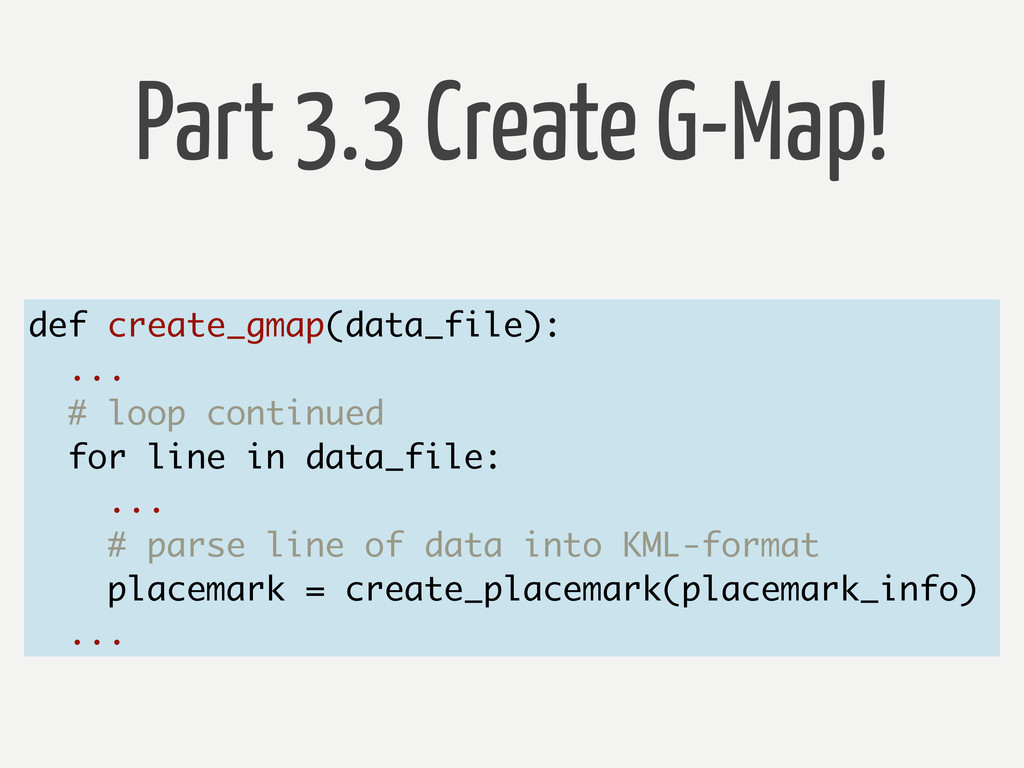
Part 3.3 Create G-Map! def create_gmap(data_file): ... # iterate over
data to create KML doc for line in data_file: ...
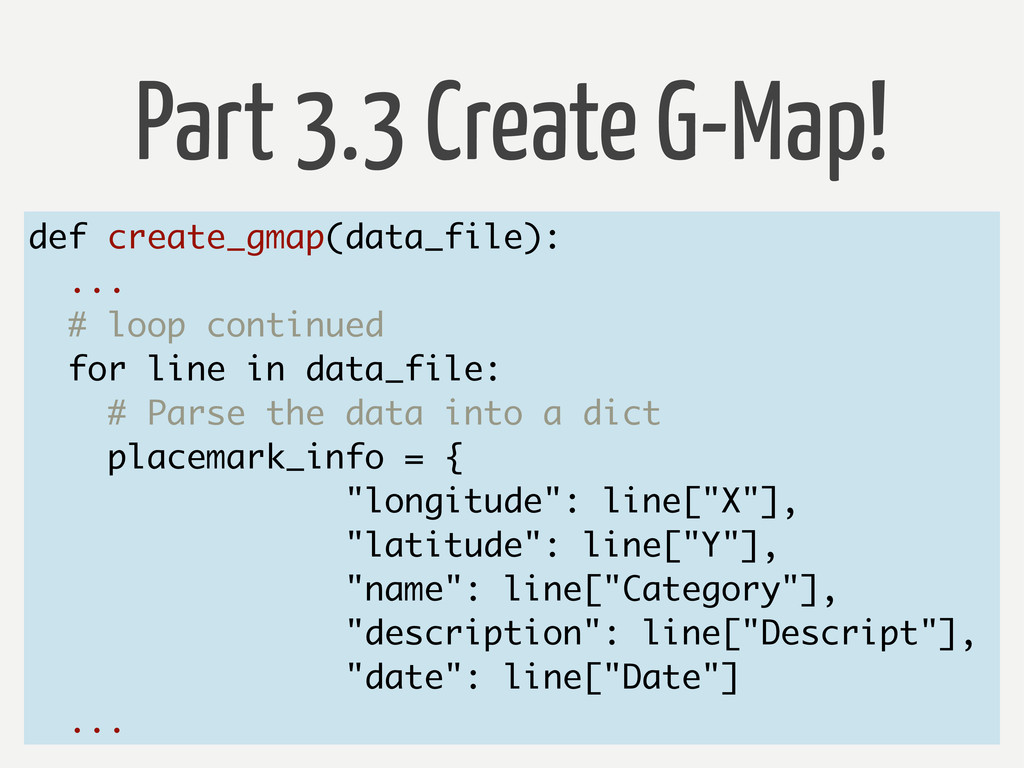
Part 3.3 Create G-Map! def create_gmap(data_file): ... # loop continued
for line in data_file: # Parse the data into a dict placemark_info = { "longitude": line["X"], "latitude": line["Y"], "name": line["Category"], "description": line["Descript"], "date": line["Date"] ...
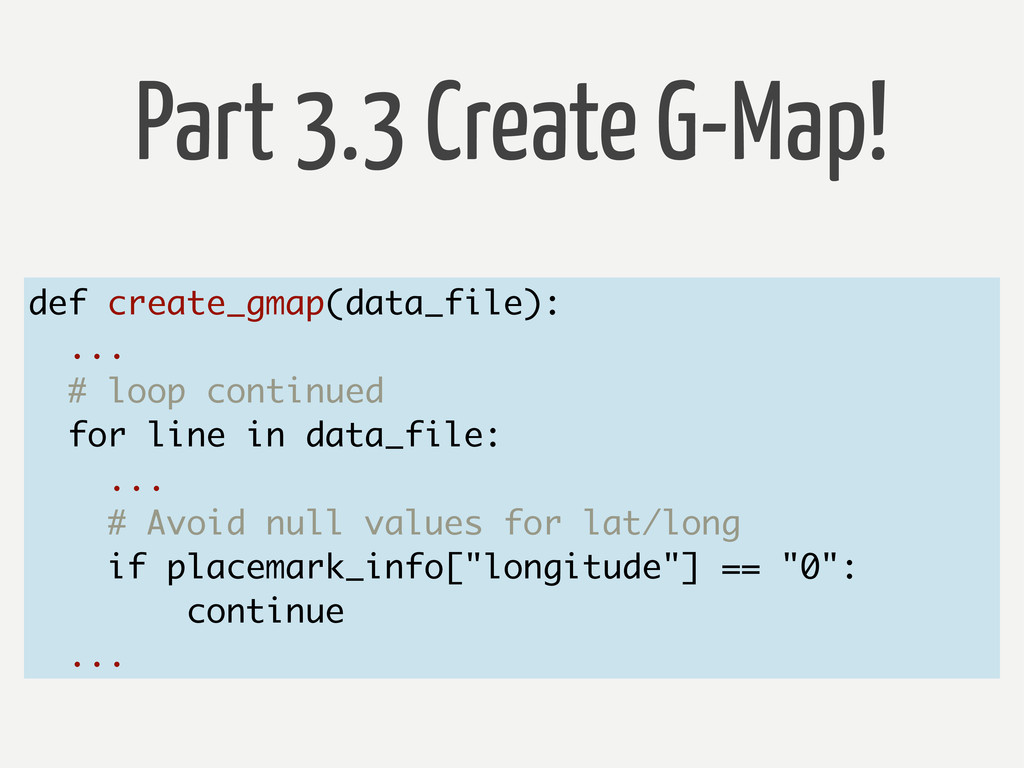
Part 3.3 Create G-Map! def create_gmap(data_file): ... # loop continued
for line in data_file: ... # Avoid null values for lat/long if placemark_info["longitude"] == "0": continue ...
Part 3.3 Create G-Map! def create_gmap(data_file): ... # loop continued
for line in data_file: ... # parse line of data into KML-format placemark = create_placemark(placemark_info) ...
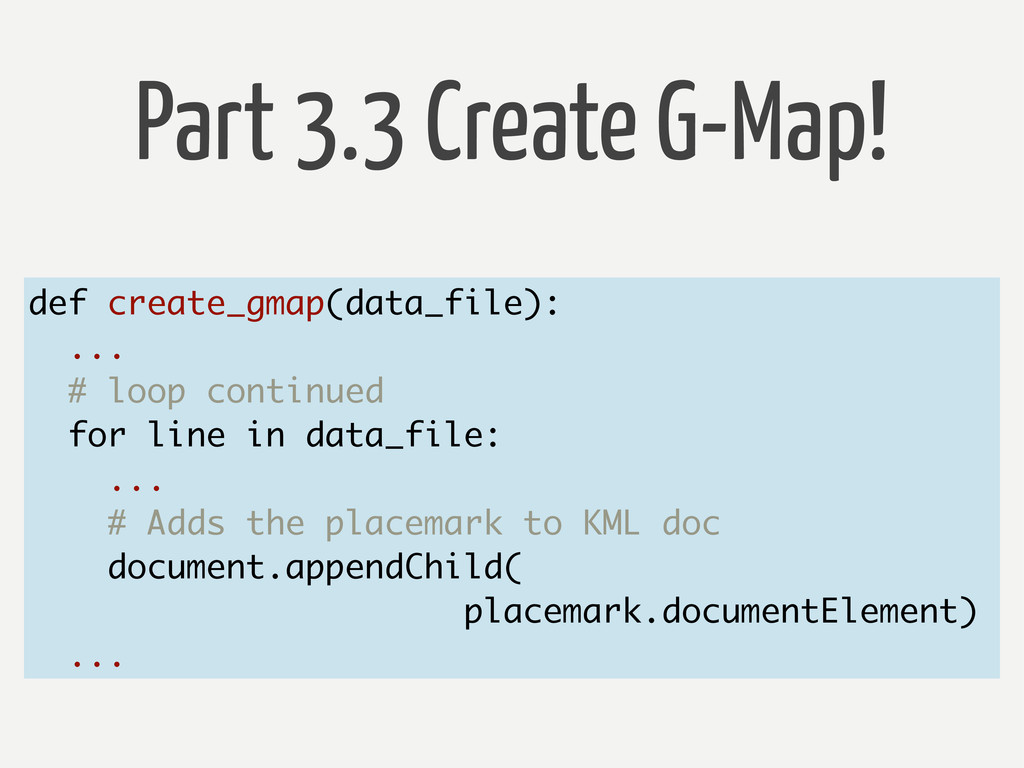
Part 3.3 Create G-Map! def create_gmap(data_file): ... # loop continued
for line in data_file: ... # Adds the placemark to KML doc document.appendChild( placemark.documentElement) ...
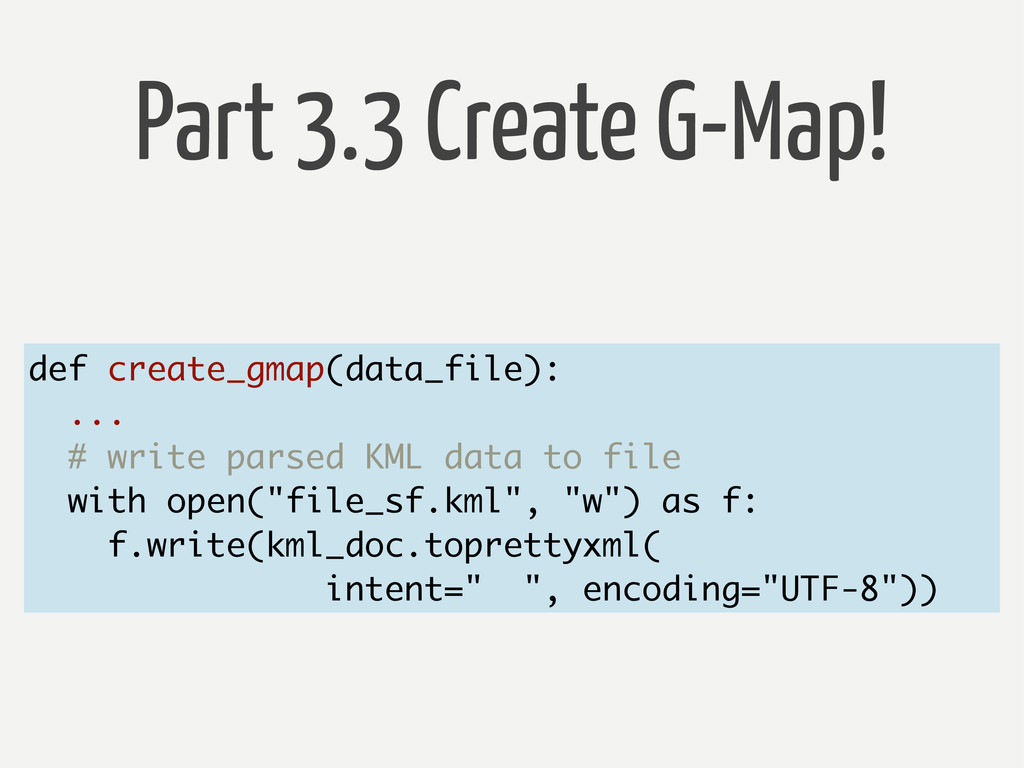
Part 3.3 Create G-Map! def create_gmap(data_file): ... # write parsed
KML data to file with open("file_sf.kml", "w") as f: f.write(kml_doc.toprettyxml( intent=" ", encoding="UTF-8"))
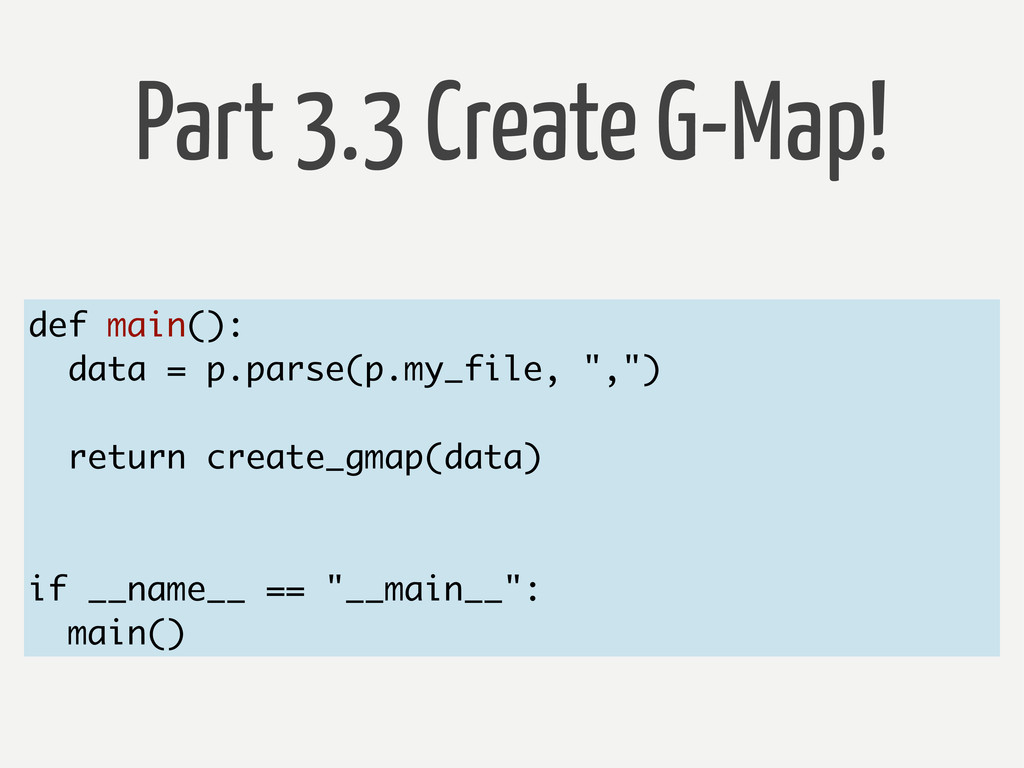
Part 3.3 Create G-Map! def main(): data = p.parse(p.my_file, ",")
return create_gmap(data) if __name__ == "__main__": main()
Follow me on uploading to Google Maps Part 3.3 Create
G-Map!
Congrats!
![Lynn Root @roguelynn roguelynn.com [email protected]](https://files.speakerdeck.com/presentations/40437010accd0130a1562e24c98a7ef2/slide_1.jpg)