Upgrade to Pro — share decks privately, control downloads, hide ads and more …

QTNet: Theory-based Queue Length Prediction for Urban Traffic @KDD2023

QTNet: Theory-based Queue Length Prediction for Urban Traffic @KDD2023

The presentation slides of our KDD2023 paper.
Ryu Shirakami, Toshiya Kitahara, Koh Takeuchi, Hisashi Kashima, "QTNet: Theory-based Queue Length Prediction for Urban Traffic", KDD2023.
https://dl.acm.org/doi/abs/10.1145/3580305.3599890

白上 龍 (Ryu Shirakami)

October 24, 2023
Tweet

More Decks by 白上 龍 (Ryu Shirakami)

Other Decks in Research

Transcript

  1. QTNet: Theory-based Queue Length Prediction for Urban Traffic Ryu Shirakami1,

    Toshiya Kitahara1, Koh Takeuchi2, Hisashi Kashima2 1Sumitomo Electric System Solutions Co., Ltd. 2Kyoto University
  2. 3 Question What frustrates you most when you drive a

    car?  Traffic congestion Maps Data: Google, 2023© Maps Data: Google, 2023©
  3. 4 Negative Impacts on Society  Economic losses of $88B/year

    in the US alone  50% increase in greenhouse gas emissions during congestion [Barth+, 2008]
  4. 5 How To Reduce Traffic Congestion?  Intelligent Transport Systems

    (ITS)  Systems that optimize traffic by controlling traffic signals and providing information to drivers based on the latest information and communication technologies. https://www.keishicho.metro.tokyo.lg.jp Traffic Control Center in Tokyo  8,000 signals  20,000 detectors
  5. 6 Traffic Prediction Is Important Theory-based Data-driven Macroscopic Microscopic Car-following

    model Queueing Theory Kinematic Wave Theory Statistical Deep Learning RNN VAR STGNN ARIMA CNN 😄 High expressive power
  6. 7 Traffic Prediction Is NOT Easy  Complex dependencies 

    Intra-data • Temporal dependencies  Inter-data • Spatial dependencies • Dependencies between different variables
  7. 8 Traffic Prediction Is NOT Easy  Complex dependencies 

    Intra-data • Temporal dependencies  Inter-data • Spatial dependencies • Dependencies between different variables STGNNs Tackle! Tackle!
  8. 9 Traffic Prediction is NOT Easy  Complex dependencies 

    Intra-data • Temporal dependencies  Inter-data • Spatial dependencies • Dependencies between different variables STGNNs Tackle! Tackle! Still remaining
  9. 10 Traffic Prediction is NOT Easy  Complex dependencies 

    Intra-data • Temporal dependencies  Inter-data • Spatial dependencies • Dependencies between different variables STGNNs Tackle! Tackle! Still remaining There is no STGNN considering relationships between variables. Due to strong dependencies, performance can be improved by taking them into account.
  10. 11 Target of Traffic Prediction  What traffic variables are

    available as public datasets? Variable Description Dataset Travel Speed [km/h] The inverse of the time required to travel a given road segment. METR-LA, PeMS-BAY Traffic Flow [veh/h] The number of vehicles that pass through a given location in a unit time. PeMSD3, PeMSD4 Queue Length [m] The length of the queue of vehicles on a given road segment. None! Is queue length less important?  NO
  11. 12 Queue Length Prediction Is Important for ITS  It

    can be used for:  Proactive traffic signal control • It is based on the future traffic demand. • Traffic demand = #Items in Queue + Incoming flow  Providing information to drivers • Queue length intuitively tells drivers the degree of congestion. Estimated from queue length
  12. 13 Queue Length Prediction Is Important for ITS  It

    can be used for:  Proactive traffic signal control • It is based on the future traffic demand. • Traffic demand = #Items in Queue + Incoming flow  Providing information to drivers • Queue length intuitively tells drivers the degree of congestion. Estimated from queue length There is no dataset that contains queue length so there is no STGNN for queue length prediction!
  13. 14 Challenges to Predict Queue Length 1. Zero-inflated distribution 2.

    Spike shape when it occurs Difficult to train!
  14. 15 Challenges to Predict Queue Length 1. Zero-inflated distribution 2.

    Spike shape when it occurs  Queue occurs suddenly when traffic demand exceeds the capacity of the roads. 𝐶𝑎𝑝𝑎𝑐𝑖𝑡𝑦 𝐷𝑒𝑚𝑎𝑛𝑑 Difficult to predict from its history!
  15. 16 Challenges to Predict Queue Length 1. Zero-inflated distribution 2.

    Spike shape when occurring  Predicting queue length is more difficult than predicting speed/flow.  Existing methods can lead to performance degradation.
  16. 17 Problems We Have Addressed 1. Relationships between variables are

    ignored  We combine two areas of research to account for relationships between variables. 2. No STGNN for queue length prediction  We developed a queue length prediction model by using a dataset containing queue length collected in the real world. 3. Low interpretability  We make our model interpretable by using the traffic theory.
  17. 18 Contributions 1. We propose a Queueing-Theory-based neural Network (QTNet)

    for queue length prediction. 2. We developed a theory-based layer called QT-layer, making results explainable. 3. QTNet improves prediction accuracy by 12.6% over baseline models in a real-world queue length prediction experiment.
  18. 19 Problem Setting  Road network as a directed graph

     Nodes: Road segments  Edges: Connections between segments Seg 3 Seg 4 Seg 1 Seg 2 Seg 5 Seg 6 Seg 1 Seg 2 Seg 3 Seg 4 Seg 5 Seg 6
  19. 20 Problem Setting  Predict future queue len. from past

    observations  Inputs: Observations for the past T’ timestamps 𝑿𝑡−𝑇′:𝑡 ∈ ℝ𝑁×𝐷×𝑇′ and time-independent auxiliary information 𝑿 ∈ ℝ𝑁×𝐷𝑎.  Outputs: Traffic variables up to T timestamps ahead 𝒀𝑡:𝑡+𝑇 ∈ ℝ𝑁×𝐷×𝑇. Inputs Outputs T timestamps T’ timestamps
  20. 21 Proposed Method: QTNet 𝑃𝑇𝐹, 𝑆𝑇𝐹 STGNN QT-layer Encoders Decoders

    Queue len. Speed Flow Correction Term Speed Flow Inputs: the past T’ timestamps Outputs: T timestamps ahead Queue len. Theory-based layer Output queue length based on the sandglass model. Queueing-Theory-based Neural Network
  21. 22 Sandglass Model  An equation known in traffic engineering.

     Based on the queueing theory equation at a stationary state, called Little’s Law. Road Segment Segment length L Queue length l Incoming flow Q Free flow speed v0 Average speed v ρ0 , a: Hyper parameters
  22. 23 Sandglass Model  Sandglass model is NOT always satisfied.

     Because of the gap between theory and reality caused by unrealistic assumptions.  This model is successful in expressing the trend of queue length.
  23. 24 QT-layer  We propose QT-layer to predict queue length

    based on the sandglass model. where . Sandglass model Correction term
  24. 25 Auxiliary Inputs: PTF and STF  Periodic Traffic Features

    (PTF)  Periodicity of traffic data such as rush hours.  Static Traffic Features (STF)  Heterogeneity of roads such as the segment length, the number of inflow/outflow segments, etc.
  25. 26 Proposed Method: QTNet 𝑃𝑇𝐹, 𝑆𝑇𝐹 STGNN QT-layer Encoders Decoders

    Queue len. Speed Flow Correction Term Speed Flow Inputs Outputs Queue len. Theory-based layer Output queue length based on the sandglass model. Queueing-Theory-based Neural Network
  26. 27 Loss Function with Sample Weighting Queue Len. Speed Flow

    Overall Loss Less frequent congested data are treated more seriously. 𝑙: Queue length 𝑣: Speed 𝑄: Flow ෝ ⋅ : Predicted Value 𝐿: Segment length 𝜆1~4 , 𝑐1 , 𝑐2 , 𝑤0 : Hyper parameters
  27. 28 Experiments: Real-world Dataset  Traffic data collected by traffic

    control systems in the Tokyo metropolitan area Data Period Oct. 2020 ~ Jul. 2021 (10 months) Time Interval 5 min # of Road Segments 1,098 Types of Data Queue length [m], Travel speed [km/h], Traffic flow [veh/h] of each segment
  28. 29 Experiments: Four Types of Datasets  For a fair

    performance evaluation, we used four types of datasets.  To address a zero-inflated distribution, the performance of a model that always predict zero would be highly valued. All Data All the observed data Non-zero Data Queue length > 0m Worst 10% Queue length > 200m Worst 5% Queue length > 300m Serious congestion
  29. 30 Experiments: Inputs and Outputs  Inputs  Traffic variables

    in the past one hour (12 timestamps) • Queue length • Average speed of each segment • Traffic flow  Auxiliary information: PTF & STF
  30. 31 Experiments: Inputs and Outputs  Outputs  Traffic variables

    up to one hour ahead (12 timestamps) • Queue length • Average speed of each segment • Traffic flow
  31. 32 Experiments: Baselines  Statistical methods: HA, VAR, ARIMA 

    Deep learning methods: LSTM[Rahman+, 2021]  STGNNs: DCRNN[Li+, 2018], AGCRN[Bai+, 2020], GWNT[Wu+, 2019], MegaCRN[Jiang+, 2023] In the following slides, we only show the results of STGNNs and QTNet. If you are interested in a detailed comparison, please check our paper!
  32. 33 Result 1: QTNet outperforms baselines  QTNet improves queue

    length prediction accuracy by 12.6% in RMSE compared to baseline STGNNs.
  33. 34 Results 2: QTNet is interpretable  QT-layer constrains behavior

    of traffic variables. Flow Queue len. QT-layer STGNN QTNet Speed The queue will grow as the incoming flow increases rapidly. QTNet Consistent
  34. 35 Results 3: QT-layer also contributes to accuracy  We

    conducted an ablation study.  QTNet vs three variants  We confirmed that QT-layer also contributes prediction accuracy. Q: QT-layer, W: Sample Weighting, F: Auxiliary Features
  35. 36 Summary 1. We propose a Queueing-Theory-based neural Network (QTNet)

    for queue length prediction. 2. We developed a theory-based layer called QT-layer, making results explainable. 3. QTNet improves prediction accuracy by 12.6% over baseline models in a real-world queue length prediction experiment.
  36. 37 Contact Information  Email: [email protected] or [email protected]  Our

    Paper:  Our Company and Lab: Sumitomo Electric Sumitomo Electric System Solutions Kashima Lab. @Kyoto University
  37. 38 References  [Bai+, 2020] L. Bai, L. Yao, C.

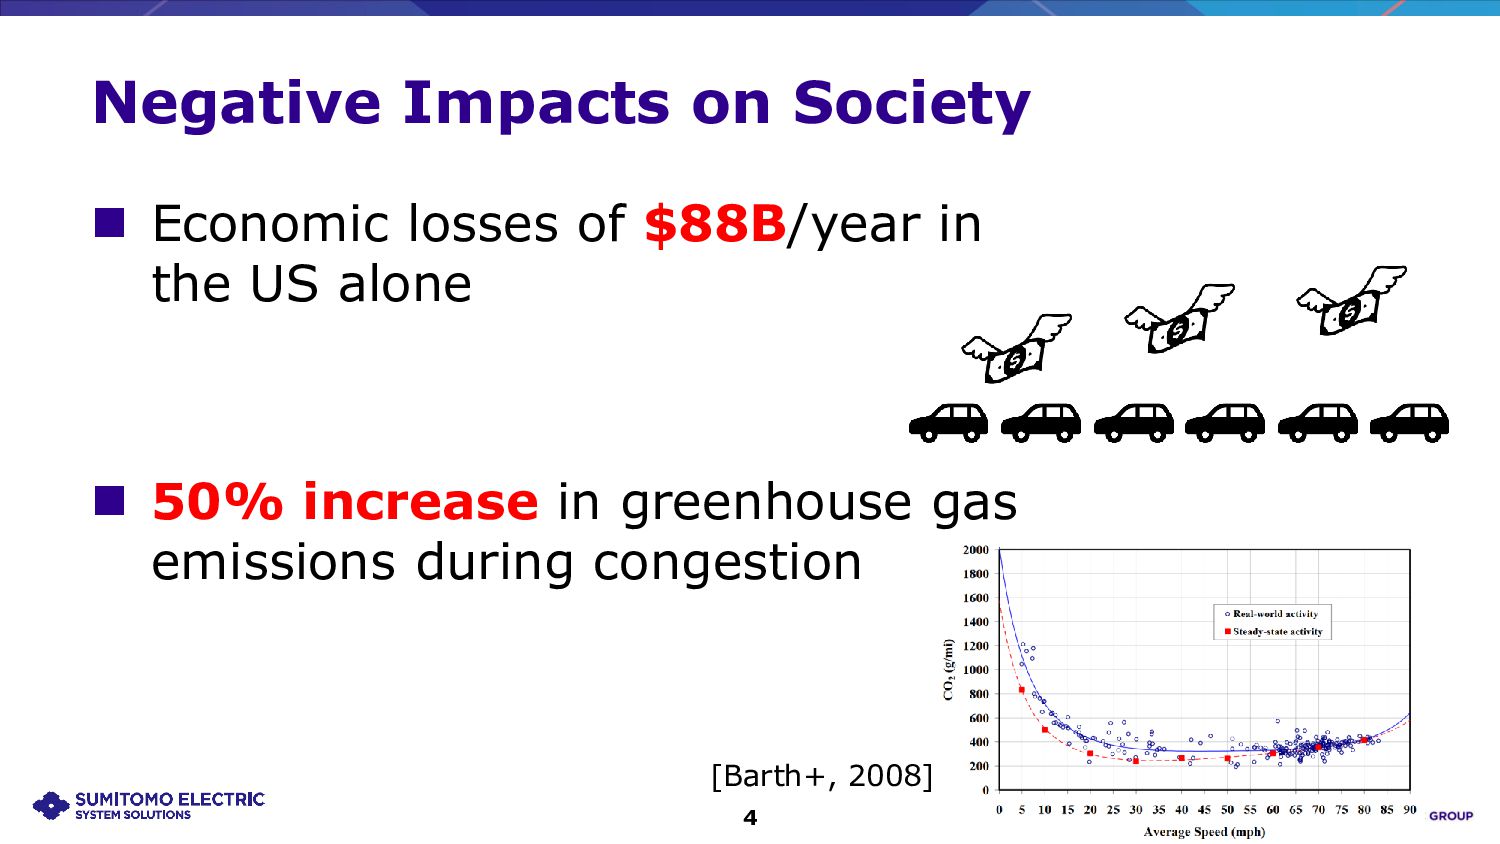
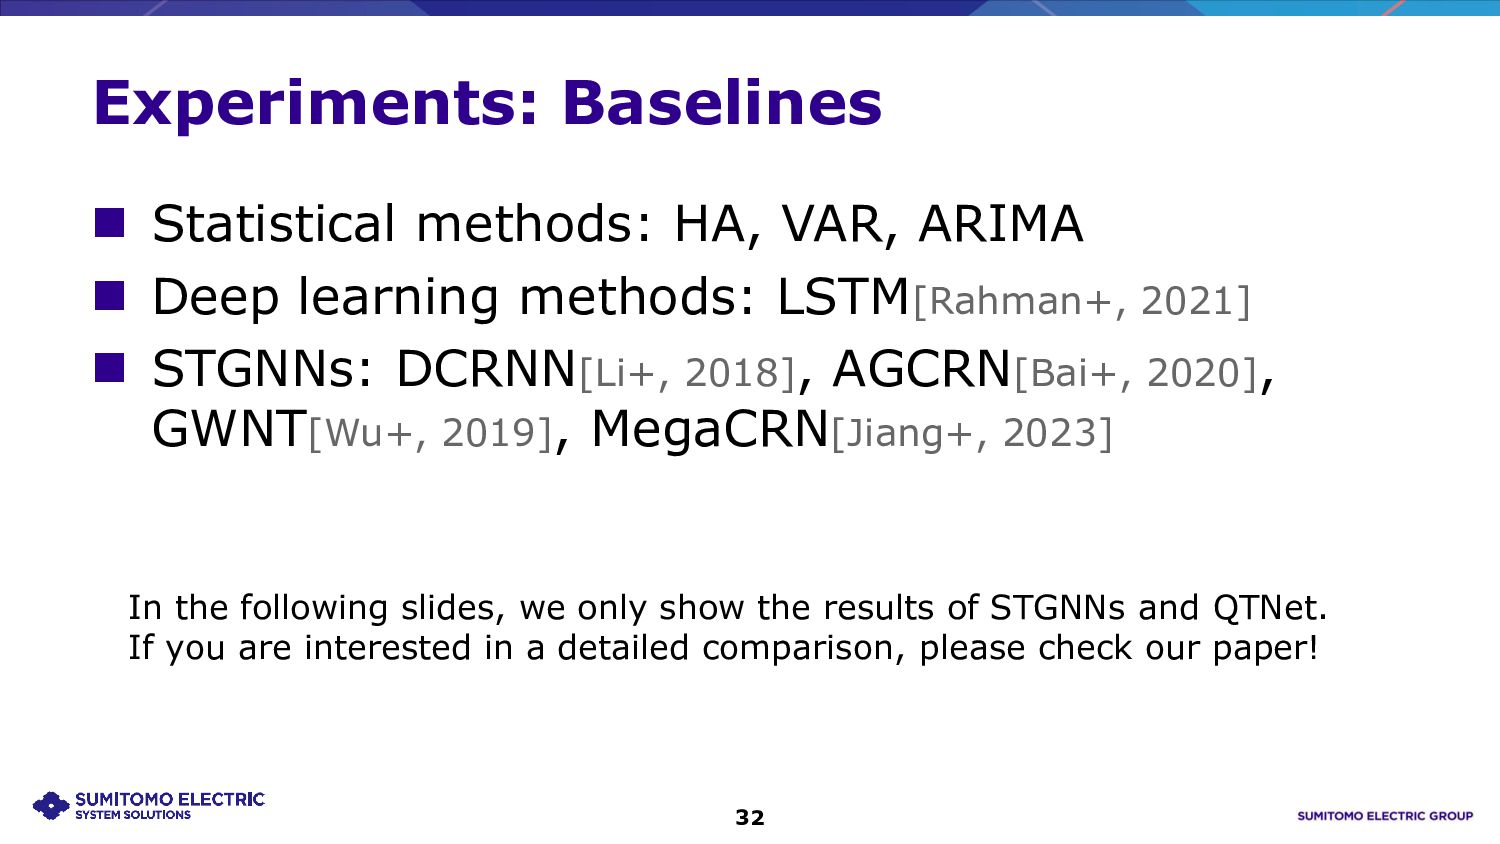
    Li, X. Wang, and C. Wang, “Adaptive Graph Convolutional Recurrent Network for Traffic Forecasting”, in AAAI 2020.  [Barth+, 2008] M. Barth and K. Boriboonsomsin, “Real-World Carbon Dioxide Impacts of Traffic Congestion”, Transportation Research Record 2058, 1 (2008).  [Li+, 2018] Y. Li, R. Yu, C. Shahabi, and Y. Liu, “Diffusion Convolutional Recurrent Neural Network: Data-Driven Traffic Forecasting”, in ICLR 2018.  [Jiang+, 2023] Renhe Jiang, ZhaonanWang, Jiawei Yong, Puneet Jeph, Quanjun Chen, Yasumasa Kobayashi, Xuan Song, Shintaro Fukushima, and Toyotaro Suzumura, “Spatio-Temporal Meta- Graph Learning for Traffic Forecasting”, in AAAI 2023.  [Rahman+, 2021] Rezaur Rahman and Samiul Hasan, “Real-time signal queue length prediction using long short-term memory neural network”, Neural Computing and Applications 33 (2021).  [Wu+, 2019] Z. Wu, S. Pan, G. Long, J. Jiang, and C. Zhang, “Graph WaveNet for Deep Spatial- Temporal Graph Modeling”, in IJCAI 2019.