output in your browser Rich Signell , USGS, Woods Hole, MA, USA Filipe Fernandes, Centro Universidade Monte Serrat, Santos, Brazil Kyle Wilcox, Axiom Data Science, Wickford, RI, USA NOAA “Tuesday” Seminar Series 2015-12-16
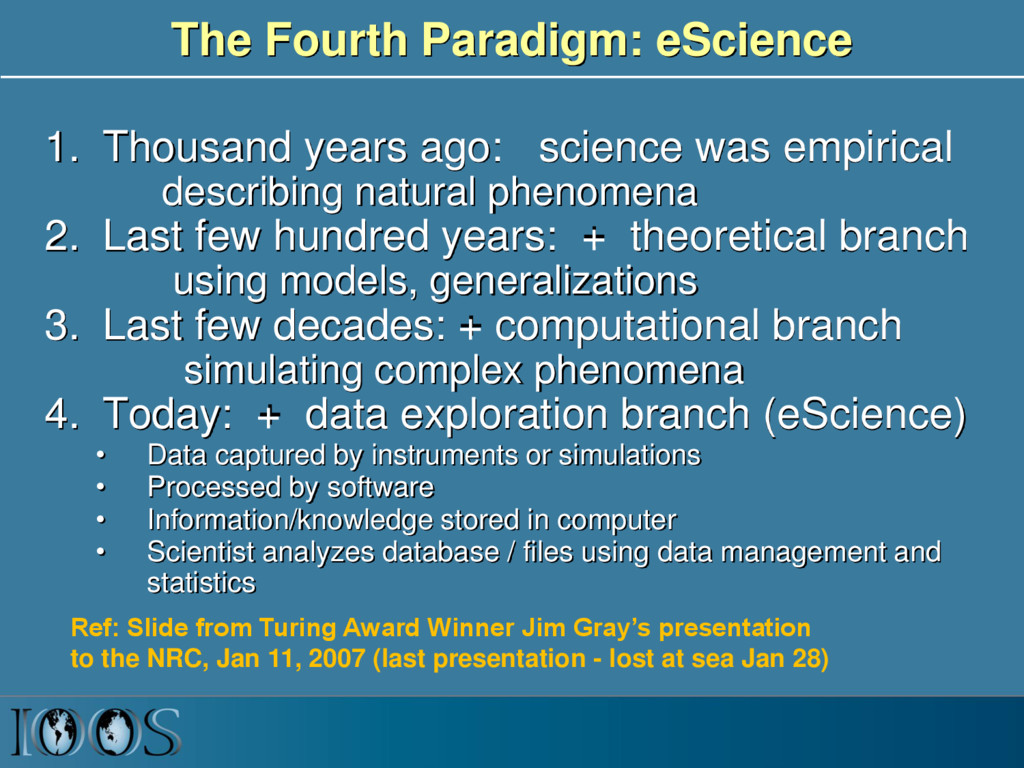
empirical describing natural phenomena 2. Last few hundred years: + theoretical branch using models, generalizations 3. Last few decades: + computational branch simulating complex phenomena 4. Today: + data exploration branch (eScience) • Data captured by instruments or simulations • Processed by software • Information/knowledge stored in computer • Scientist analyzes database / files using data management and statistics Ref: Slide from Turing Award Winner Jim Gray’s presentation to the NRC, Jan 11, 2007 (last presentation - lost at sea Jan 28)
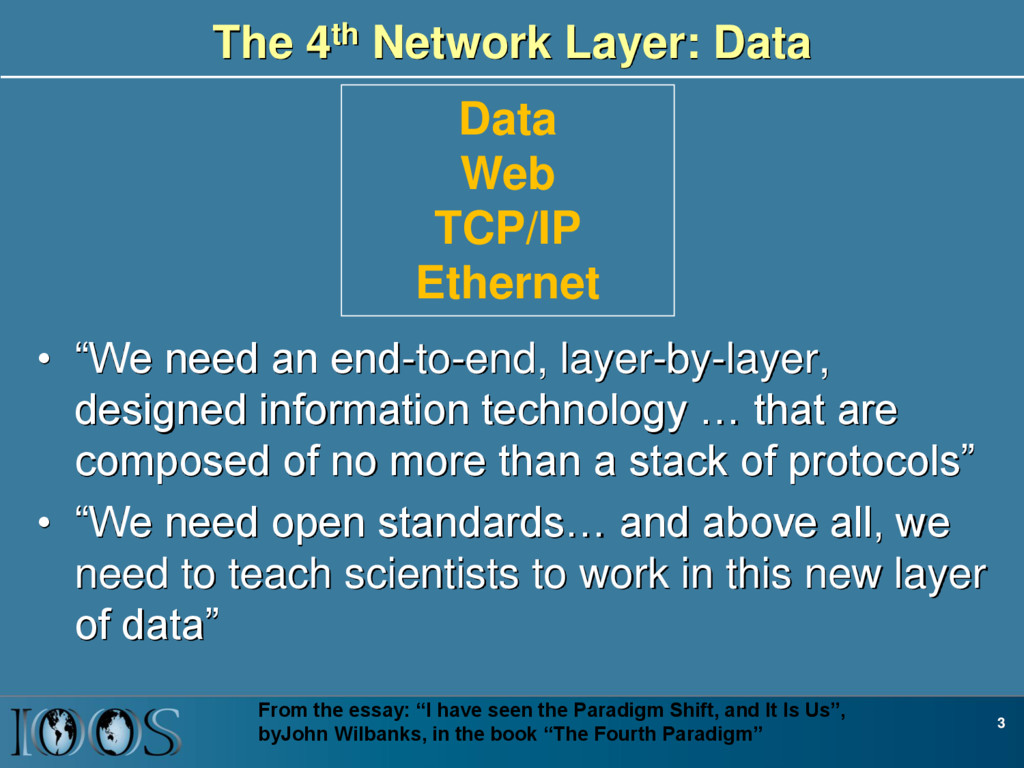
layer-by-layer, designed information technology … that are composed of no more than a stack of protocols” • “We need open standards… and above all, we need to teach scientists to work in this new layer of data” 3 From the essay: “I have seen the Paradigm Shift, and It Is Us”, byJohn Wilbanks, in the book “The Fourth Paradigm” Data Web TCP/IP Ethernet
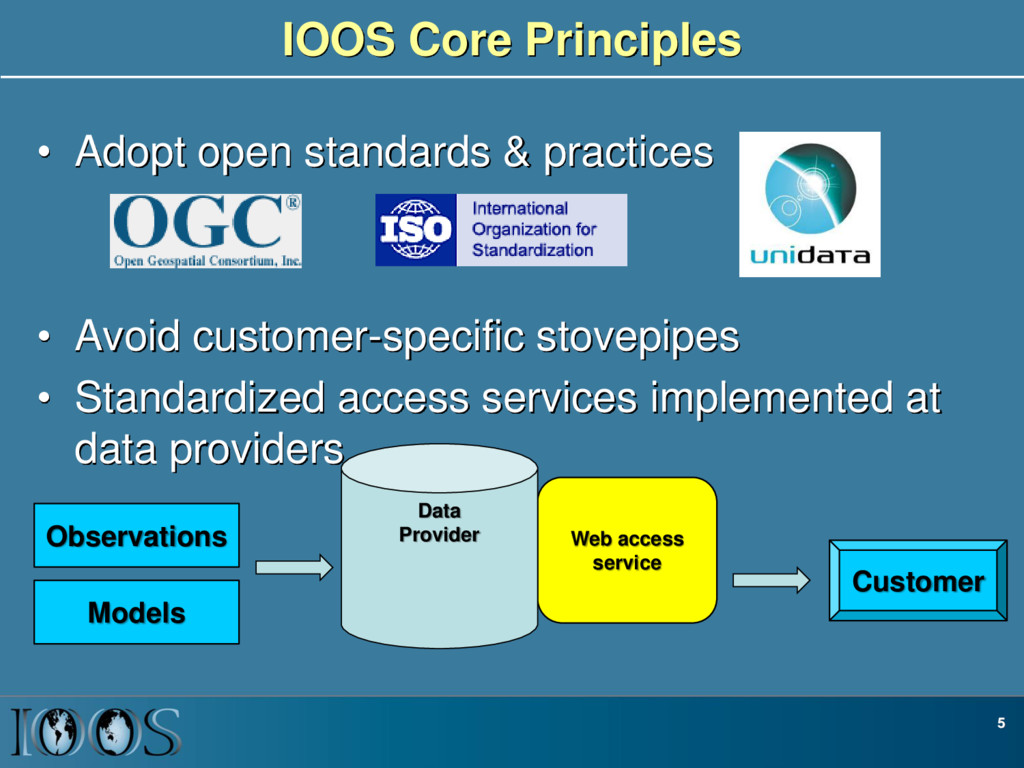
Avoid customer-specific stovepipes • Standardized access services implemented at data providers 5 Customer Web access service Data Provider Observations Models
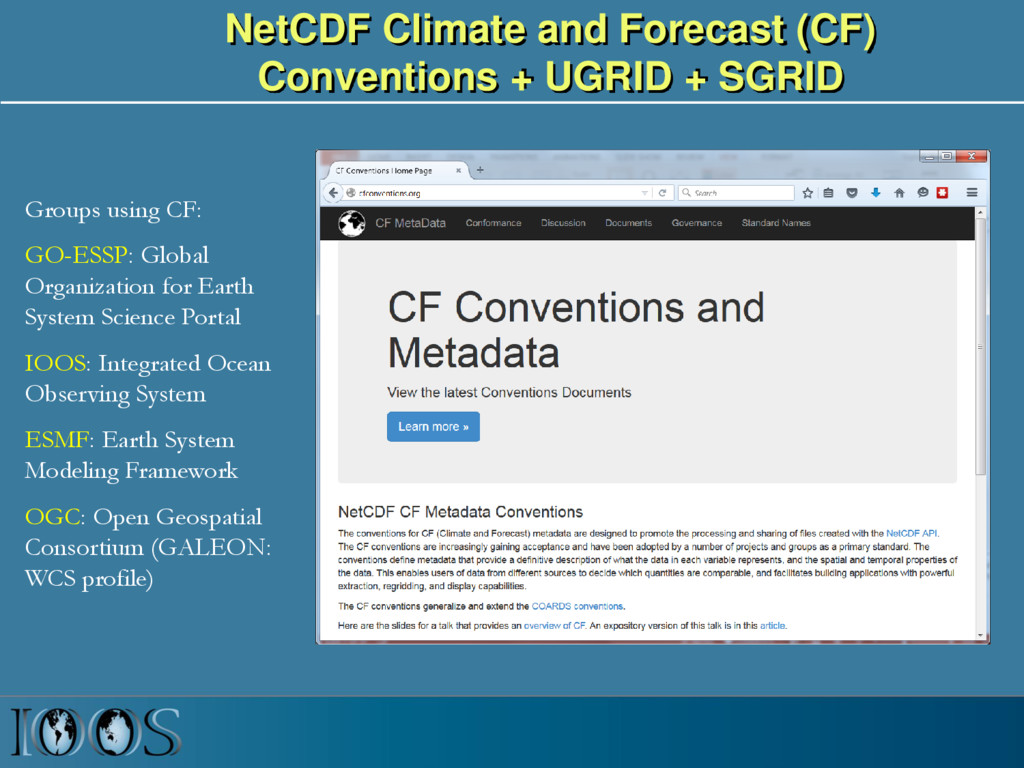
Groups using CF: GO-ESSP: Global Organization for Earth System Science Portal IOOS: Integrated Ocean Observing System ESMF: Earth System Modeling Framework OGC: Open Geospatial Consortium (GALEON: WCS profile)
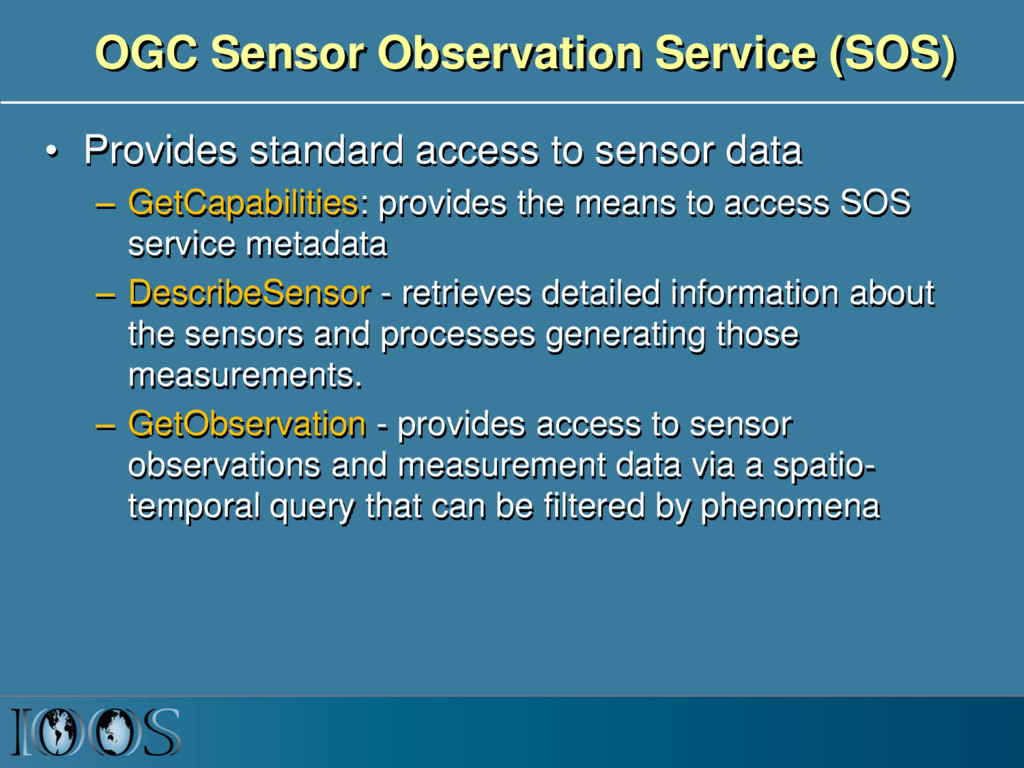
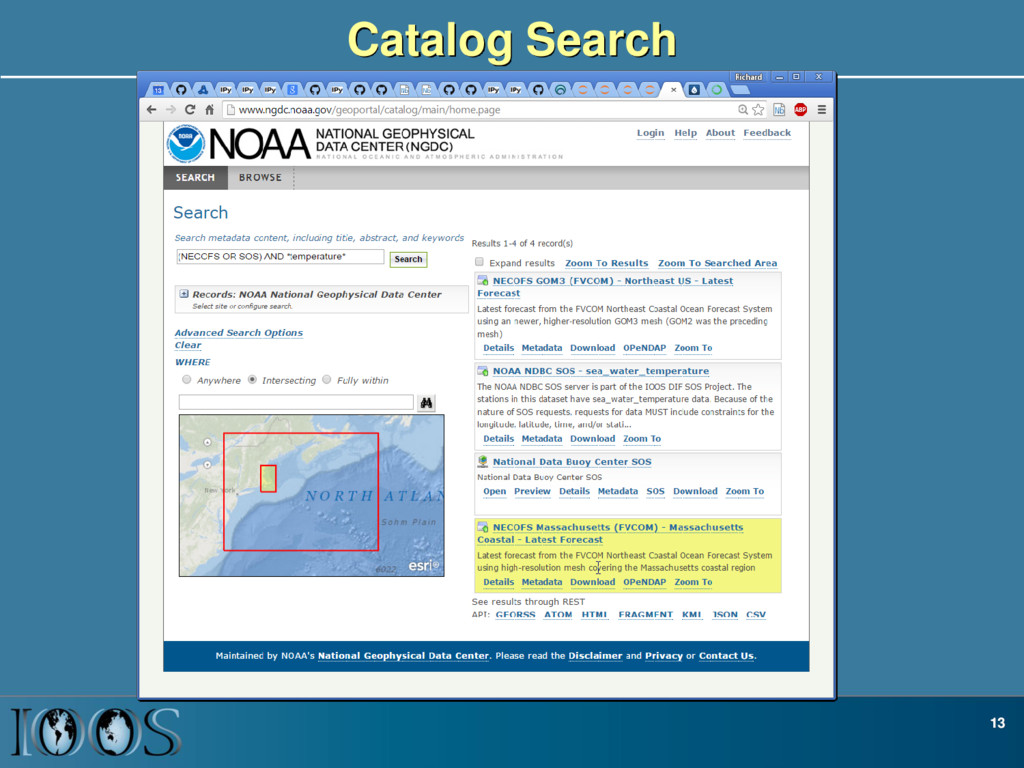
sensor data – GetCapabilities: provides the means to access SOS service metadata – DescribeSensor - retrieves detailed information about the sensors and processes generating those measurements. – GetObservation - provides access to sensor observations and measurement data via a spatio- temporal query that can be filtered by phenomena
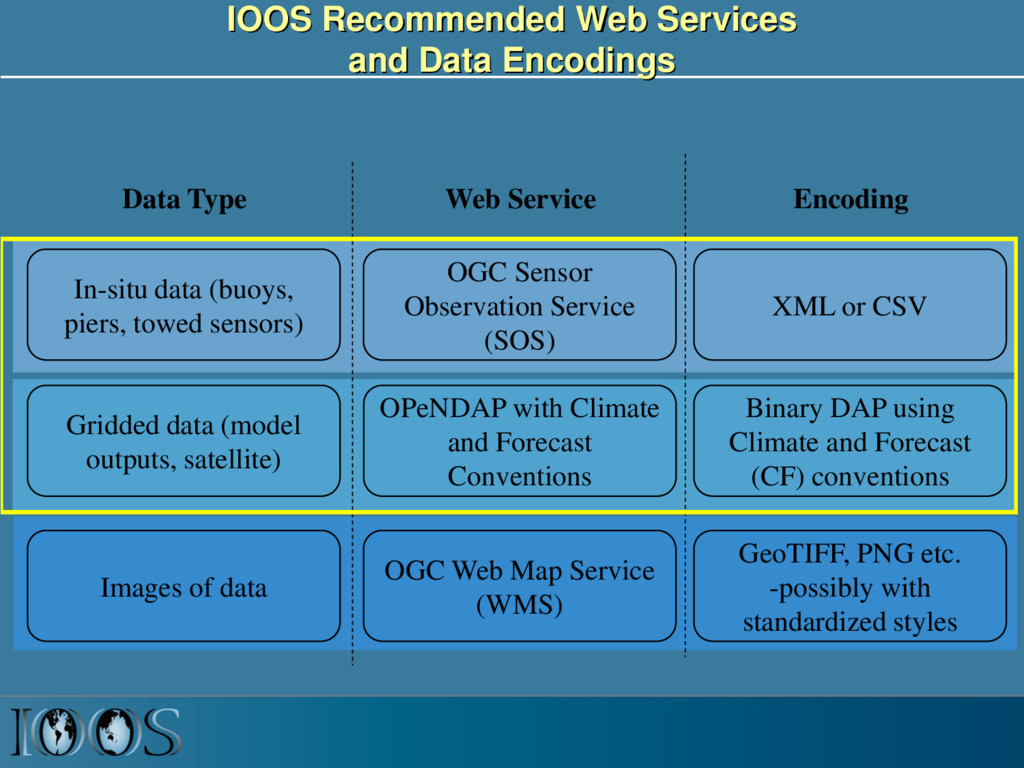
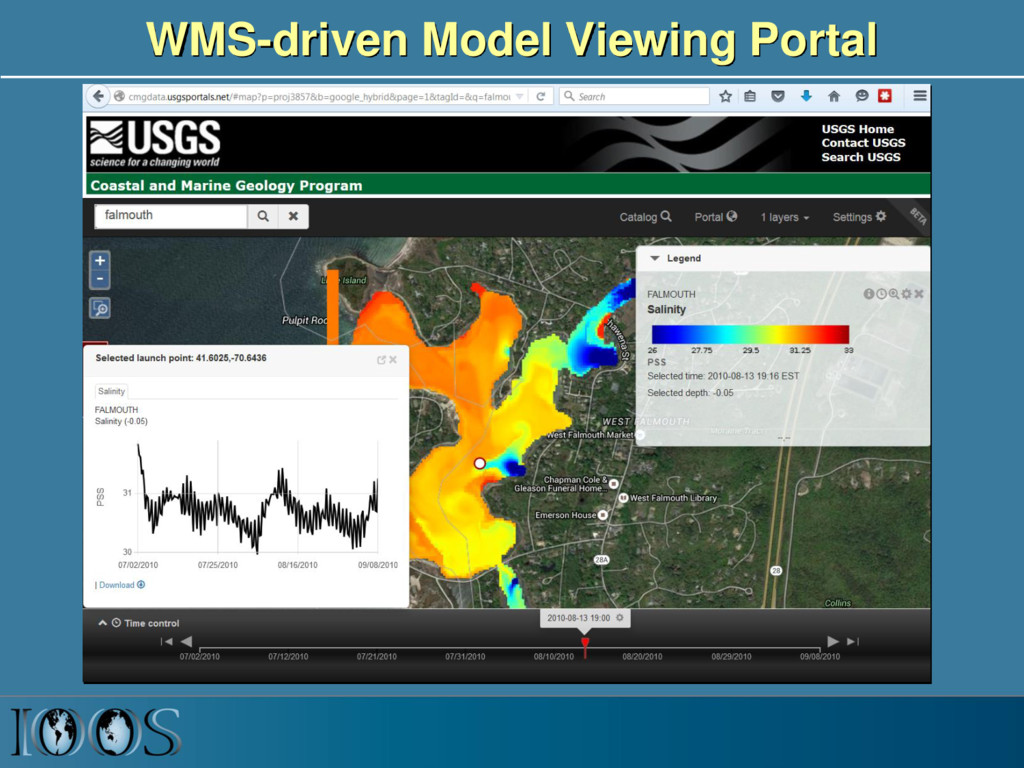
piers, towed sensors) Gridded data (model outputs, satellite) OGC Sensor Observation Service (SOS) OPeNDAP with Climate and Forecast Conventions XML or CSV Binary DAP using Climate and Forecast (CF) conventions Images of data OGC Web Map Service (WMS) GeoTIFF, PNG etc. -possibly with standardized styles Data Type Web Service Encoding
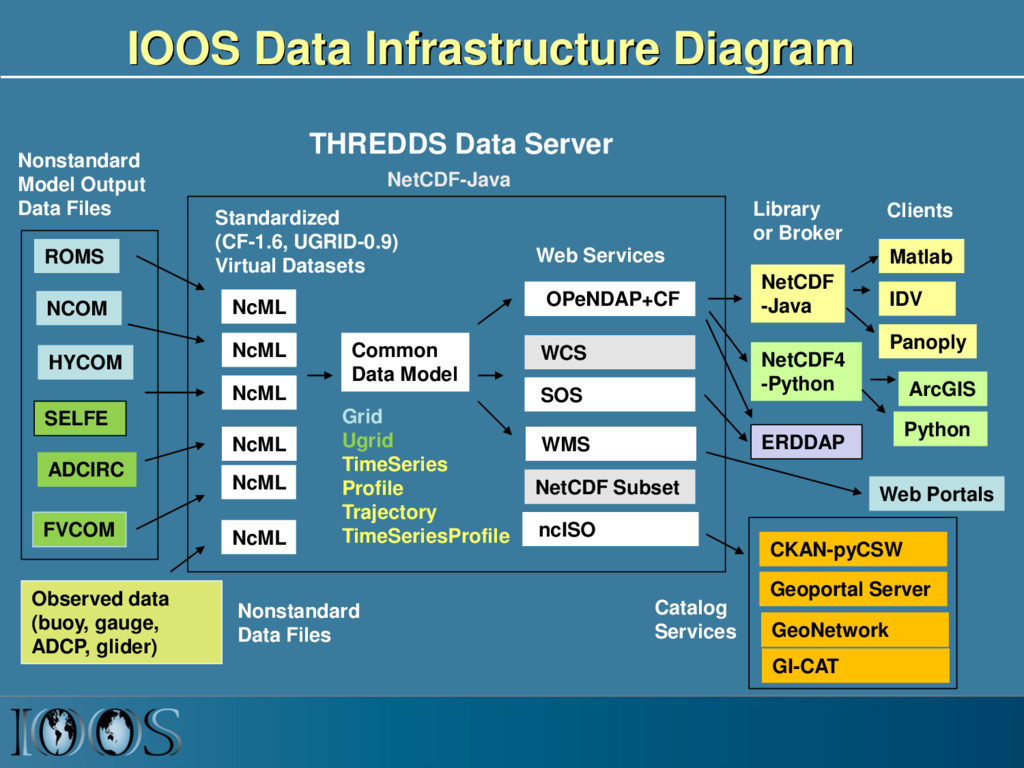
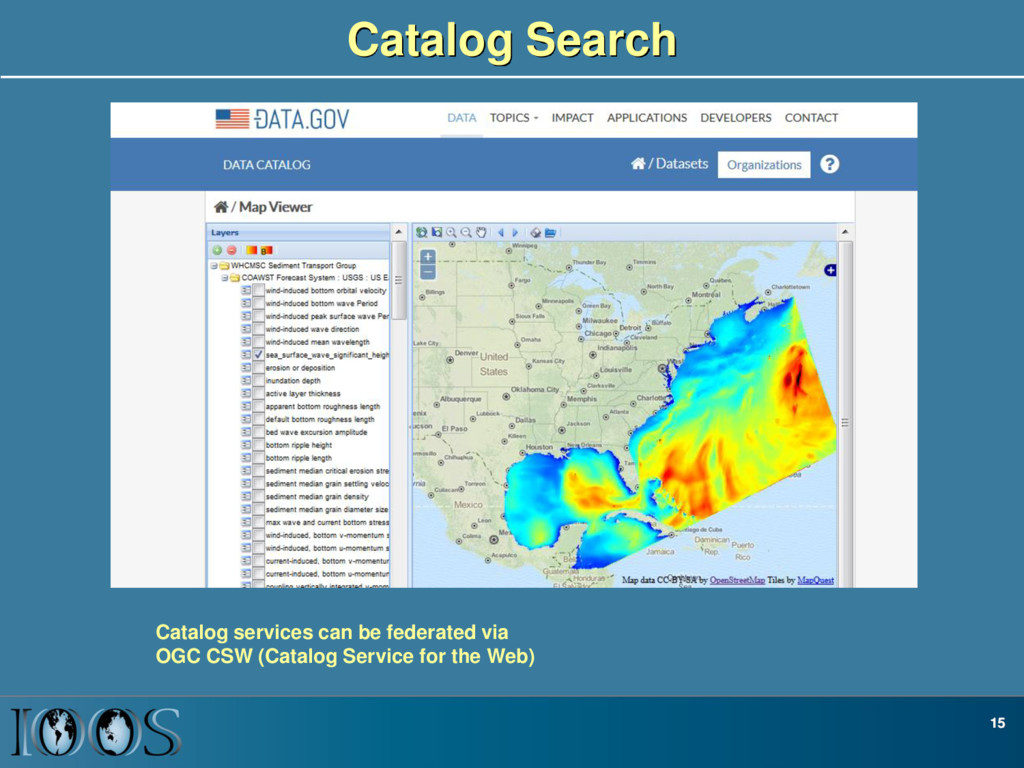
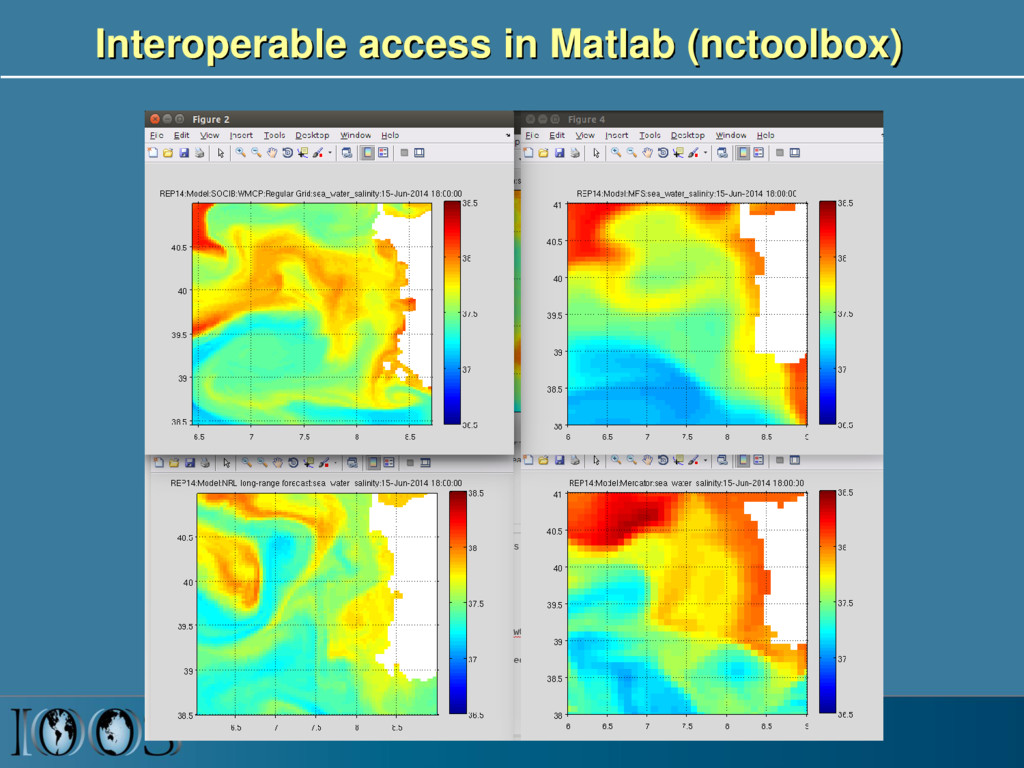
NcML NcML NcML NcML Common Data Model OPeNDAP+CF WCS NetCDF Subset THREDDS Data Server Standardized (CF-1.6, UGRID-0.9) Virtual Datasets Nonstandard Model Output Data Files Web Services Matlab Panoply IDV Clients NetCDF -Java Library or Broker WMS ncISO ArcGIS NetCDF4 -Python FVCOM Python ERDDAP NetCDF-Java SOS Geoportal Server GeoNetwork GI-CAT Observed data (buoy, gauge, ADCP, glider) Web Portals CKAN-pyCSW NcML Grid Ugrid TimeSeries Profile Trajectory TimeSeriesProfile Nonstandard Data Files Catalog Services
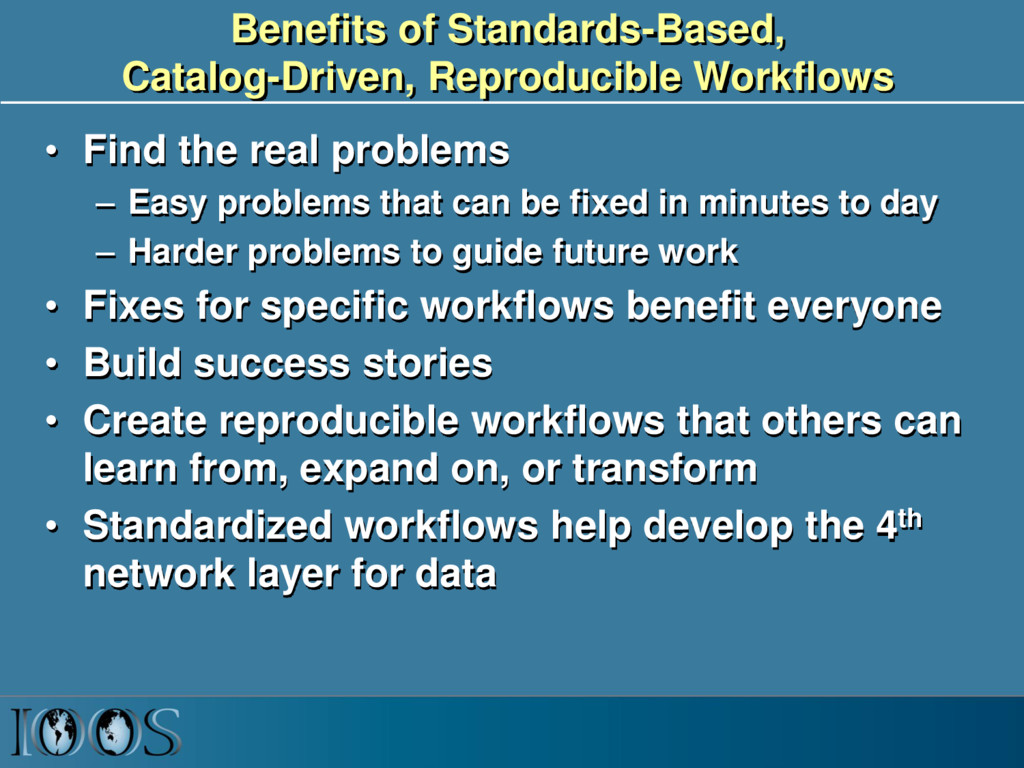
problems – Easy problems that can be fixed in minutes to day – Harder problems to guide future work • Fixes for specific workflows benefit everyone • Build success stories • Create reproducible workflows that others can learn from, expand on, or transform • Standardized workflows help develop the 4th network layer for data
![[ rsignell-usgs | ocefpaf ] & github](https://files.speakerdeck.com/presentations/33577fff6b7a4fae9066a914eff4d7af/slide_31.jpg)