Upgrade to Pro
— share decks privately, control downloads, hide ads and more …
Speaker Deck
Features
Speaker Deck
PRO
Sign in
Sign up for free
Search
Search
Interactive Python Dashboard with Dash and Depl...
Search
Doni Rubiagatra
April 26, 2020
Technology
3.7k
0
Share
Embed
Copy iframe code
Copy JS code
Copy link
Start on current slide
Interactive Python Dashboard with Dash and Deploy to Google Cloud Platform
Doni Rubiagatra
April 26, 2020
More Decks by Doni Rubiagatra
See All by Doni Rubiagatra
Prinsip Dasar dalam Membuat Web Visualisasi Data Interaktif
rubiagatra
1
160
Introduction to NATS: A high-performance messaging system as a solution for communication between services
rubiagatra
0
380
Other Decks in Technology
See All in Technology
40代で“やっとエンジニアになれた”――閉じた学びを開き、空の青さを知る / 20260628 Naoki Takahashi
shift_evolve
PRO
4
510
Bucharest Tech Week 2026 - Reinventing testing practices in the AI era
edeandrea
PRO
1
170
コミットの「なぜ」を読む
ota1022
0
110
不要なレビューをAIにまかせて AIコーディングの環境改善を加速した
shoota
1
250
アジャイルな経理と Claude Code と 経営の未来
kawaguti
PRO
3
180
[チョークトーク資料]AWS DevOps Agent を使いこなす / AWS Dev Ops Agent Chalk Talk AWS Summit Japan 2026
kinunori
3
730
データレイクの「見えない問題」を可視化する
sansantech
PRO
1
170
手塩にかけりゃいいってもんじゃない
ming_ayami
0
620
Kiro Ambassador を目指す話
k_adachi_01
0
110
気軽に使える"情報のハブ"としてのNotion活用 〜フロー情報の集積点 と、 Claude Code × Notion AI〜
syucream
1
170
生成 AI 実践ガイド (概略版) AIガバナンス編
asei
0
150
AIAU_UMEMOGU_ninomiya_slide
ninomiya_ii
0
250
Featured
See All Featured
A brief & incomplete history of UX Design for the World Wide Web: 1989–2019
jct
2
400
The AI Revolution Will Not Be Monopolized: How open-source beats economies of scale, even for LLMs
inesmontani
PRO
3
3.5k
Hiding What from Whom? A Critical Review of the History of Programming languages for Music
tomoyanonymous
2
870
Keith and Marios Guide to Fast Websites
keithpitt
413
23k
Paper Plane (Part 1)
katiecoart
PRO
0
9.2k
Money Talks: Using Revenue to Get Sh*t Done
nikkihalliwell
0
250
Building Experiences: Design Systems, User Experience, and Full Site Editing
marktimemedia
0
540
No one is an island. Learnings from fostering a developers community.
thoeni
21
3.8k
Thoughts on Productivity
jonyablonski
76
5.2k
Reality Check: Gamification 10 Years Later
codingconduct
0
2.2k
Why Our Code Smells
bkeepers
PRO
340
58k
Design and Strategy: How to Deal with People Who Don’t "Get" Design
morganepeng
133
19k
Transcript
Interactive Python Dashboard with Dash and Deploy to Google Cloud
Platform Doni Rubiagatra
[email protected]
surabaya.py - 26 April 2020
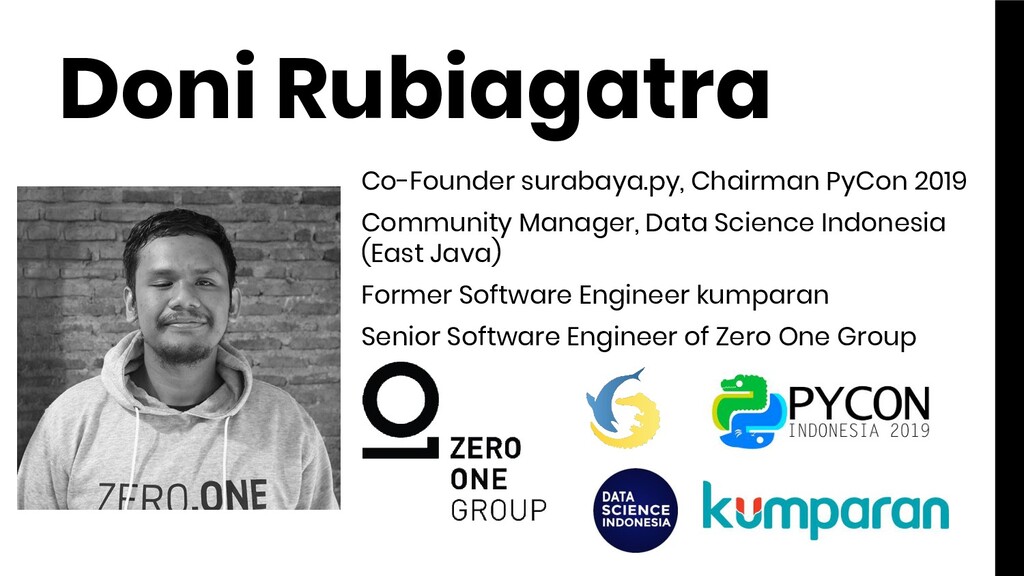
Doni Rubiagatra Co-Founder surabaya.py, Chairman PyCon 2019 Community Manager, Data
Science Indonesia (East Java) Former Software Engineer kumparan Senior Software Engineer of Zero One Group
RENCANA HARI INI 01 LANDSCAPE PYTHON VISUALIZATION 02 DEMO WITH
JUPYTER NOTEBOOK 03 DEMO DASH
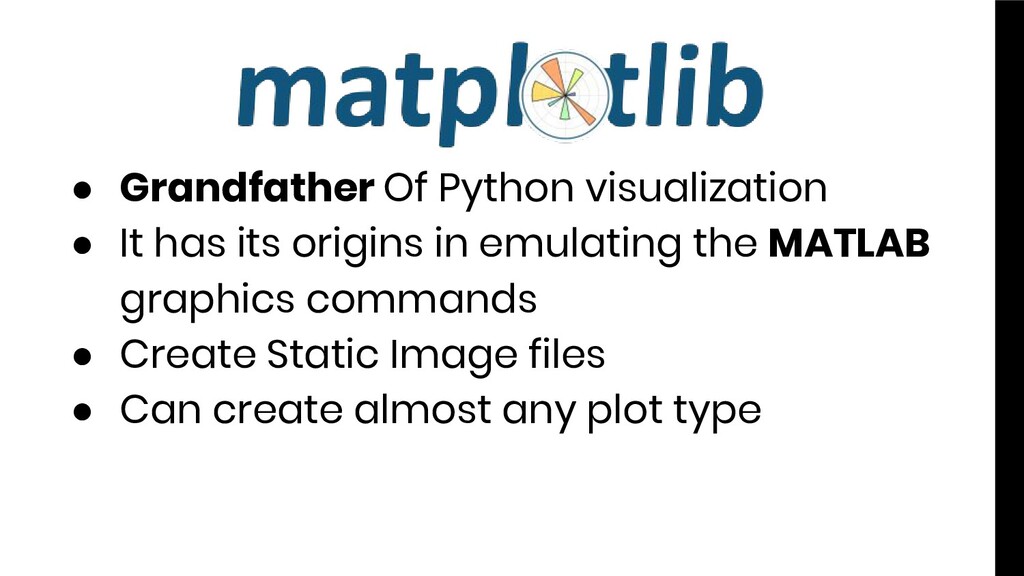
Python Visualize Landscape that We Frequently Use
• Grandfather Of Python visualization • It has its origins
in emulating the MATLAB graphics commands • Create Static Image files • Can create almost any plot type
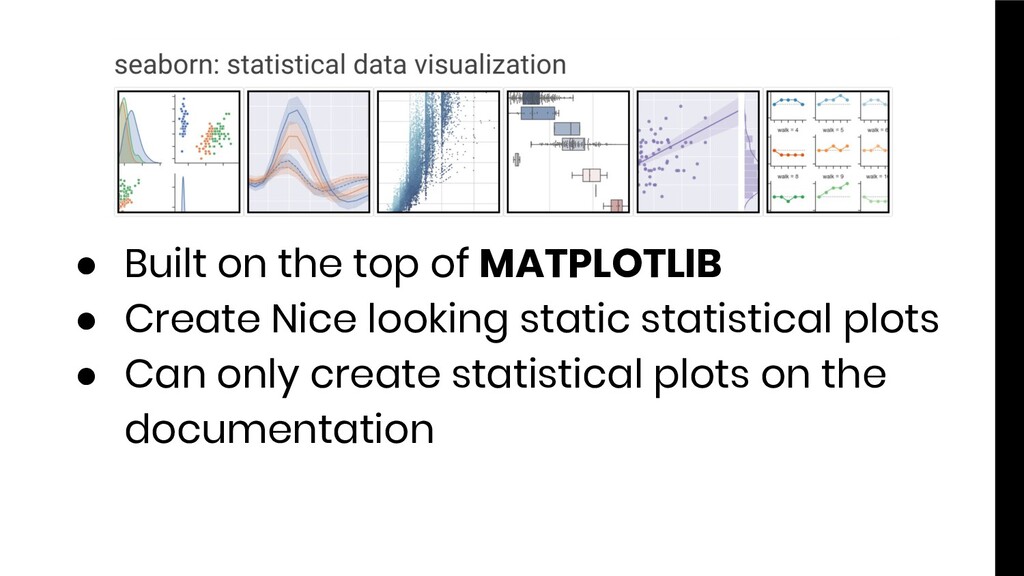
• Built on the top of MATPLOTLIB • Create Nice
looking static statistical plots • Can only create statistical plots on the documentation
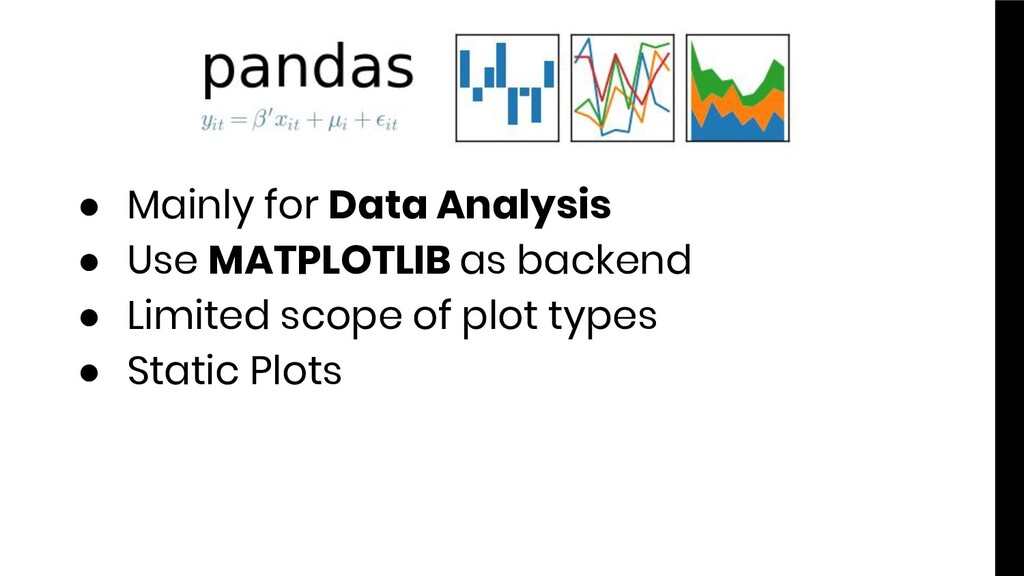
• Mainly for Data Analysis • Use MATPLOTLIB as backend
• Limited scope of plot types • Static Plots
• Interactivity / Web View • Geographical visualization • Fully
Open Source • Newer tool with a smaller user-base than matplotlib • Generated html file or a server
• Can cause confusion because Plotly is both a company
and an open source libary • Focused on interactive visualizations • Plotly has libraries for Javascript, React, R, and Python
None
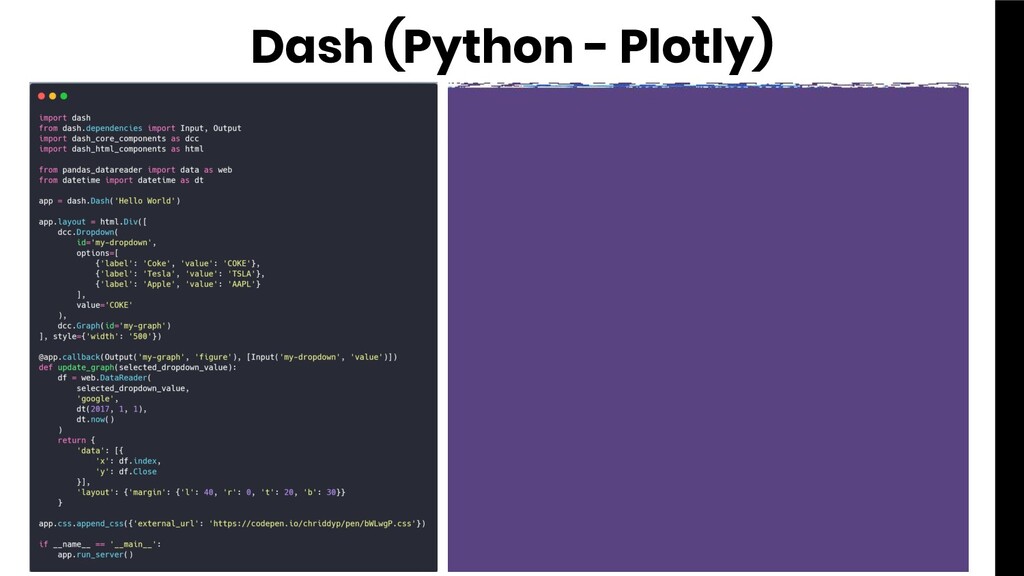
• Can create a fully web app dashboard with multiple
components, interactivity, and multiplots • It created by Plotly based on Flask and React • No Javascript required
NO JAVASCRIPT REQUIRED
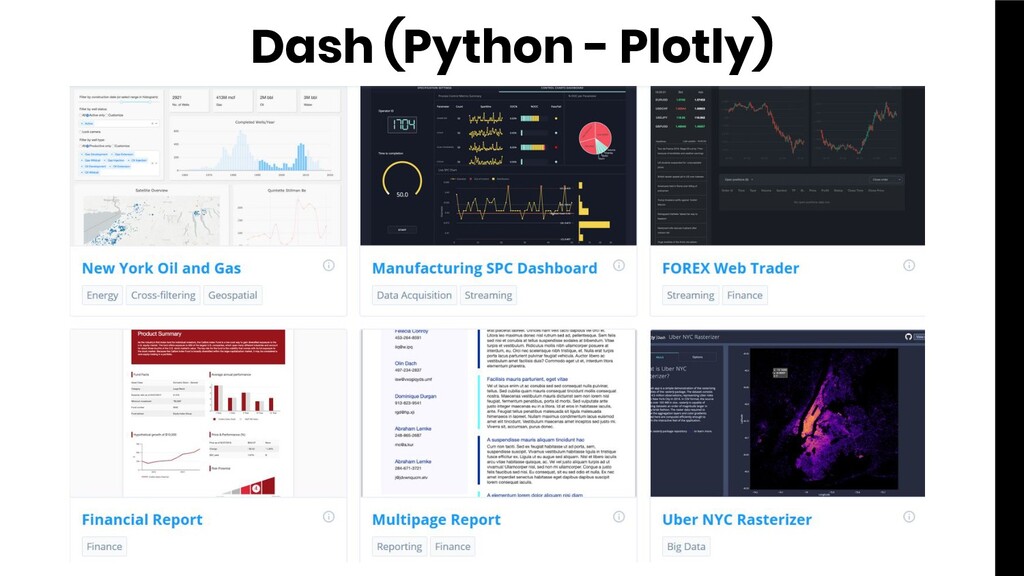
Dash (Python - Plotly)
Dash (Python - Plotly)
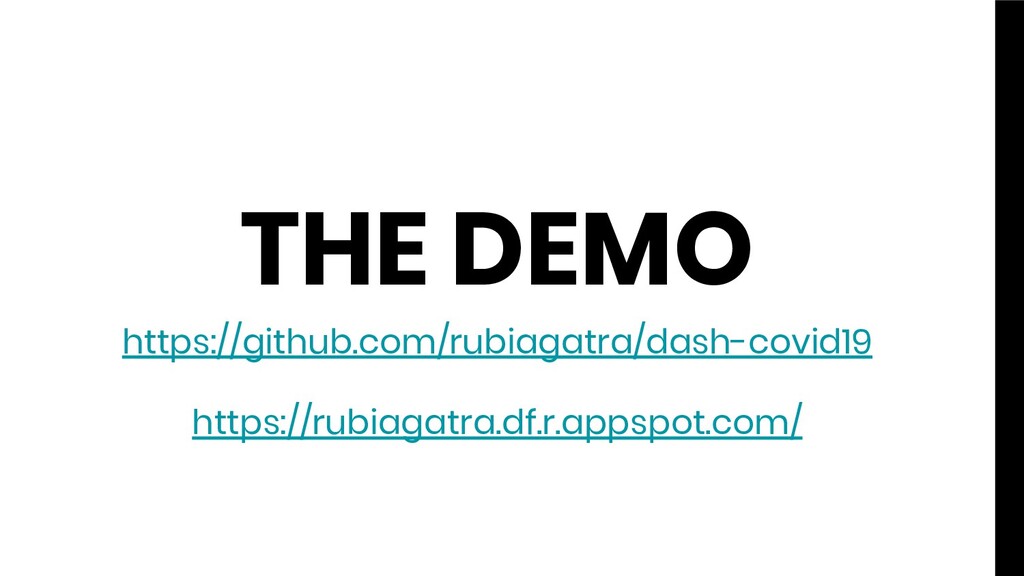
THE DEMO https://github.com/rubiagatra/dash-covid19 https://rubiagatra.df.r.appspot.com/
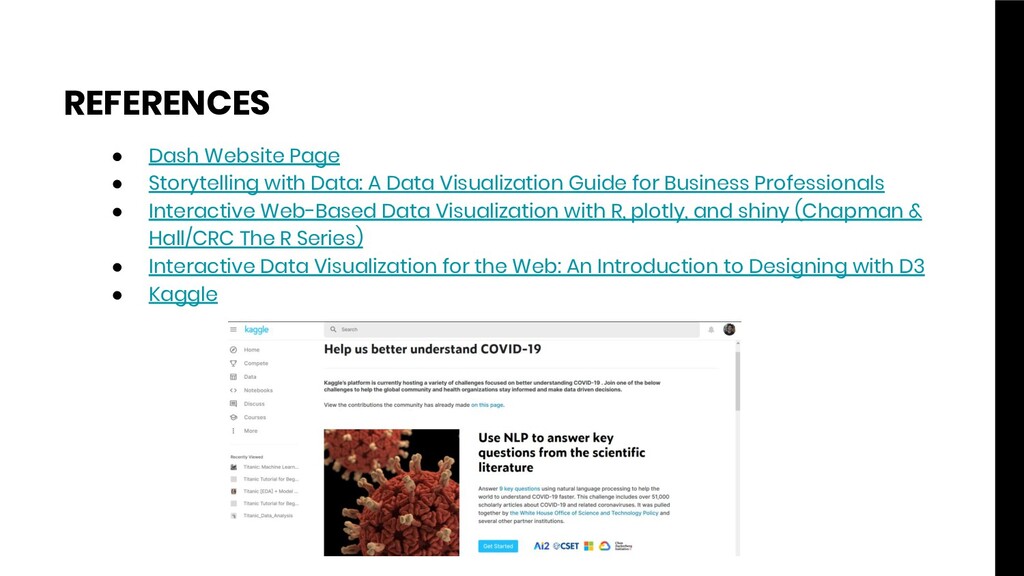
REFERENCES • Dash Website Page • Storytelling with Data: A
Data Visualization Guide for Business Professionals • Interactive Web-Based Data Visualization with R, plotly, and shiny (Chapman & Hall/CRC The R Series) • Interactive Data Visualization for the Web: An Introduction to Designing with D3 • Kaggle
Thanks for listening! Any questions? Doni Rubiagatra
[email protected]
surabaya.py -
26 April 2020 Interactive Python Dashboard with Dash and Deploy to Google Cloud Platform
![Thanks for listening! Any questions? Doni Rubiagatra [email protected] surabaya.py -](https://files.speakerdeck.com/presentations/8a8ff1f069c4476880cf6fc97877e8fd/slide_16.jpg)